The Energy Consulting Group
Management consultants for upstream oil and gas producers and service companies
|
E&P News and Information Scandinavian International and National International Energy
Agency Department of Trade and Norwegian
Petroleum Ministry of Industry
and E&P Project Information |
|---|
(Demand, Production, Imports, Exports, and Price)
|
Web Page Table of Contents US Natural Gas: Storage Levels (Current, and Historical) US Temperature Outlooks (day, week, month) US Natural Gas: Supply Summary US Natural Gas: Demand Summary US Natural Gas: LNG and Pipeline Export Summary US Natural Gas: Drilling Activity Summary Role of Natural Gas in Power Generation and Demise of Coal North American Natural Gas Pricing: Historical, Future and Recent (Spot at Select Hubs) Shale Gas Technology: Drilling and Well Productivity Trends Amount of Natural Gas Elon Musk's LNG fueled Starships will Consume With Each Launch and Potentially Across a Fleet of Such Rockets |
|
| The North American Natural Gas Market Contact us at insight@energy-cg.com if you have questions about the North American natural gas market. |
|
|
|||||
|
|
|||||
|
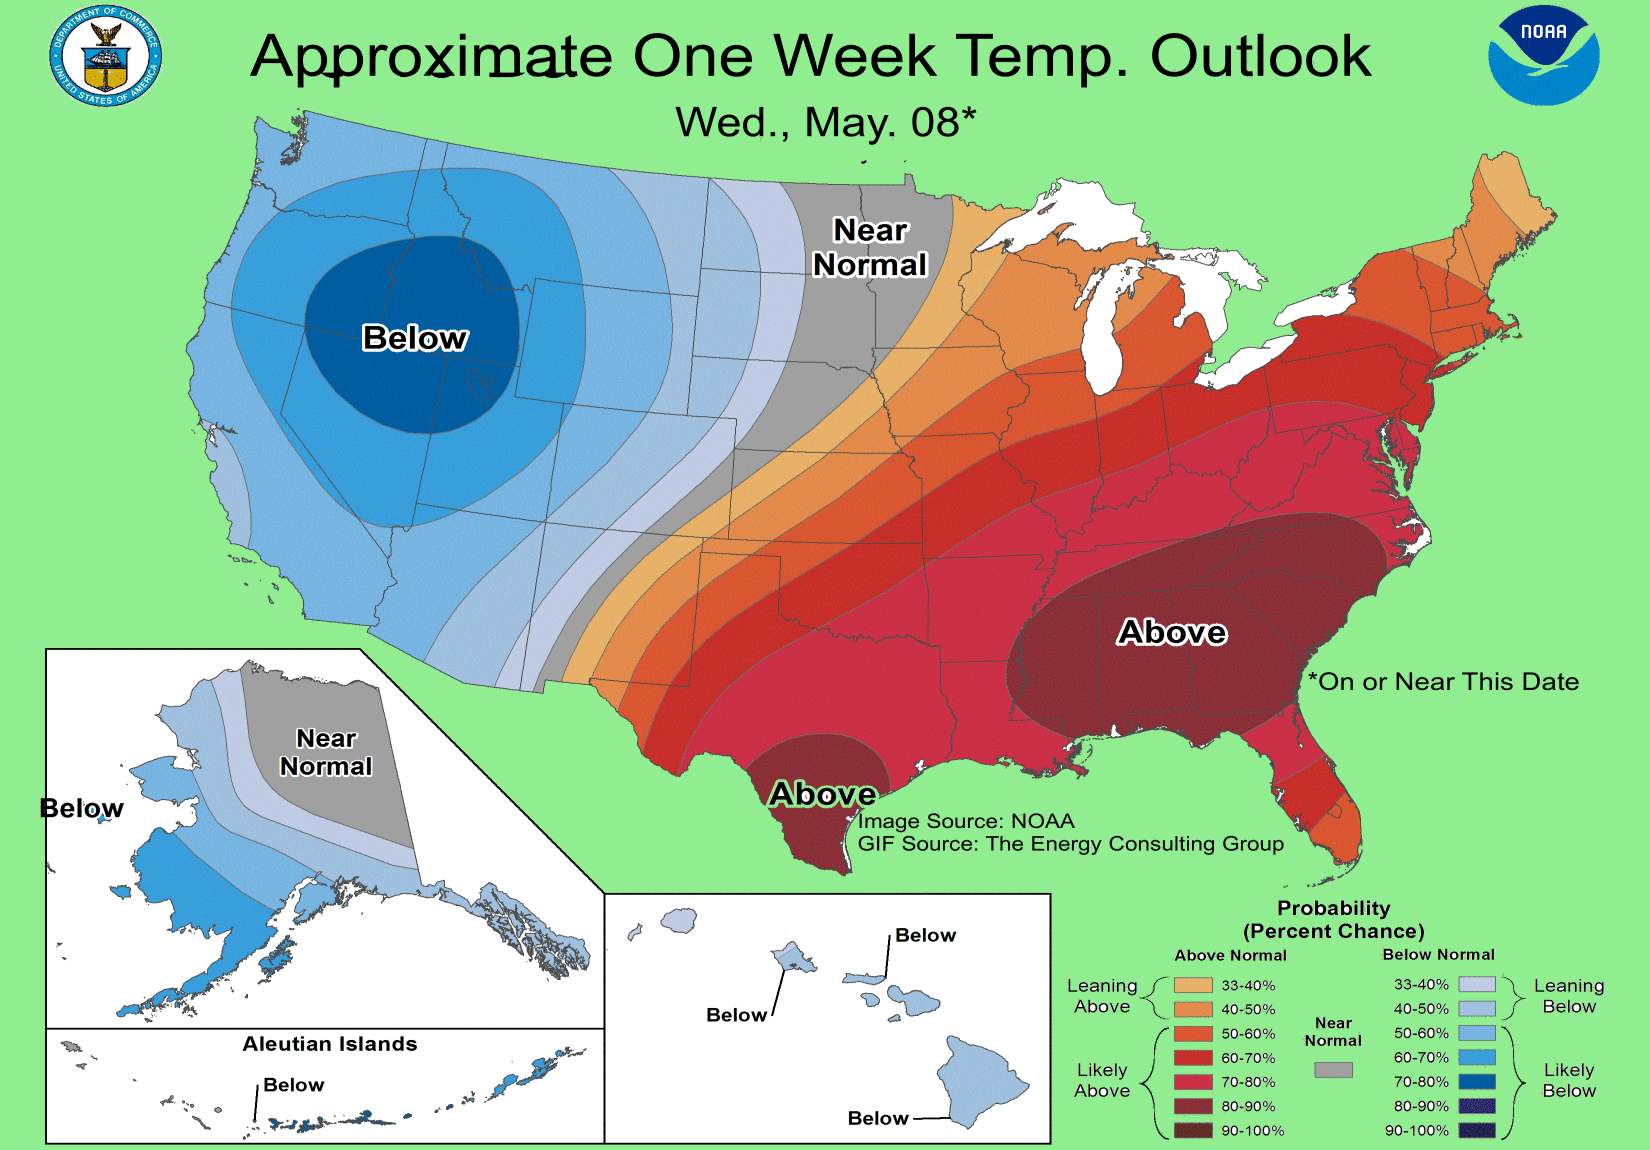
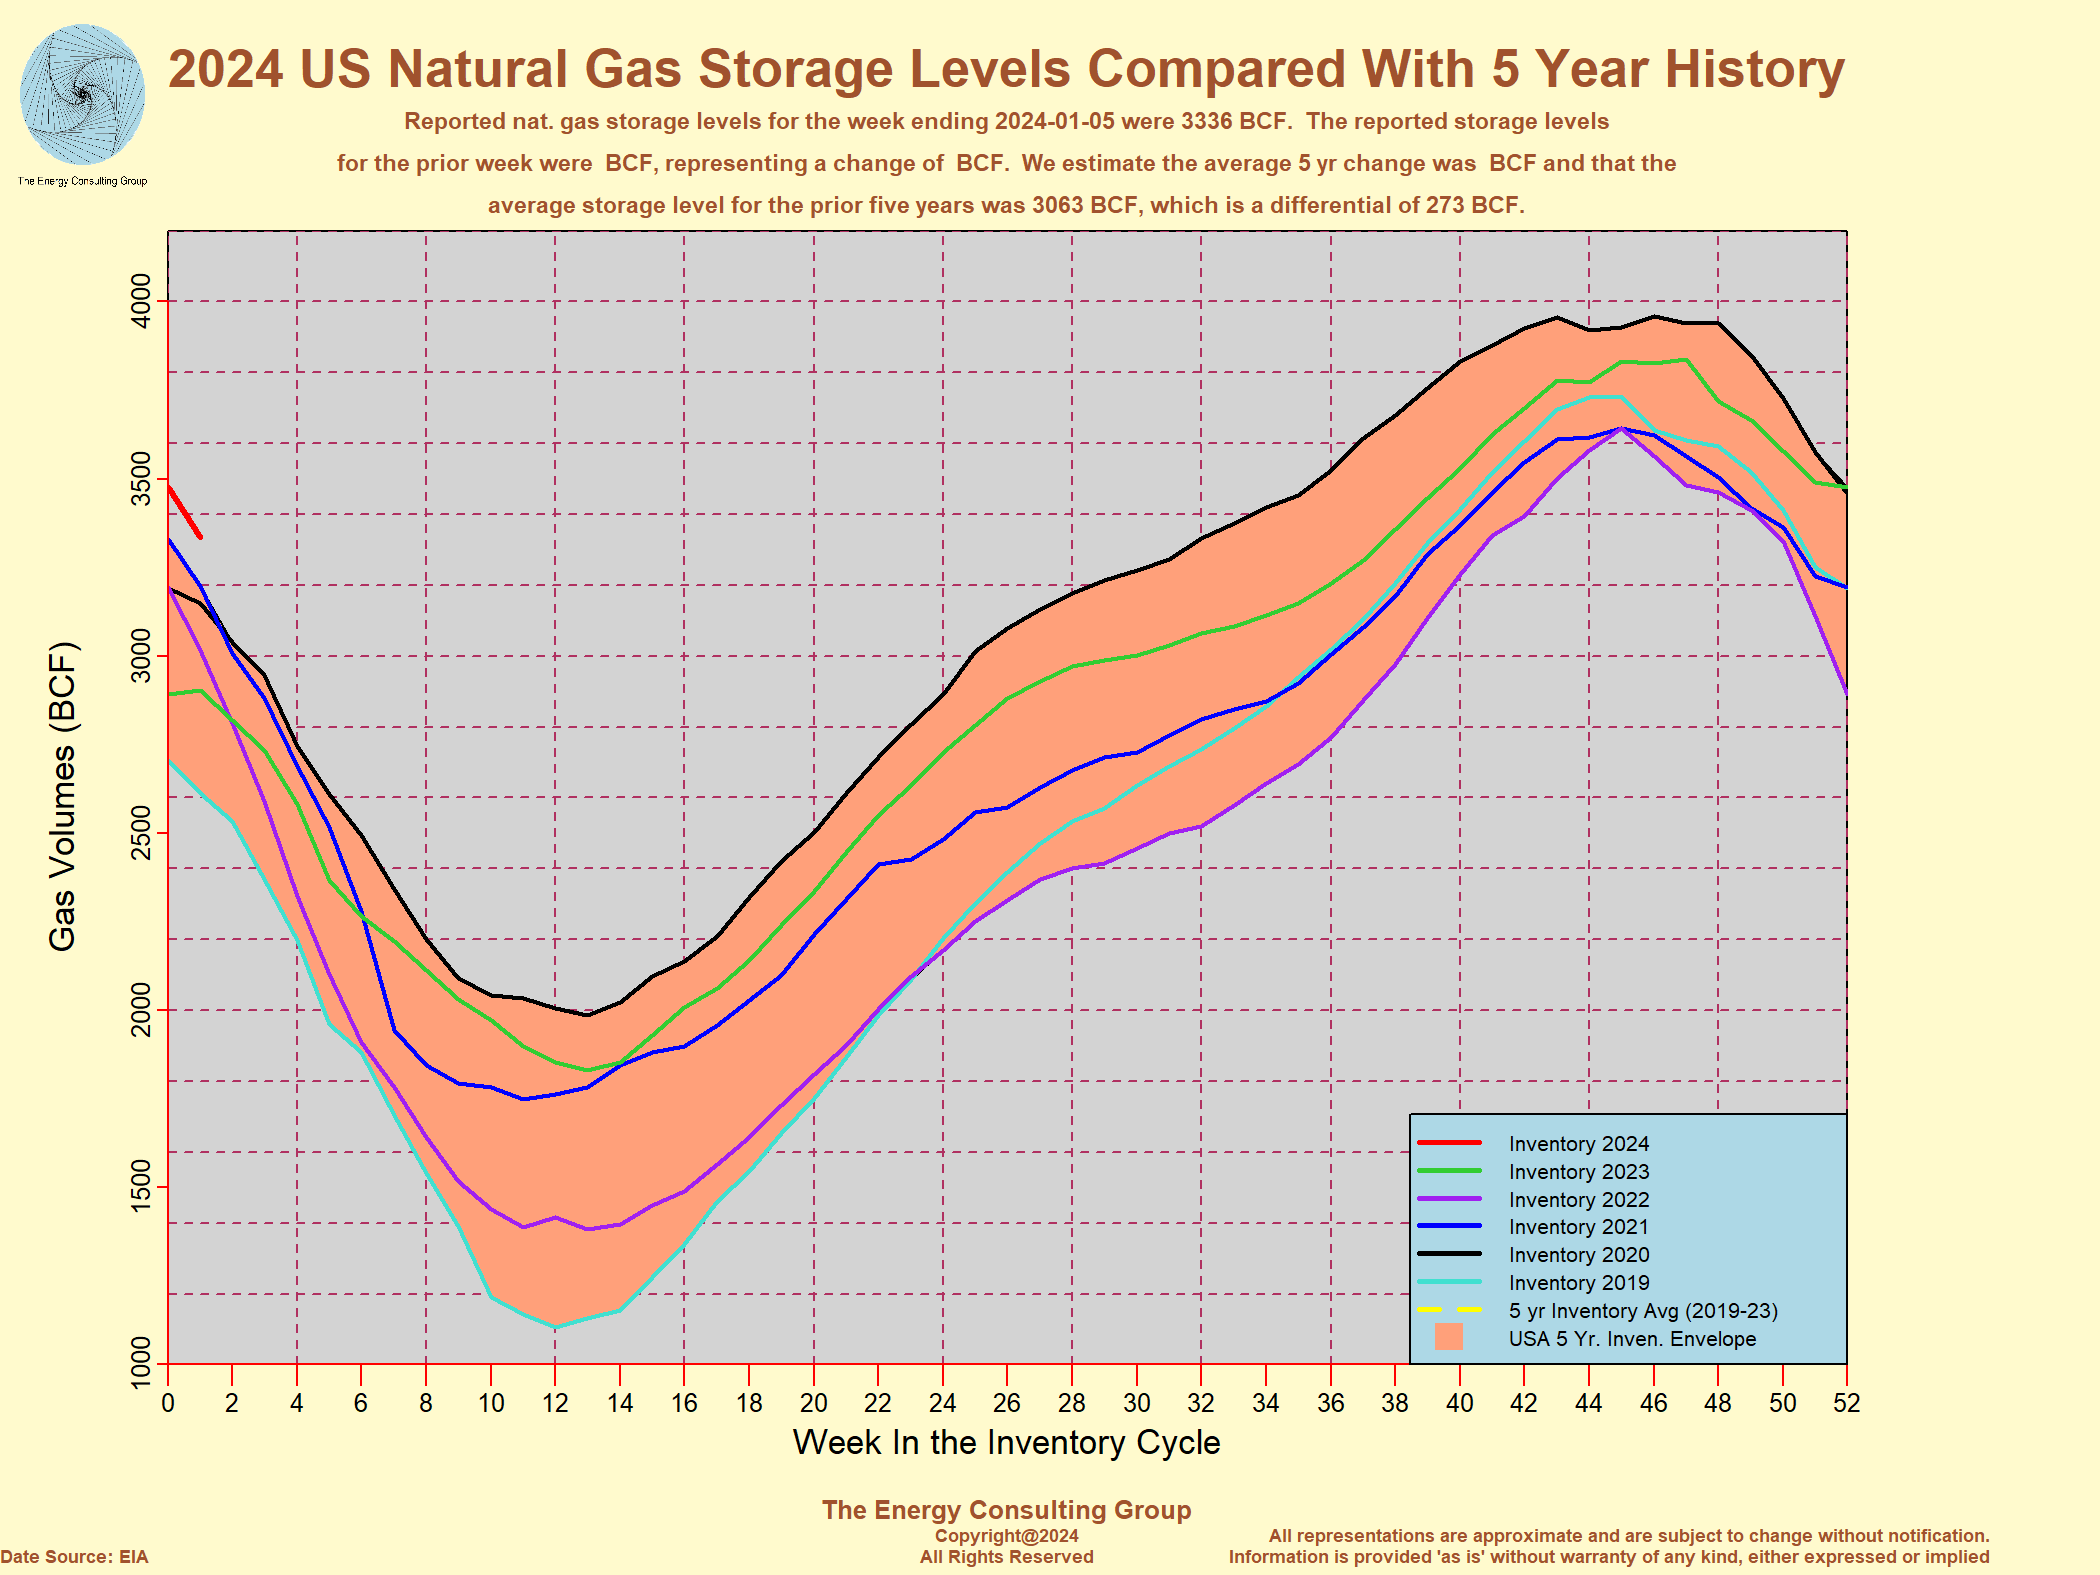
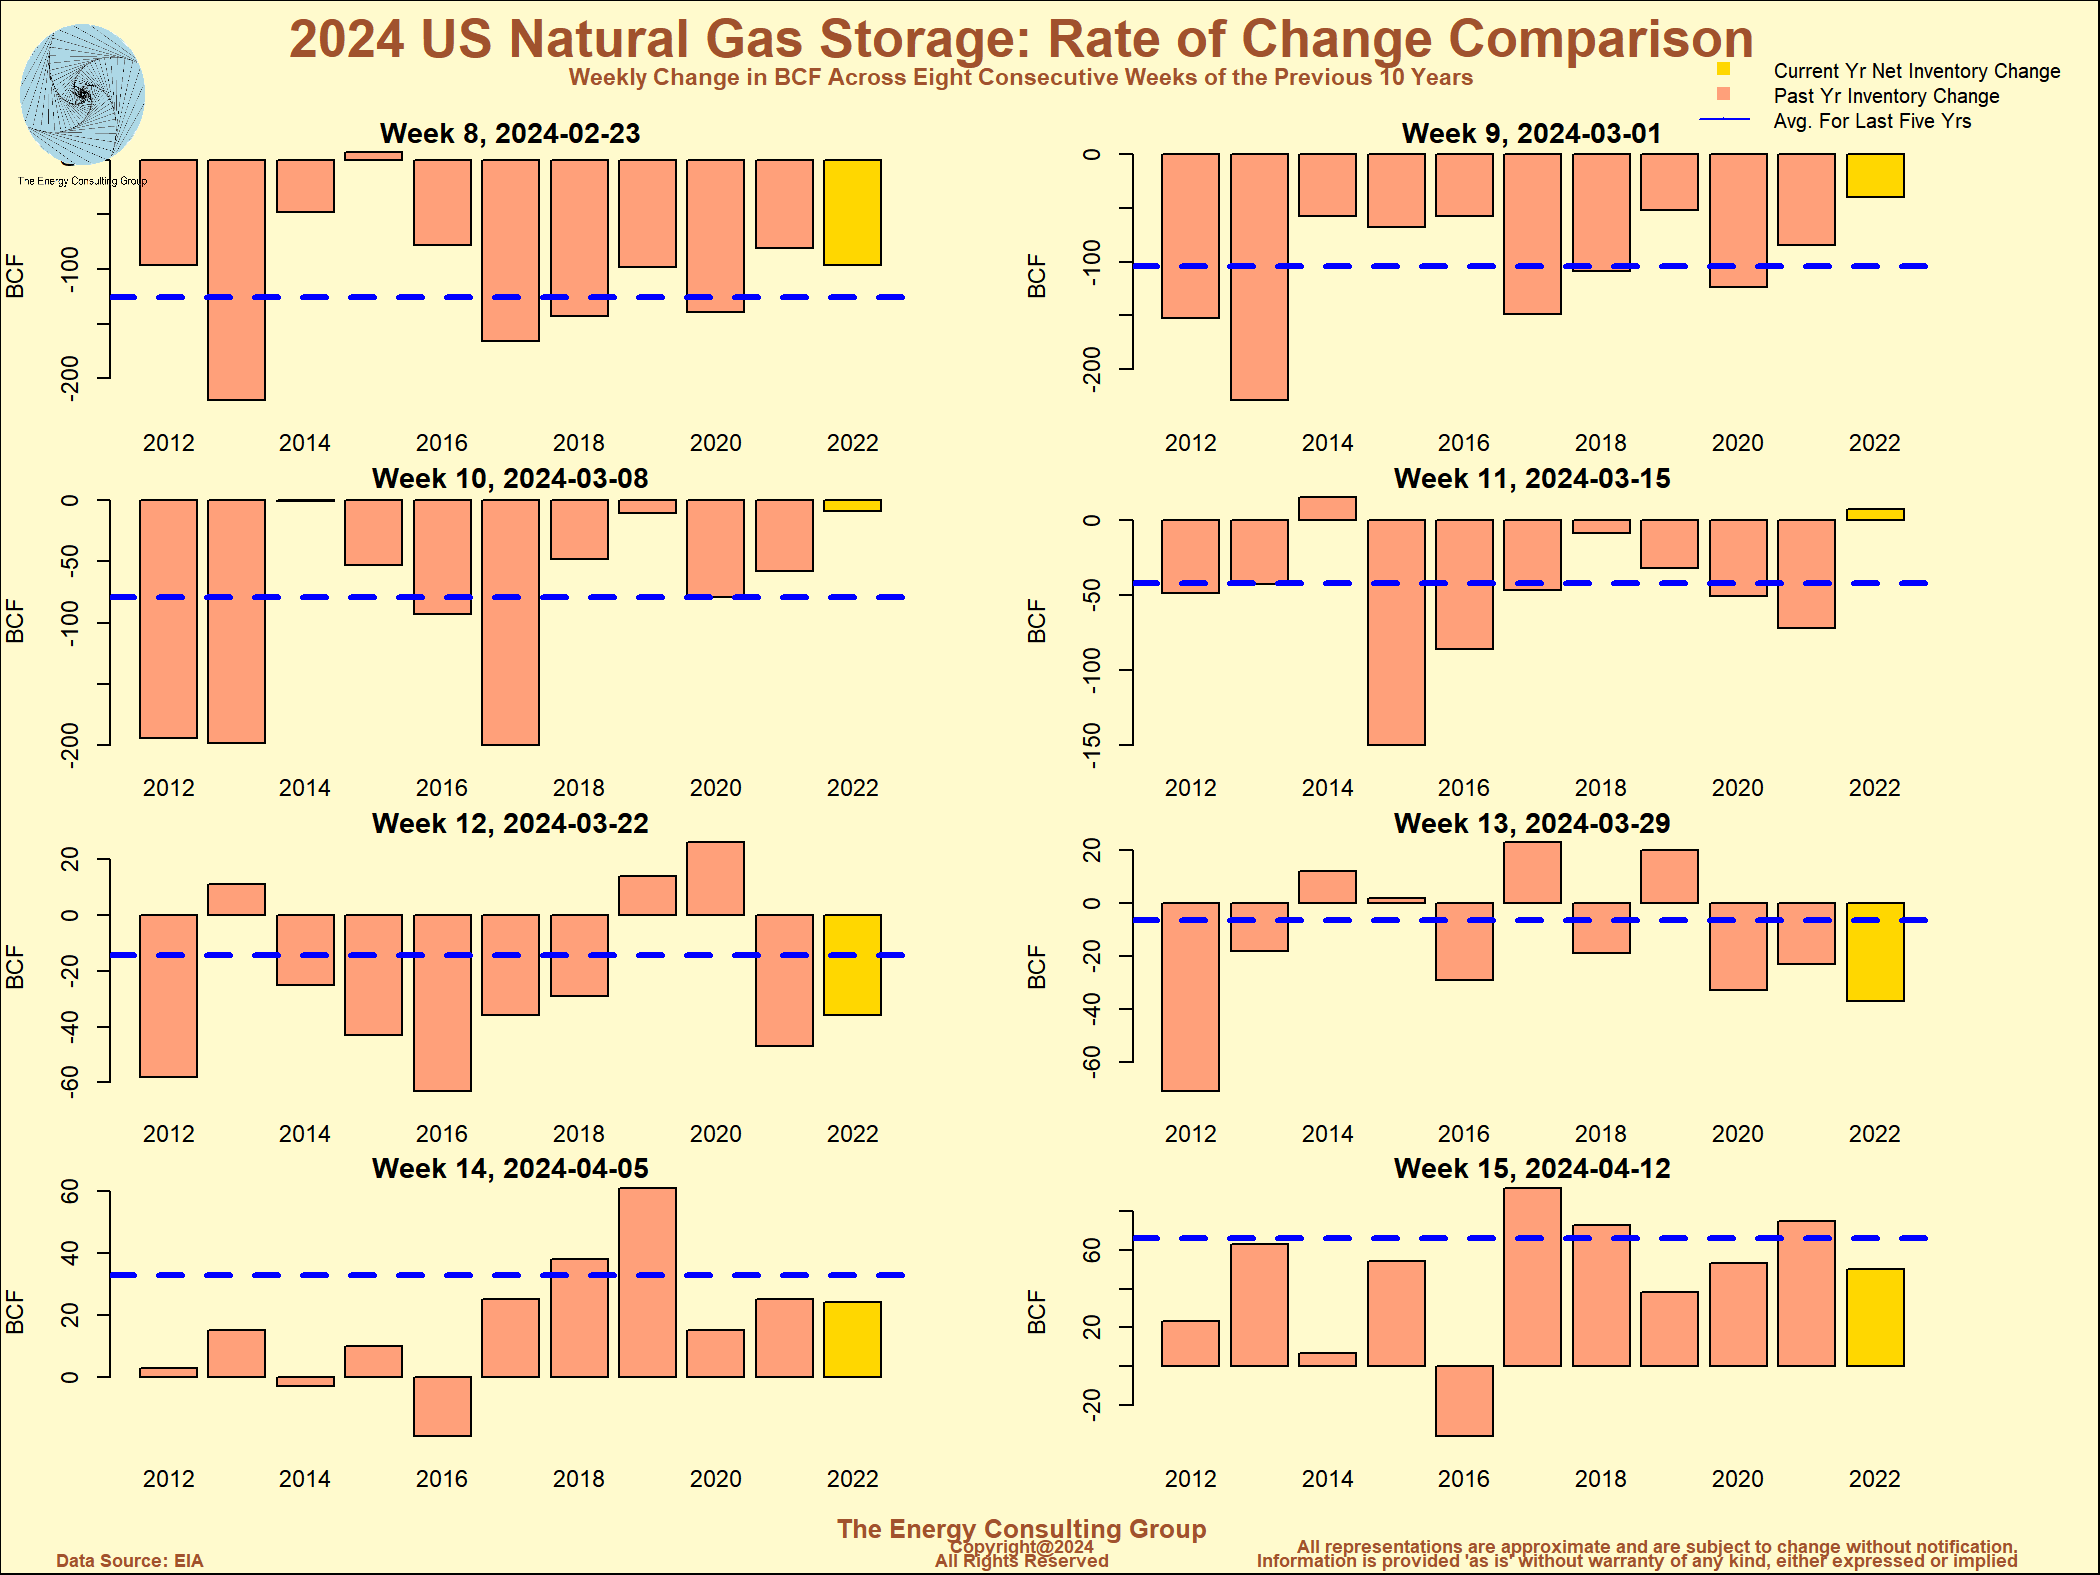
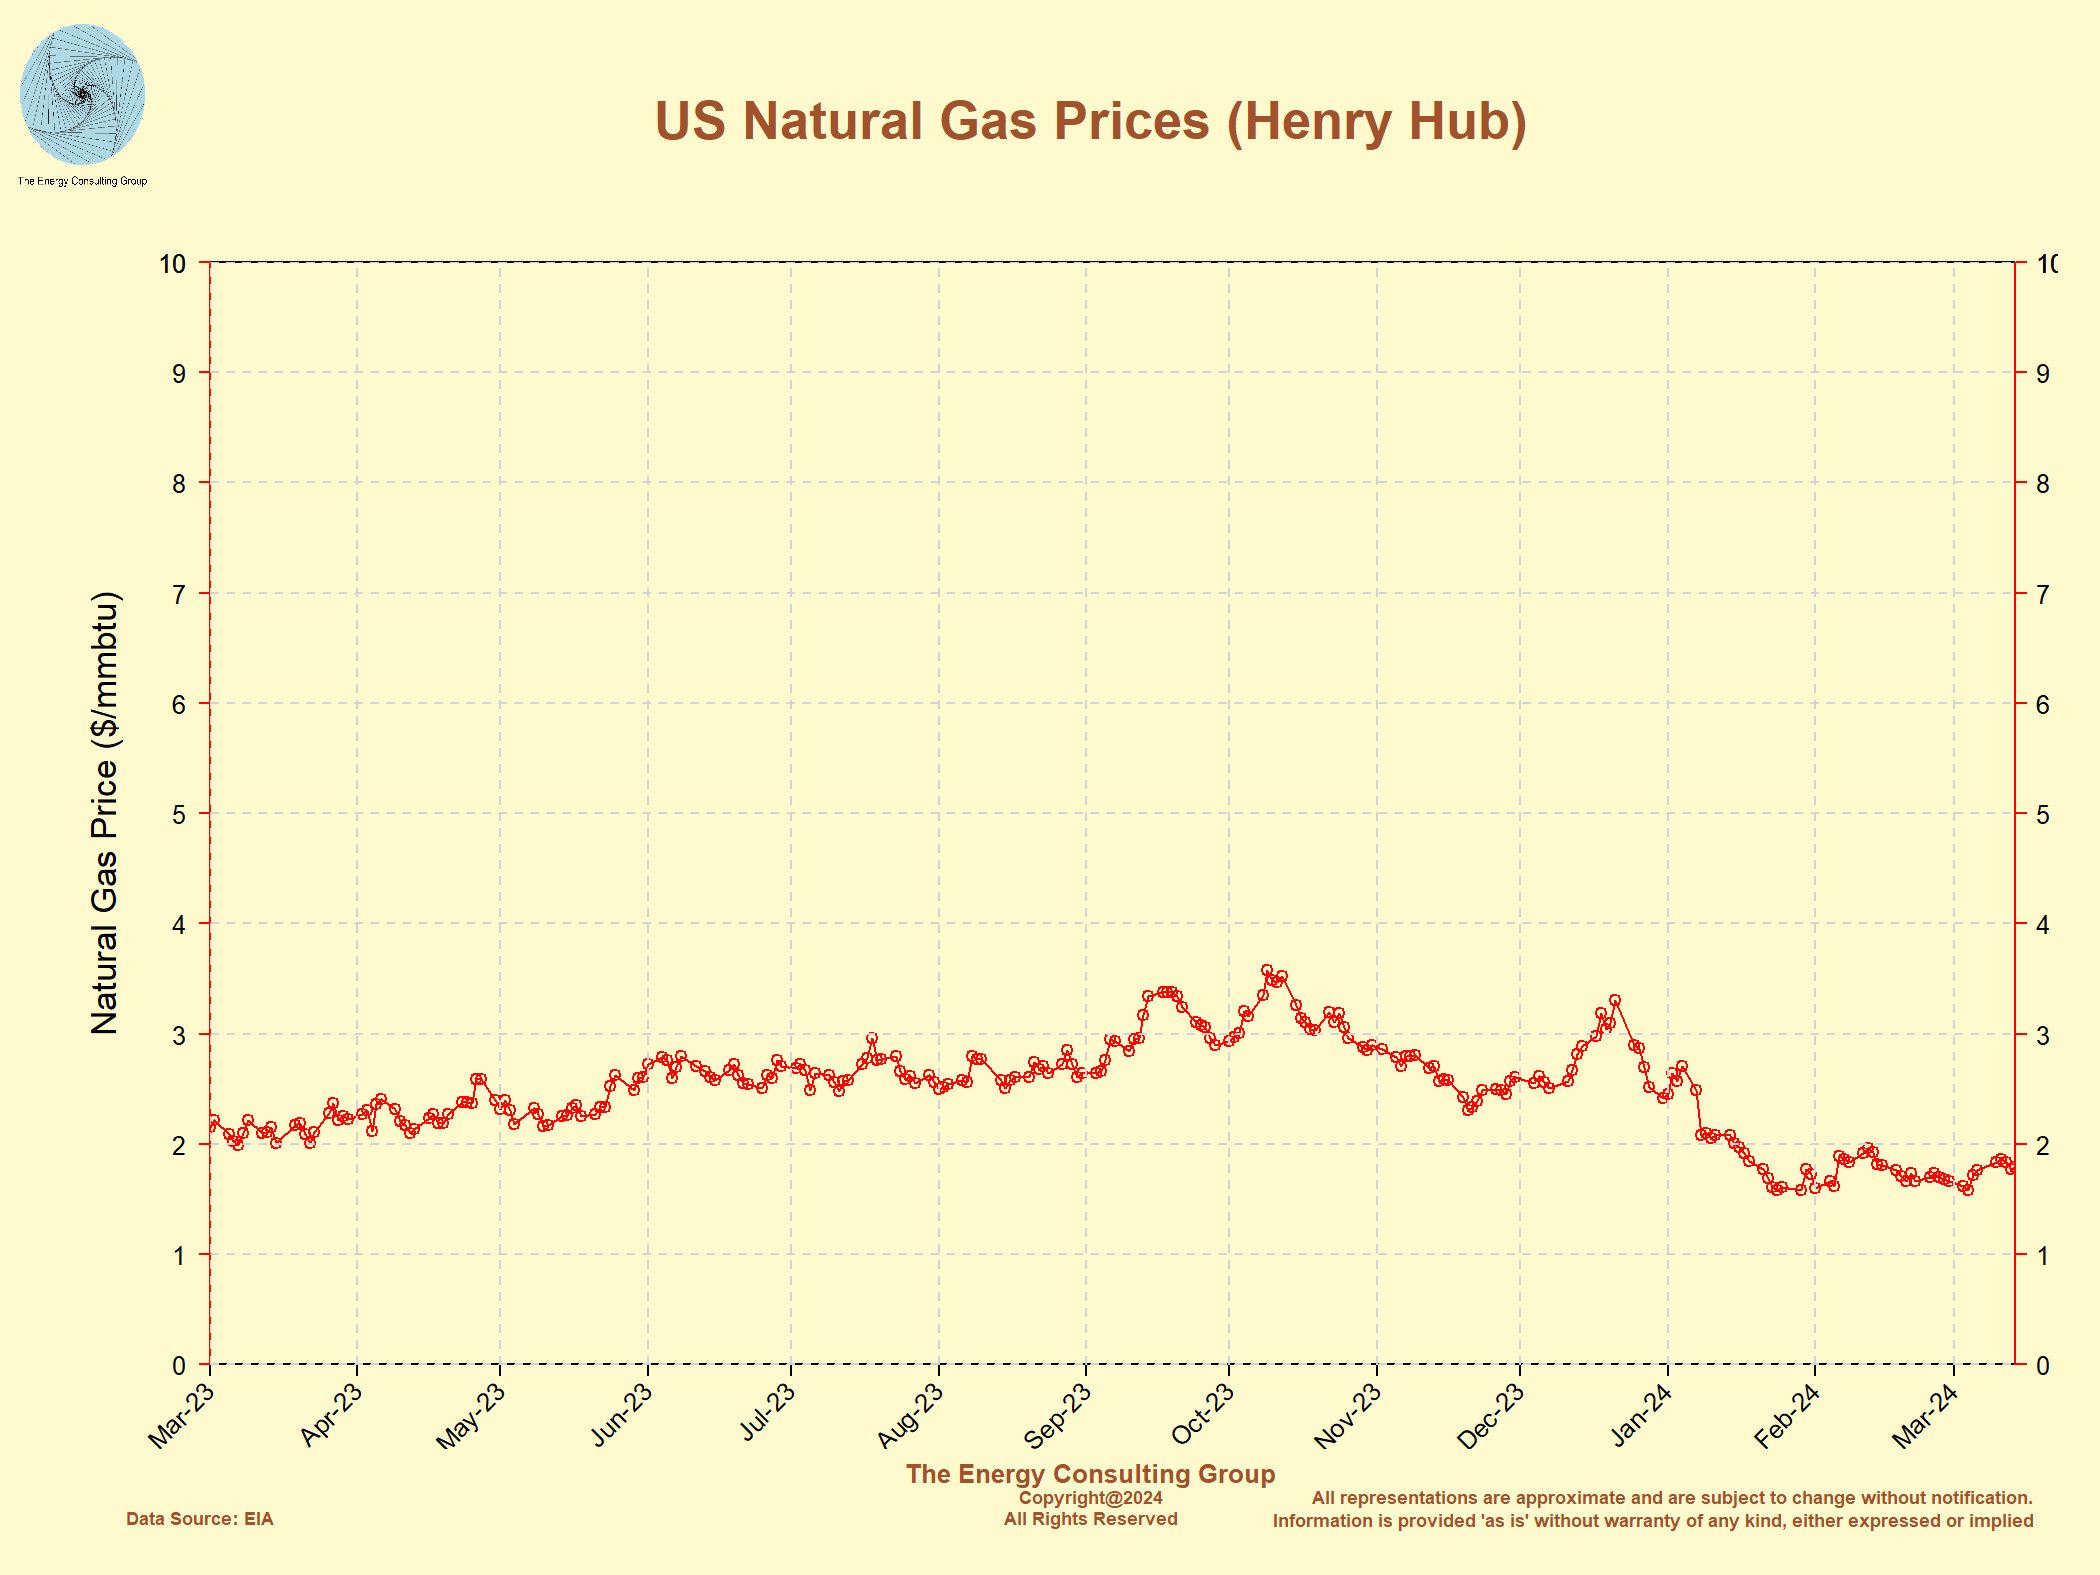
US Natural Gas Storage Levels
(Latest USA natural gas storage information) |
Add a comment or question. | ||||
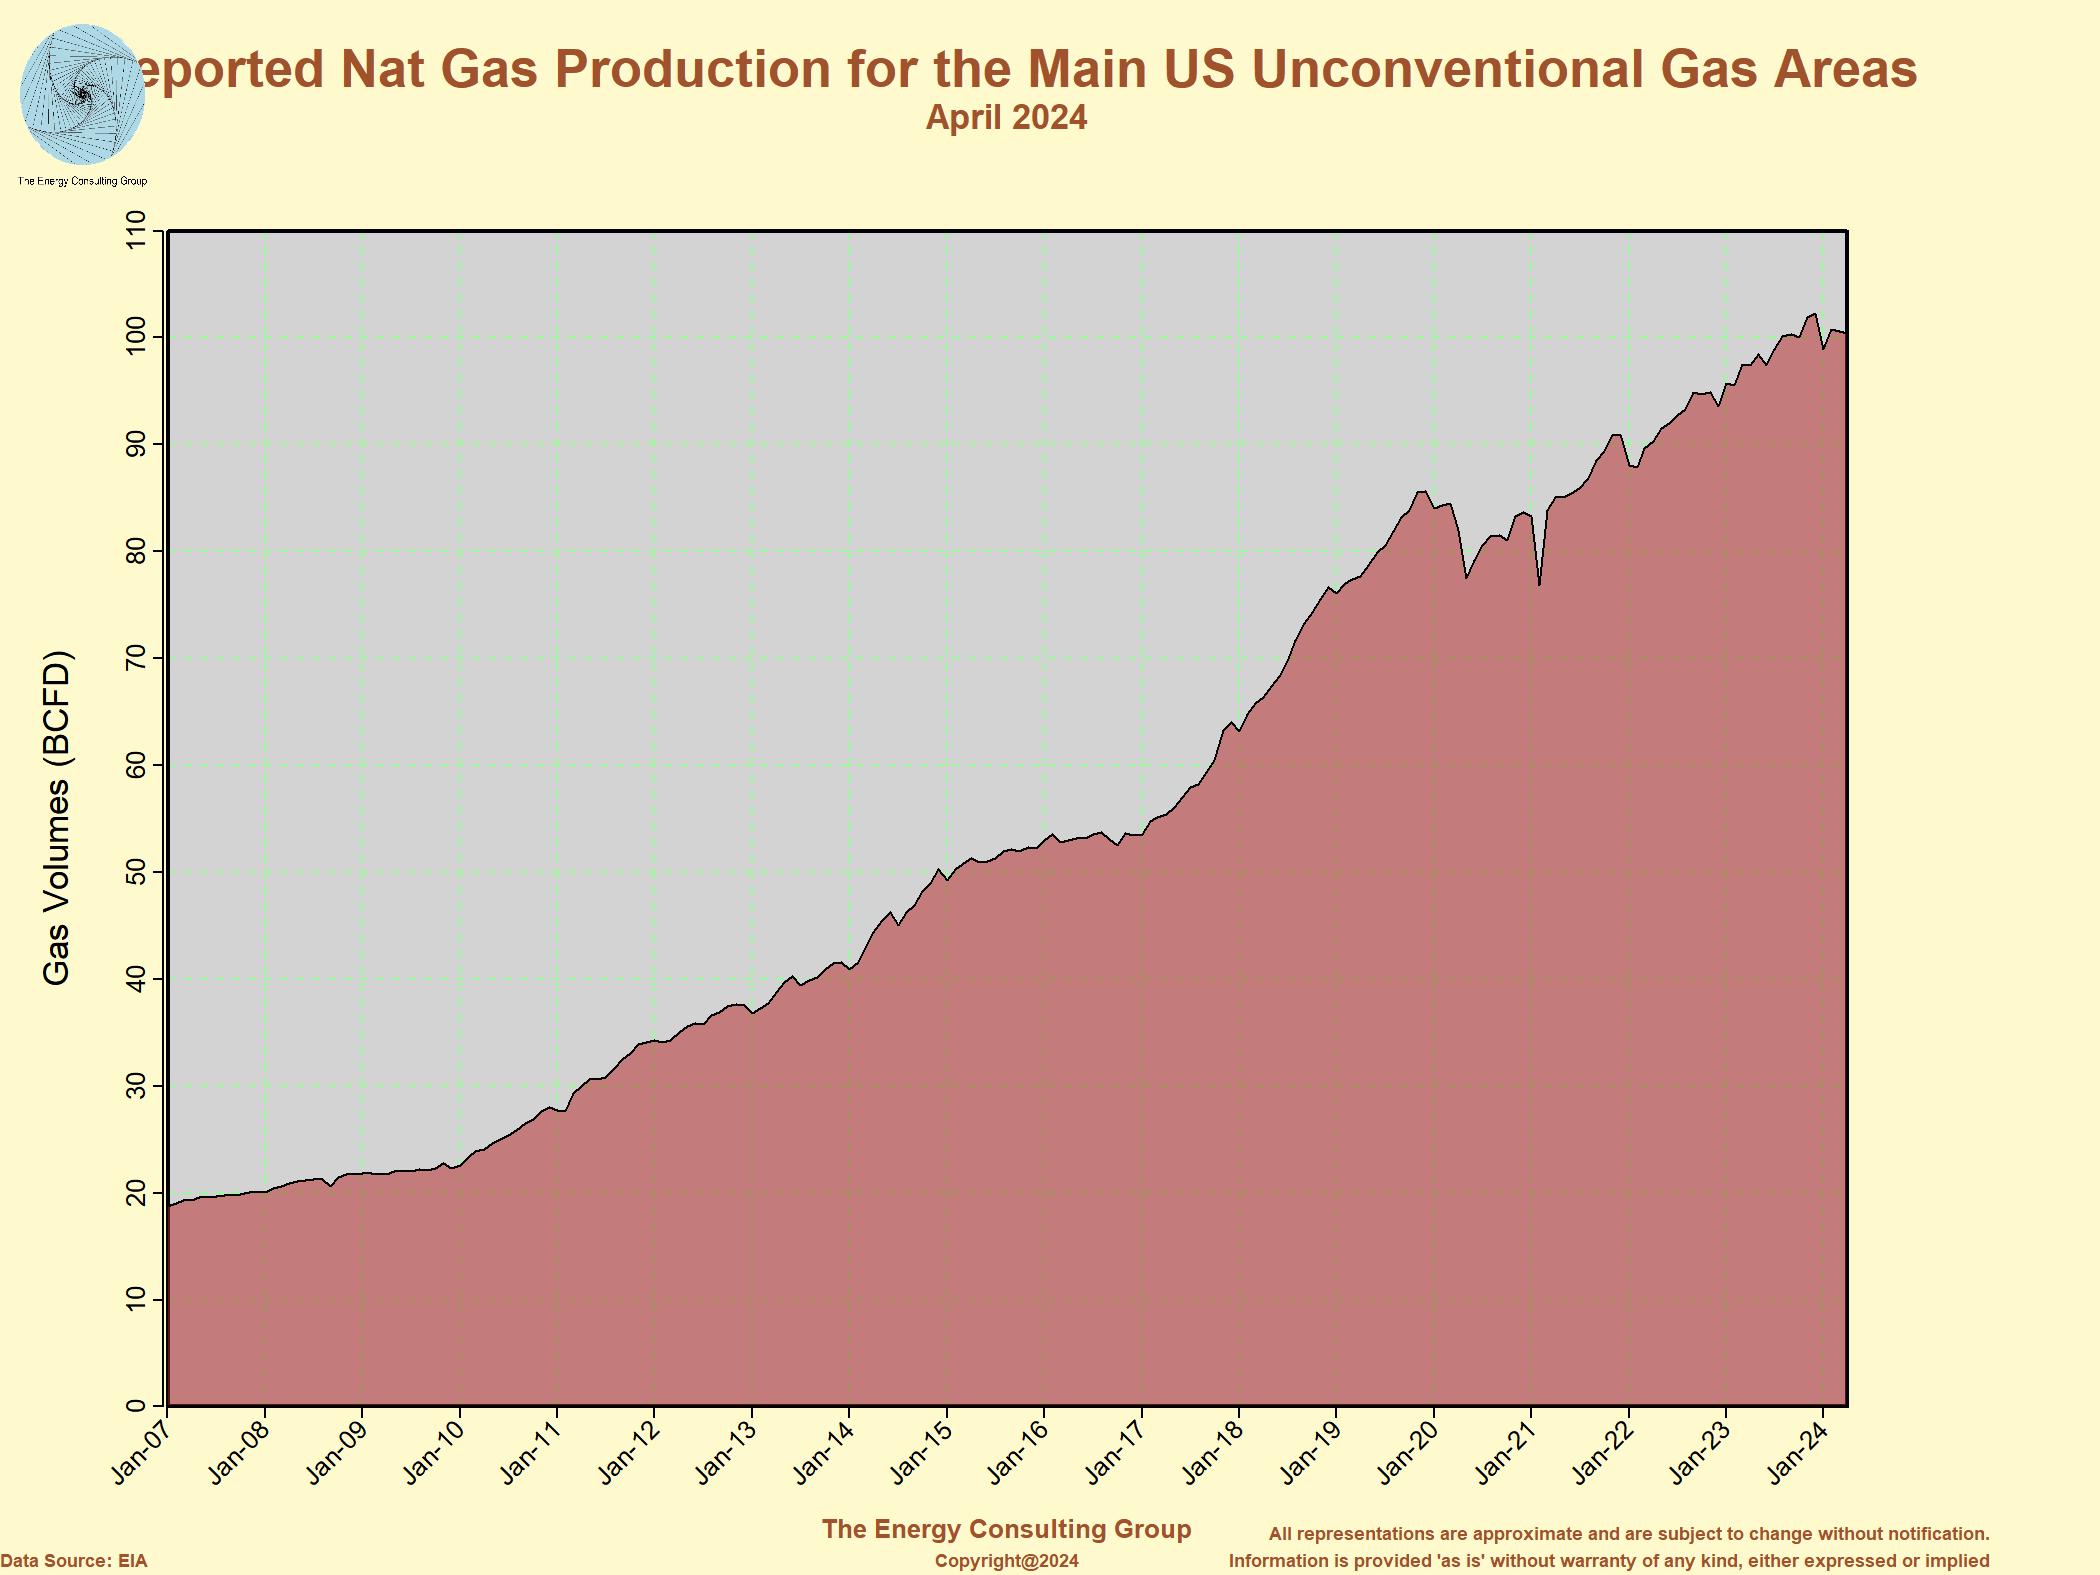


Reported Production for Main US Non-Conventional Regions For Larger, Higher Resolution View, Click Image |
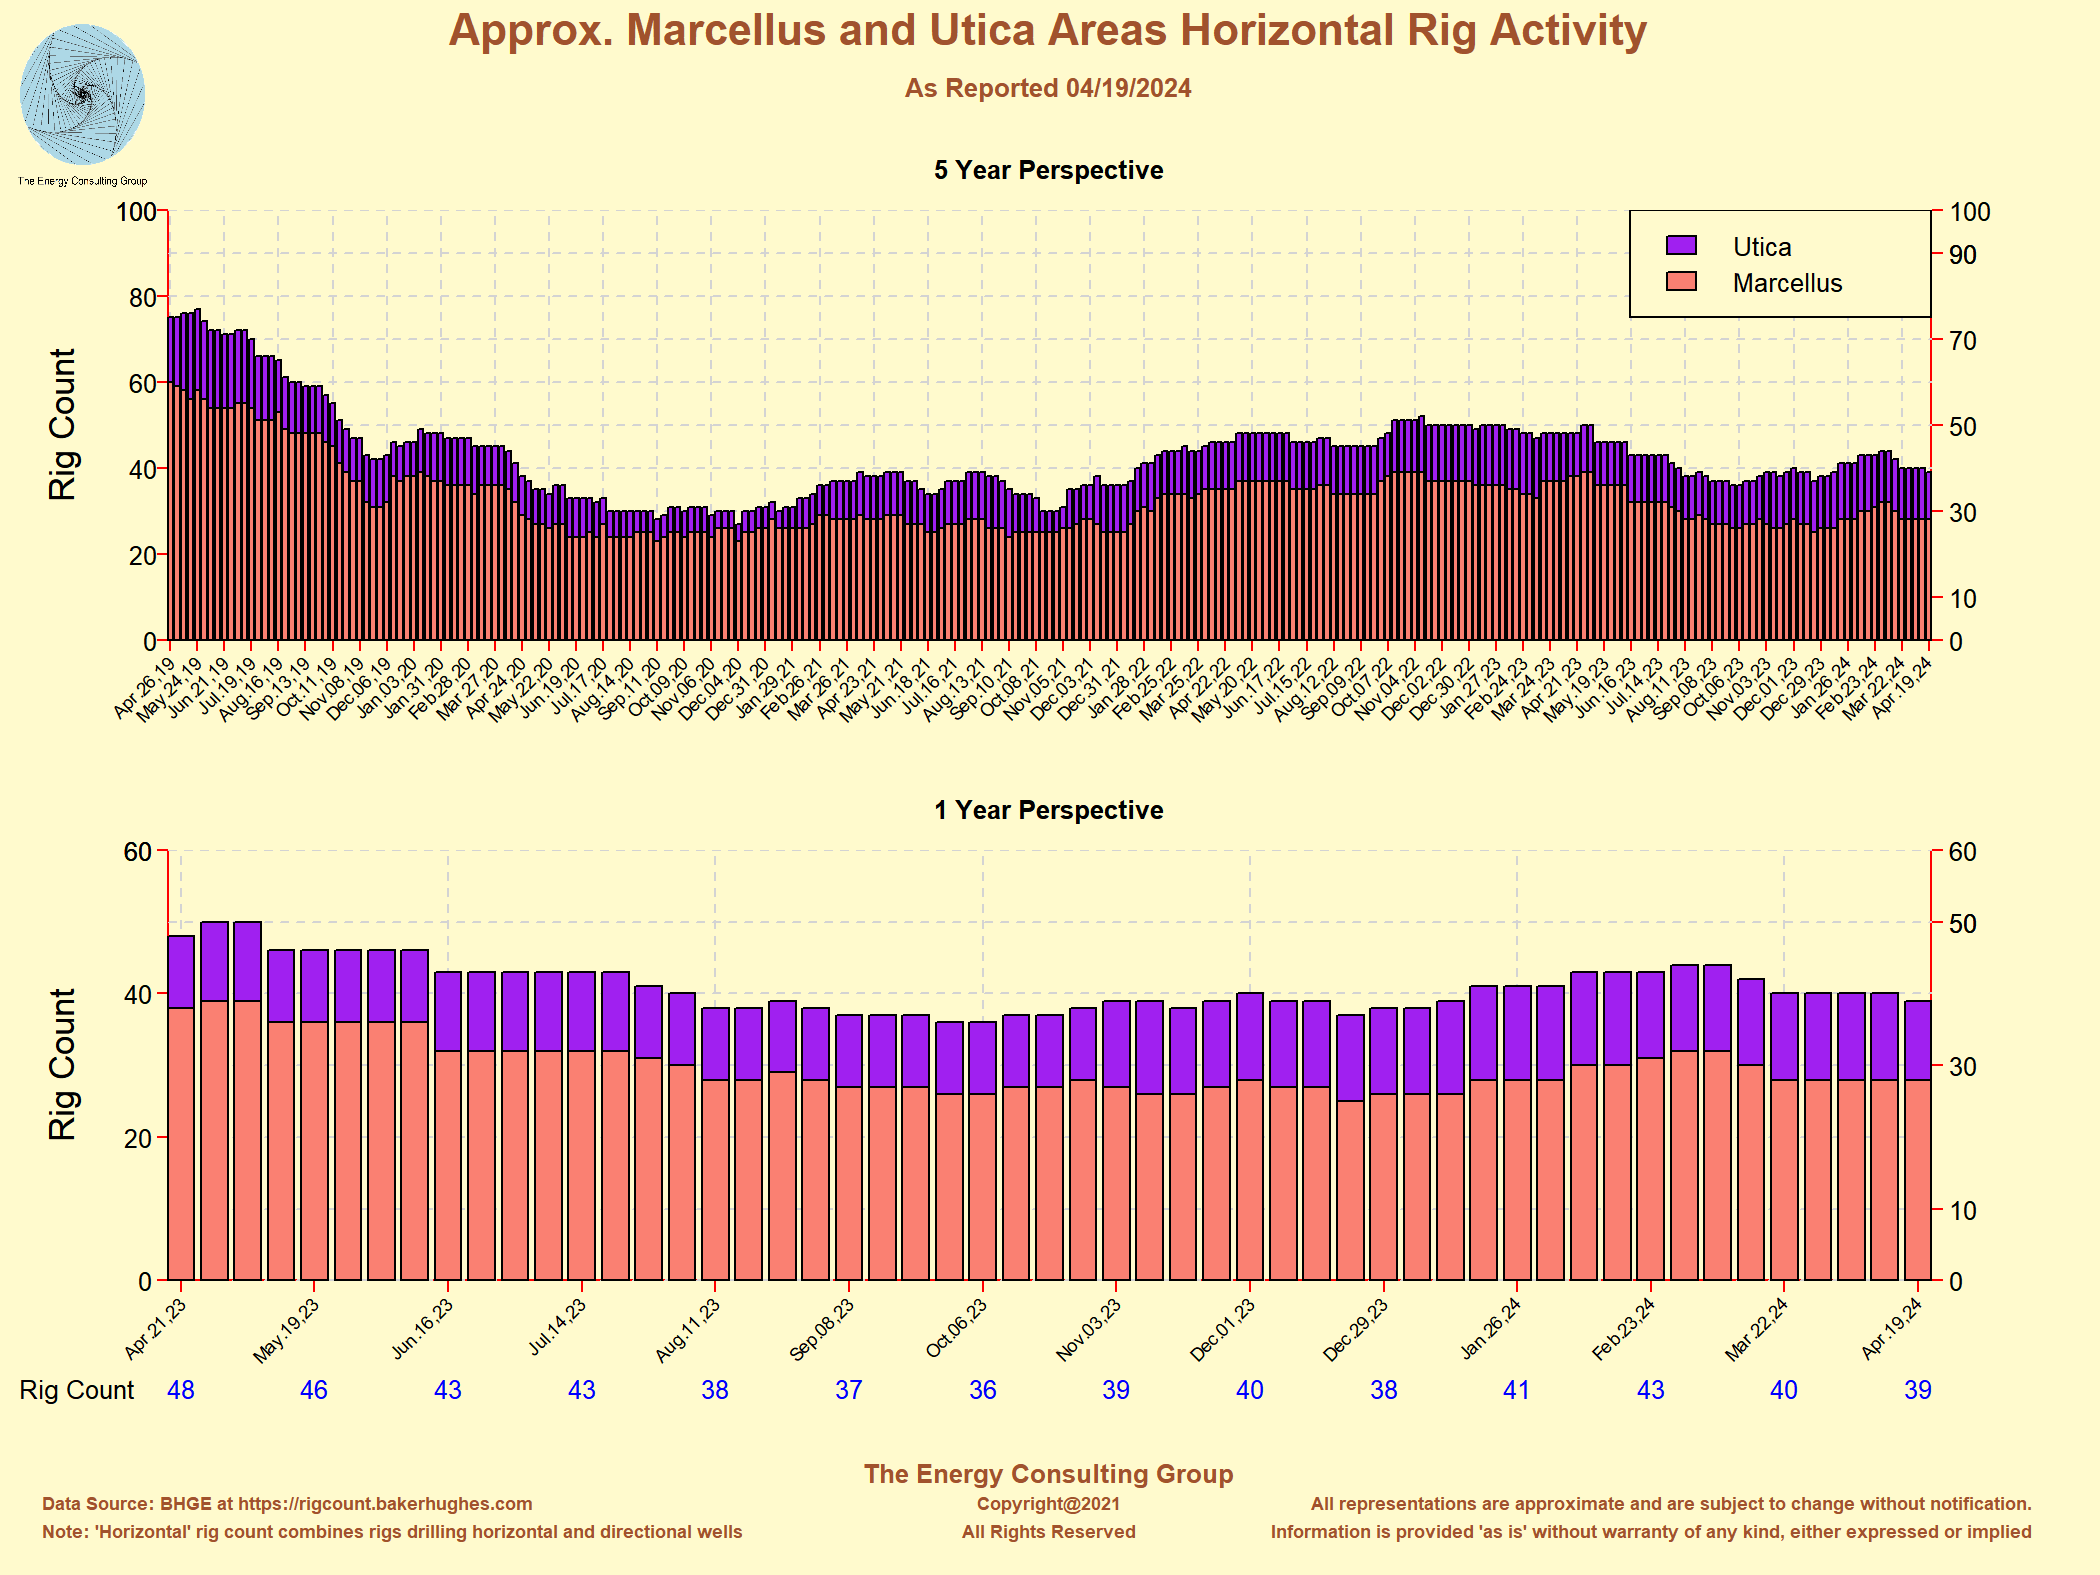
US Natural Gas Production with Marcellus, Utica, and Eagle Ford Breakout 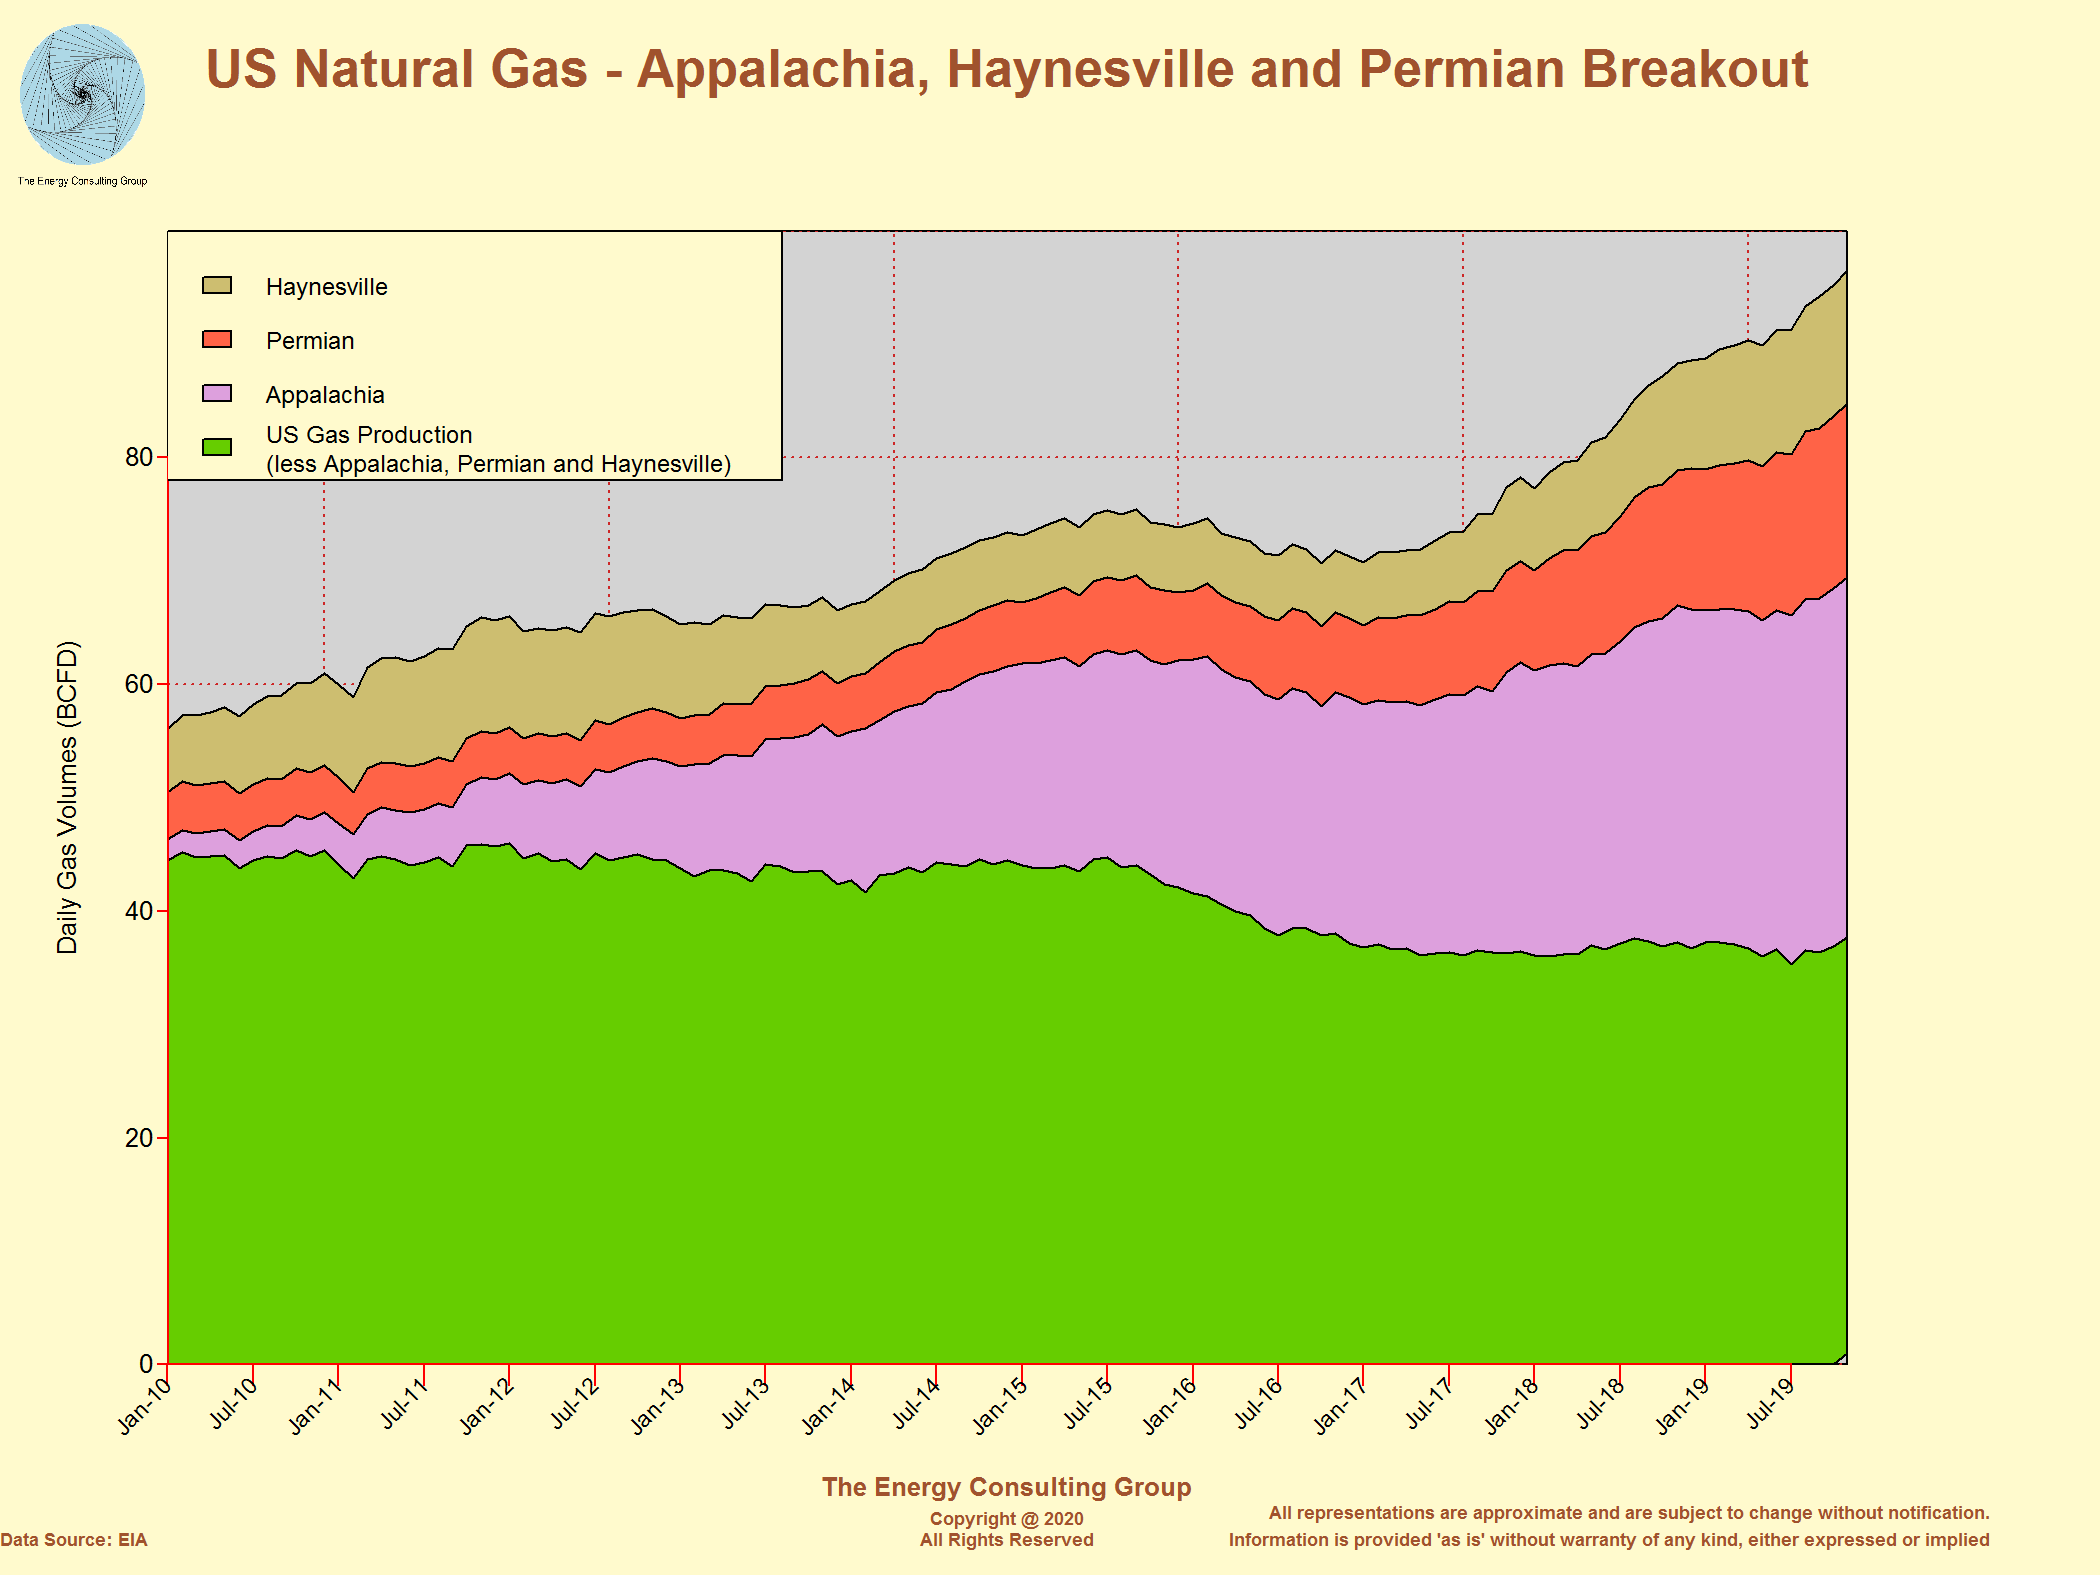 For Larger, Higher Resolution View, Click Image |
USGS Light, Tight Oil (Nonconventional) Delaware Basin Resource
Potential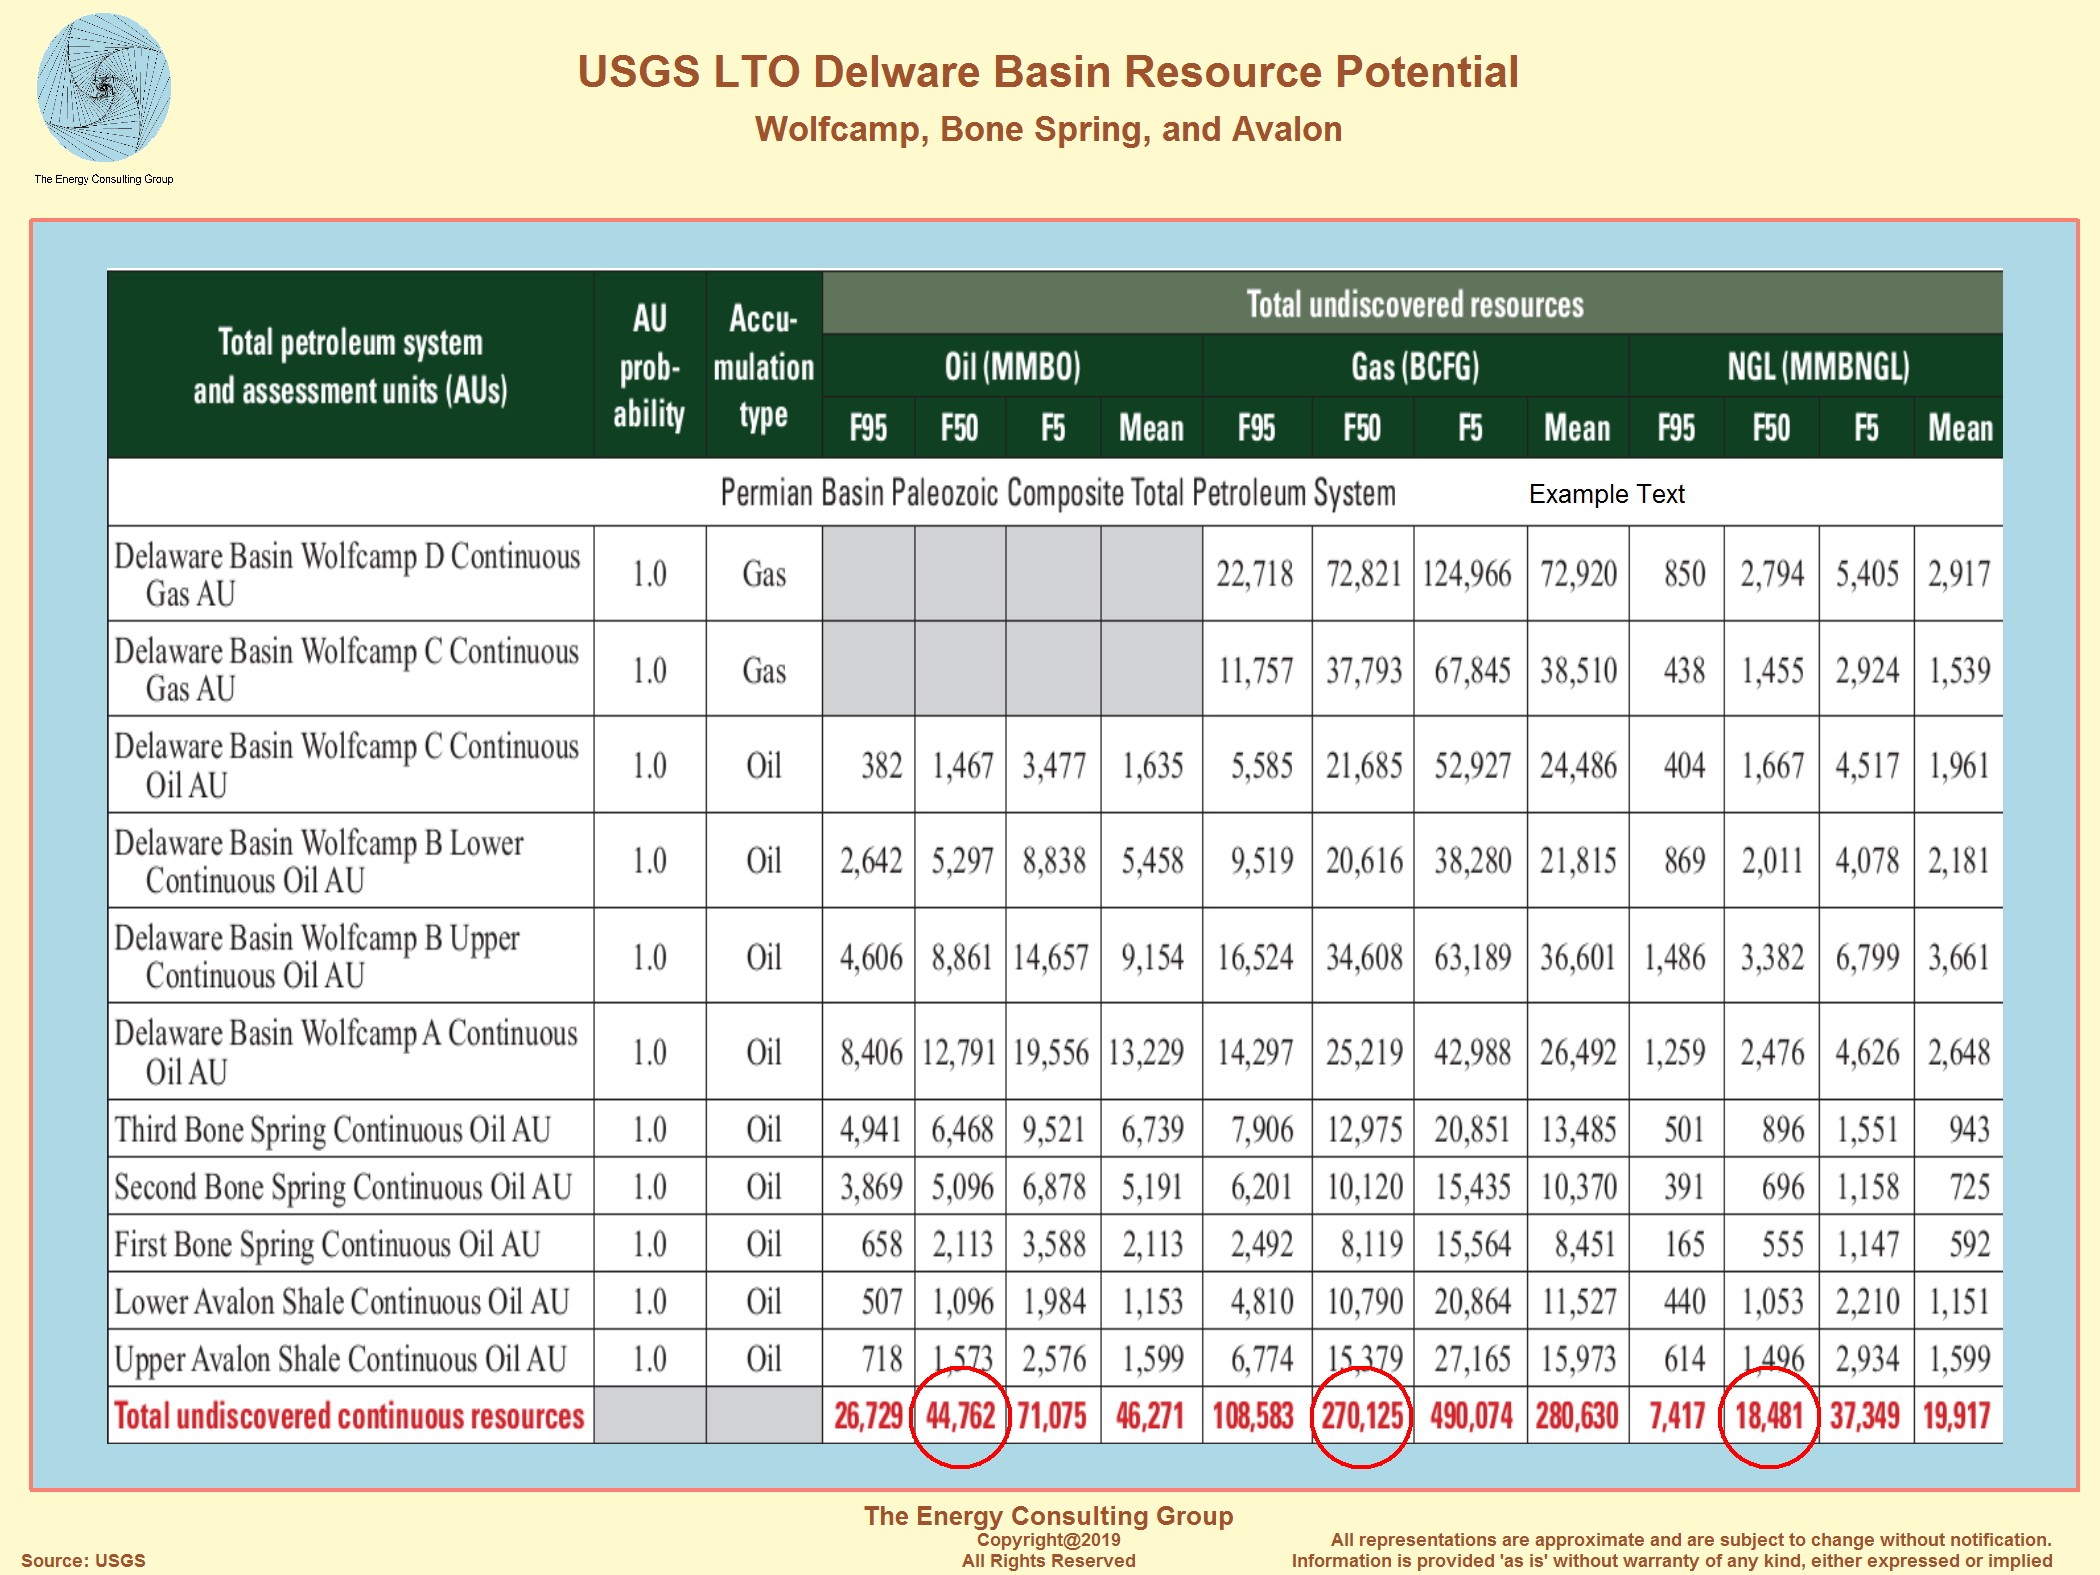 For Larger, Higher Resolution View, Click Image |
USGS Light, Tight Oil (Nonconventional) Midland Basin Resource
Potential For Larger, Higher Resolution View, Click Image |
|
The Three Primary Regions of the Permian Basin For Larger, Higher Resolution View, Click Image |
Where Would the Permian Basin Rank Globally in
Natural Gas Resources if It Were Considered a Separate Country?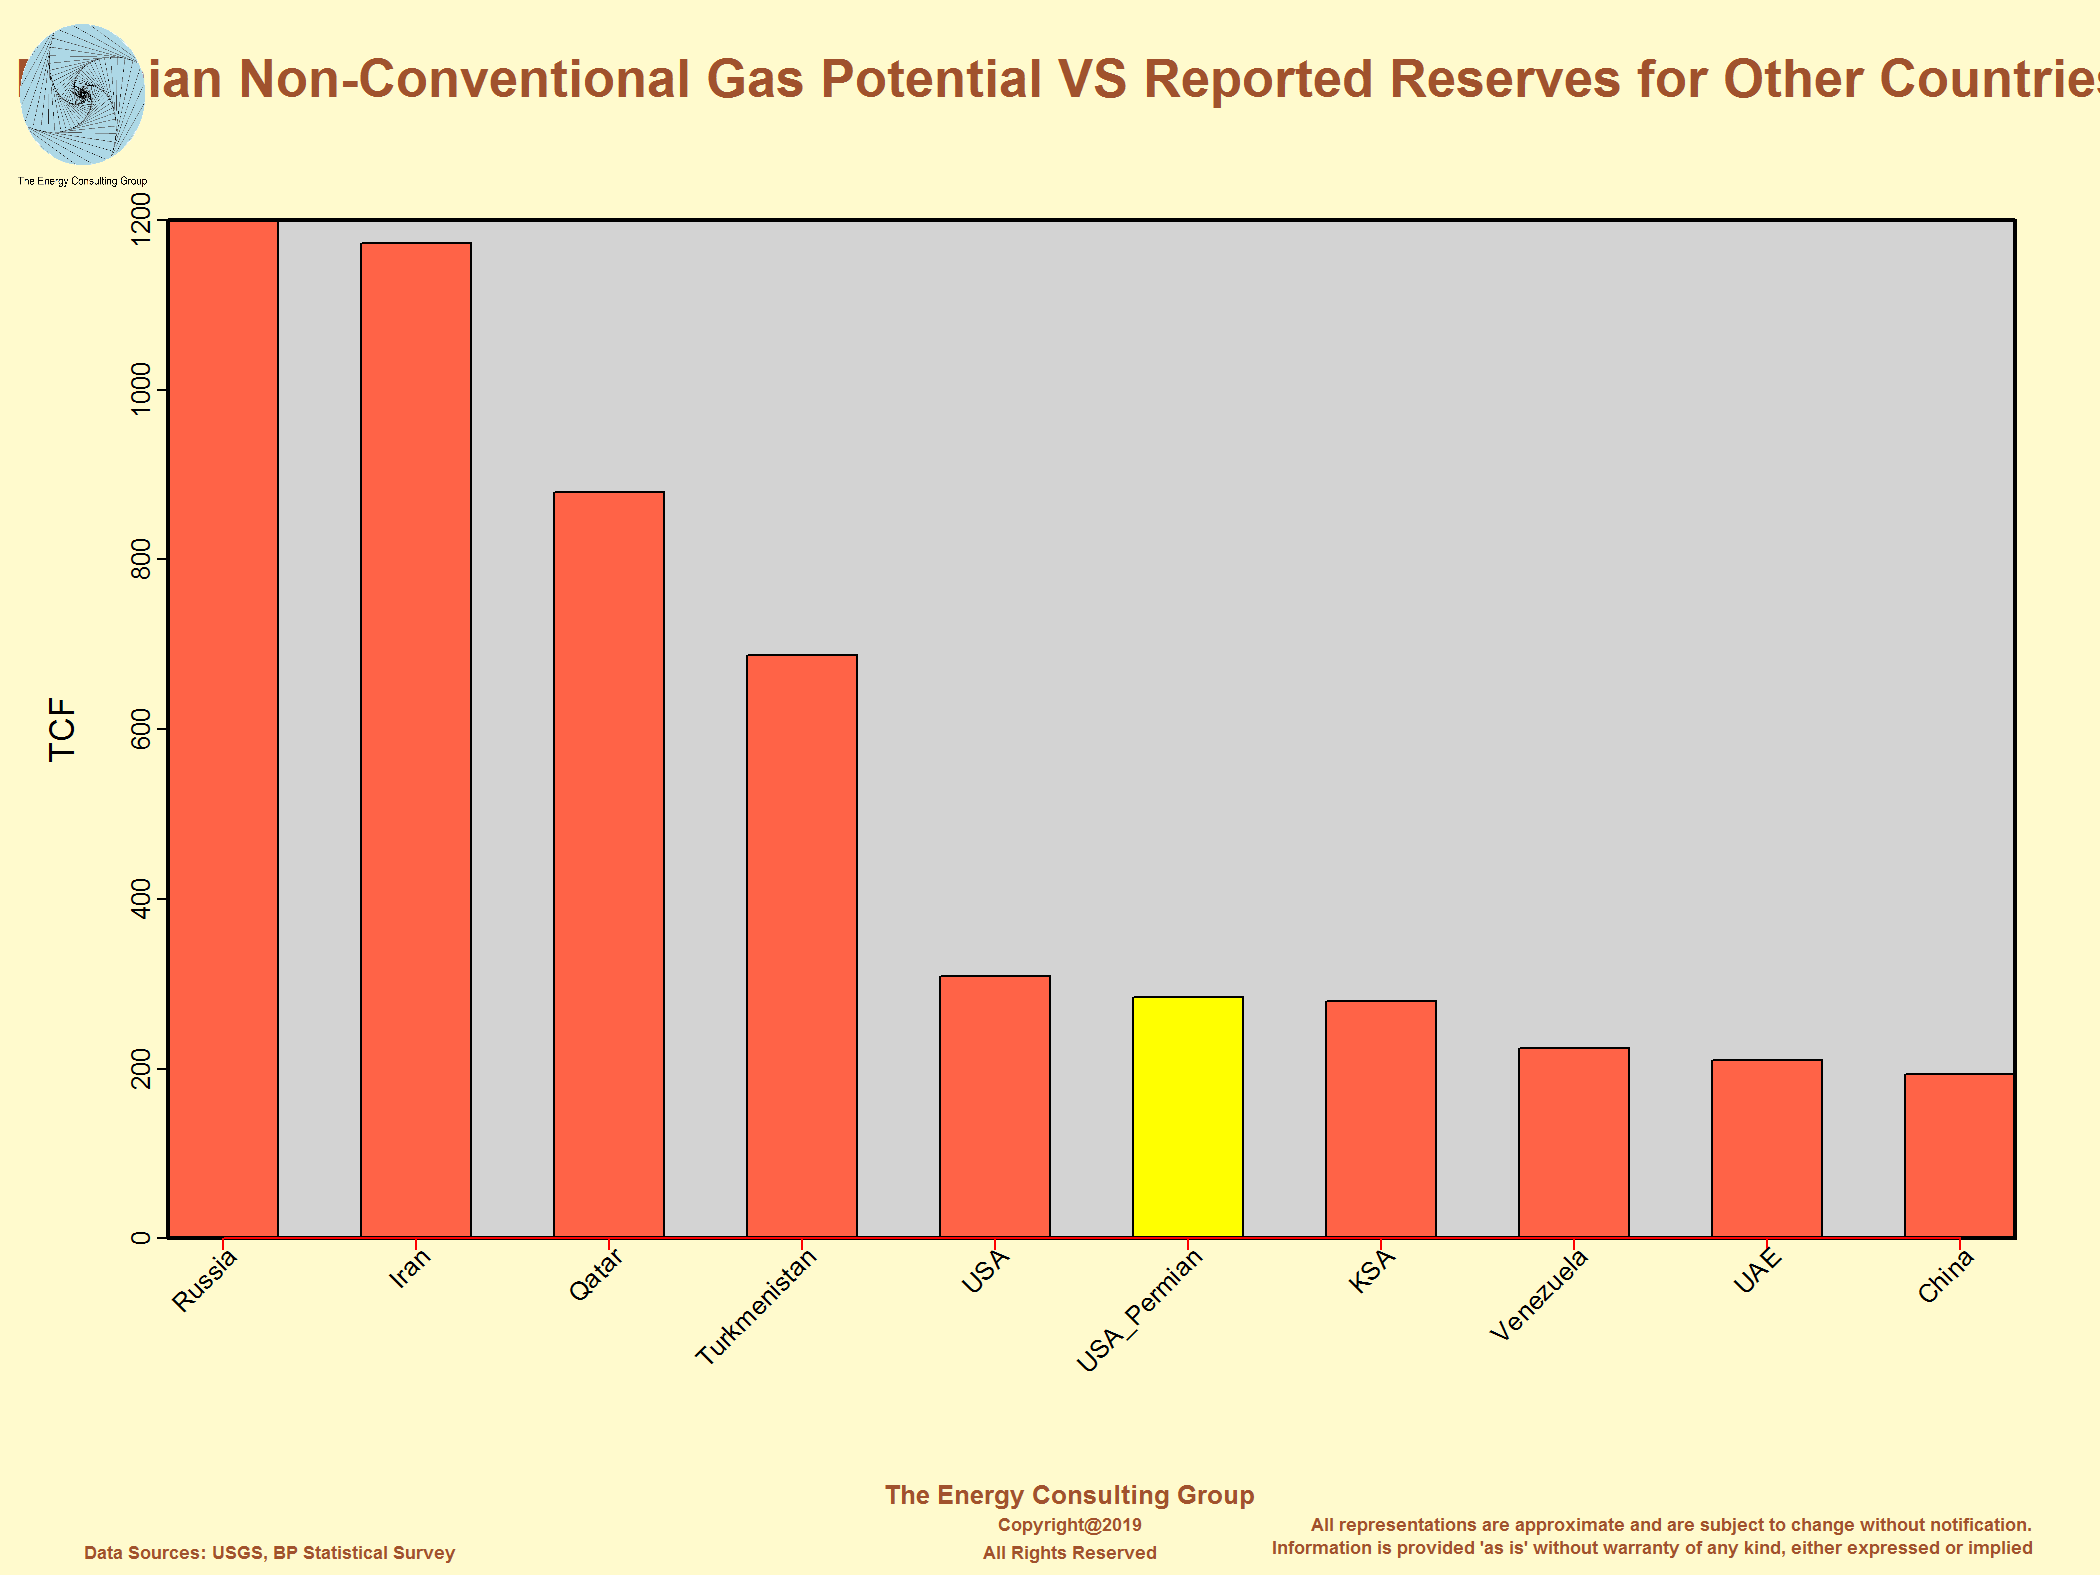 For Larger, Higher Resolution View, Click Image |
|
USA Natural Gas Demand, Production (Supply), Imports, Exports, and Price As reported by the EIA For Larger, Higher Resolution View, Click Image 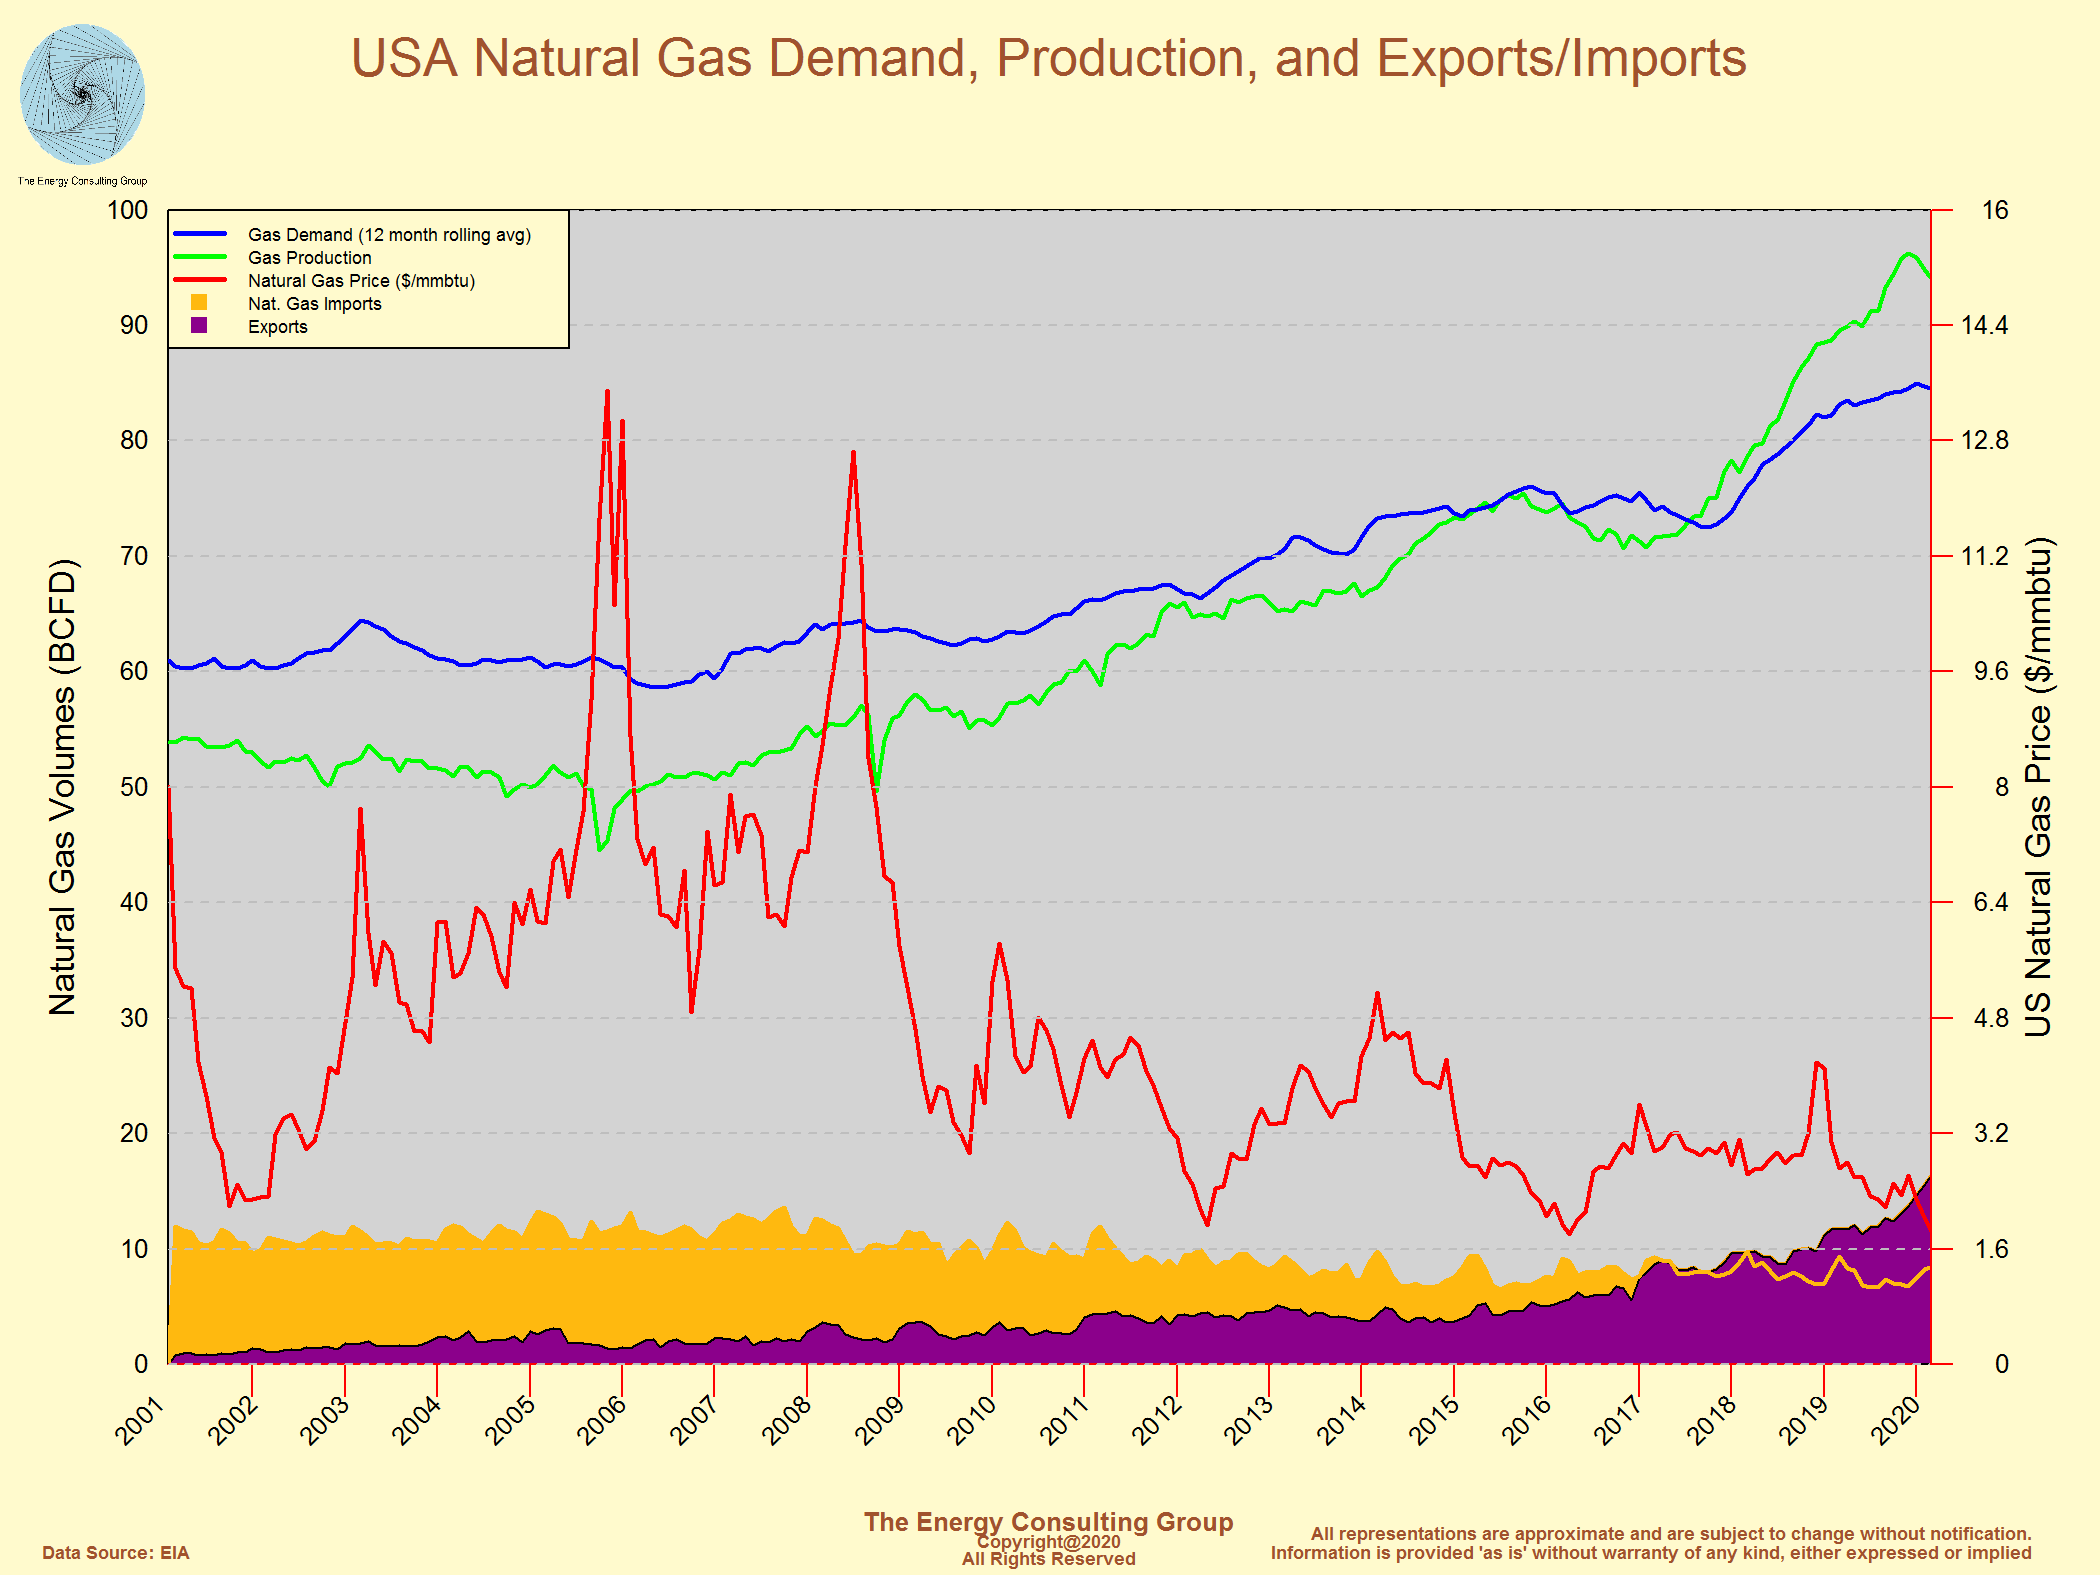 |
The chart to the left provides a single page reference for USA natural
gas market fundamentals. The obvious trends since the
advent of large scale shale gas drilling in the middle
of the previous decade are: 1) Lower natural gas prices 2) Increasing demand in response to the lower prices 3) Falling imports and growing exports. Go to this page for a discussion of the emergent Utica dry gas play, which might be the next "super" shale play. Operators have reported 24 hr IP's in excess of 70 MMCFD with flowing casing pressures (FCP) of 8000-10000 psi. Longer term, development of the deep Utica, super shale is starting to rev up. We currently estimate the resource potential of this play to be in excess of 400 TCF, a significant portion of which may be economic at less than $2/mmbtu. As a reminder, three early wells in the deep, dry Utica in sw PA tested at 59 MMCFD, 73 MMCFD, and 63 MMCFD. All three had flowing pressures of 8000 psi or higher. See the following links for more details: Scotts Run (73 MMCFD) well; Gaut4IH (63 MMCFD) well; and Claysville Sportsman's Club No. 1(59 MMCFD) well. |
US Natural Gas
Demand Summary
In this
section we provide a brief overview of US natural gas demand situation. If
looking for updates on any of the provided charts or our current assessment of
natural gas demand, both for the USA and internationally, please contact us.
For Larger, Higher Resolution View, Click Image
US Natural Gas Demand and Export Levels: 2001-2019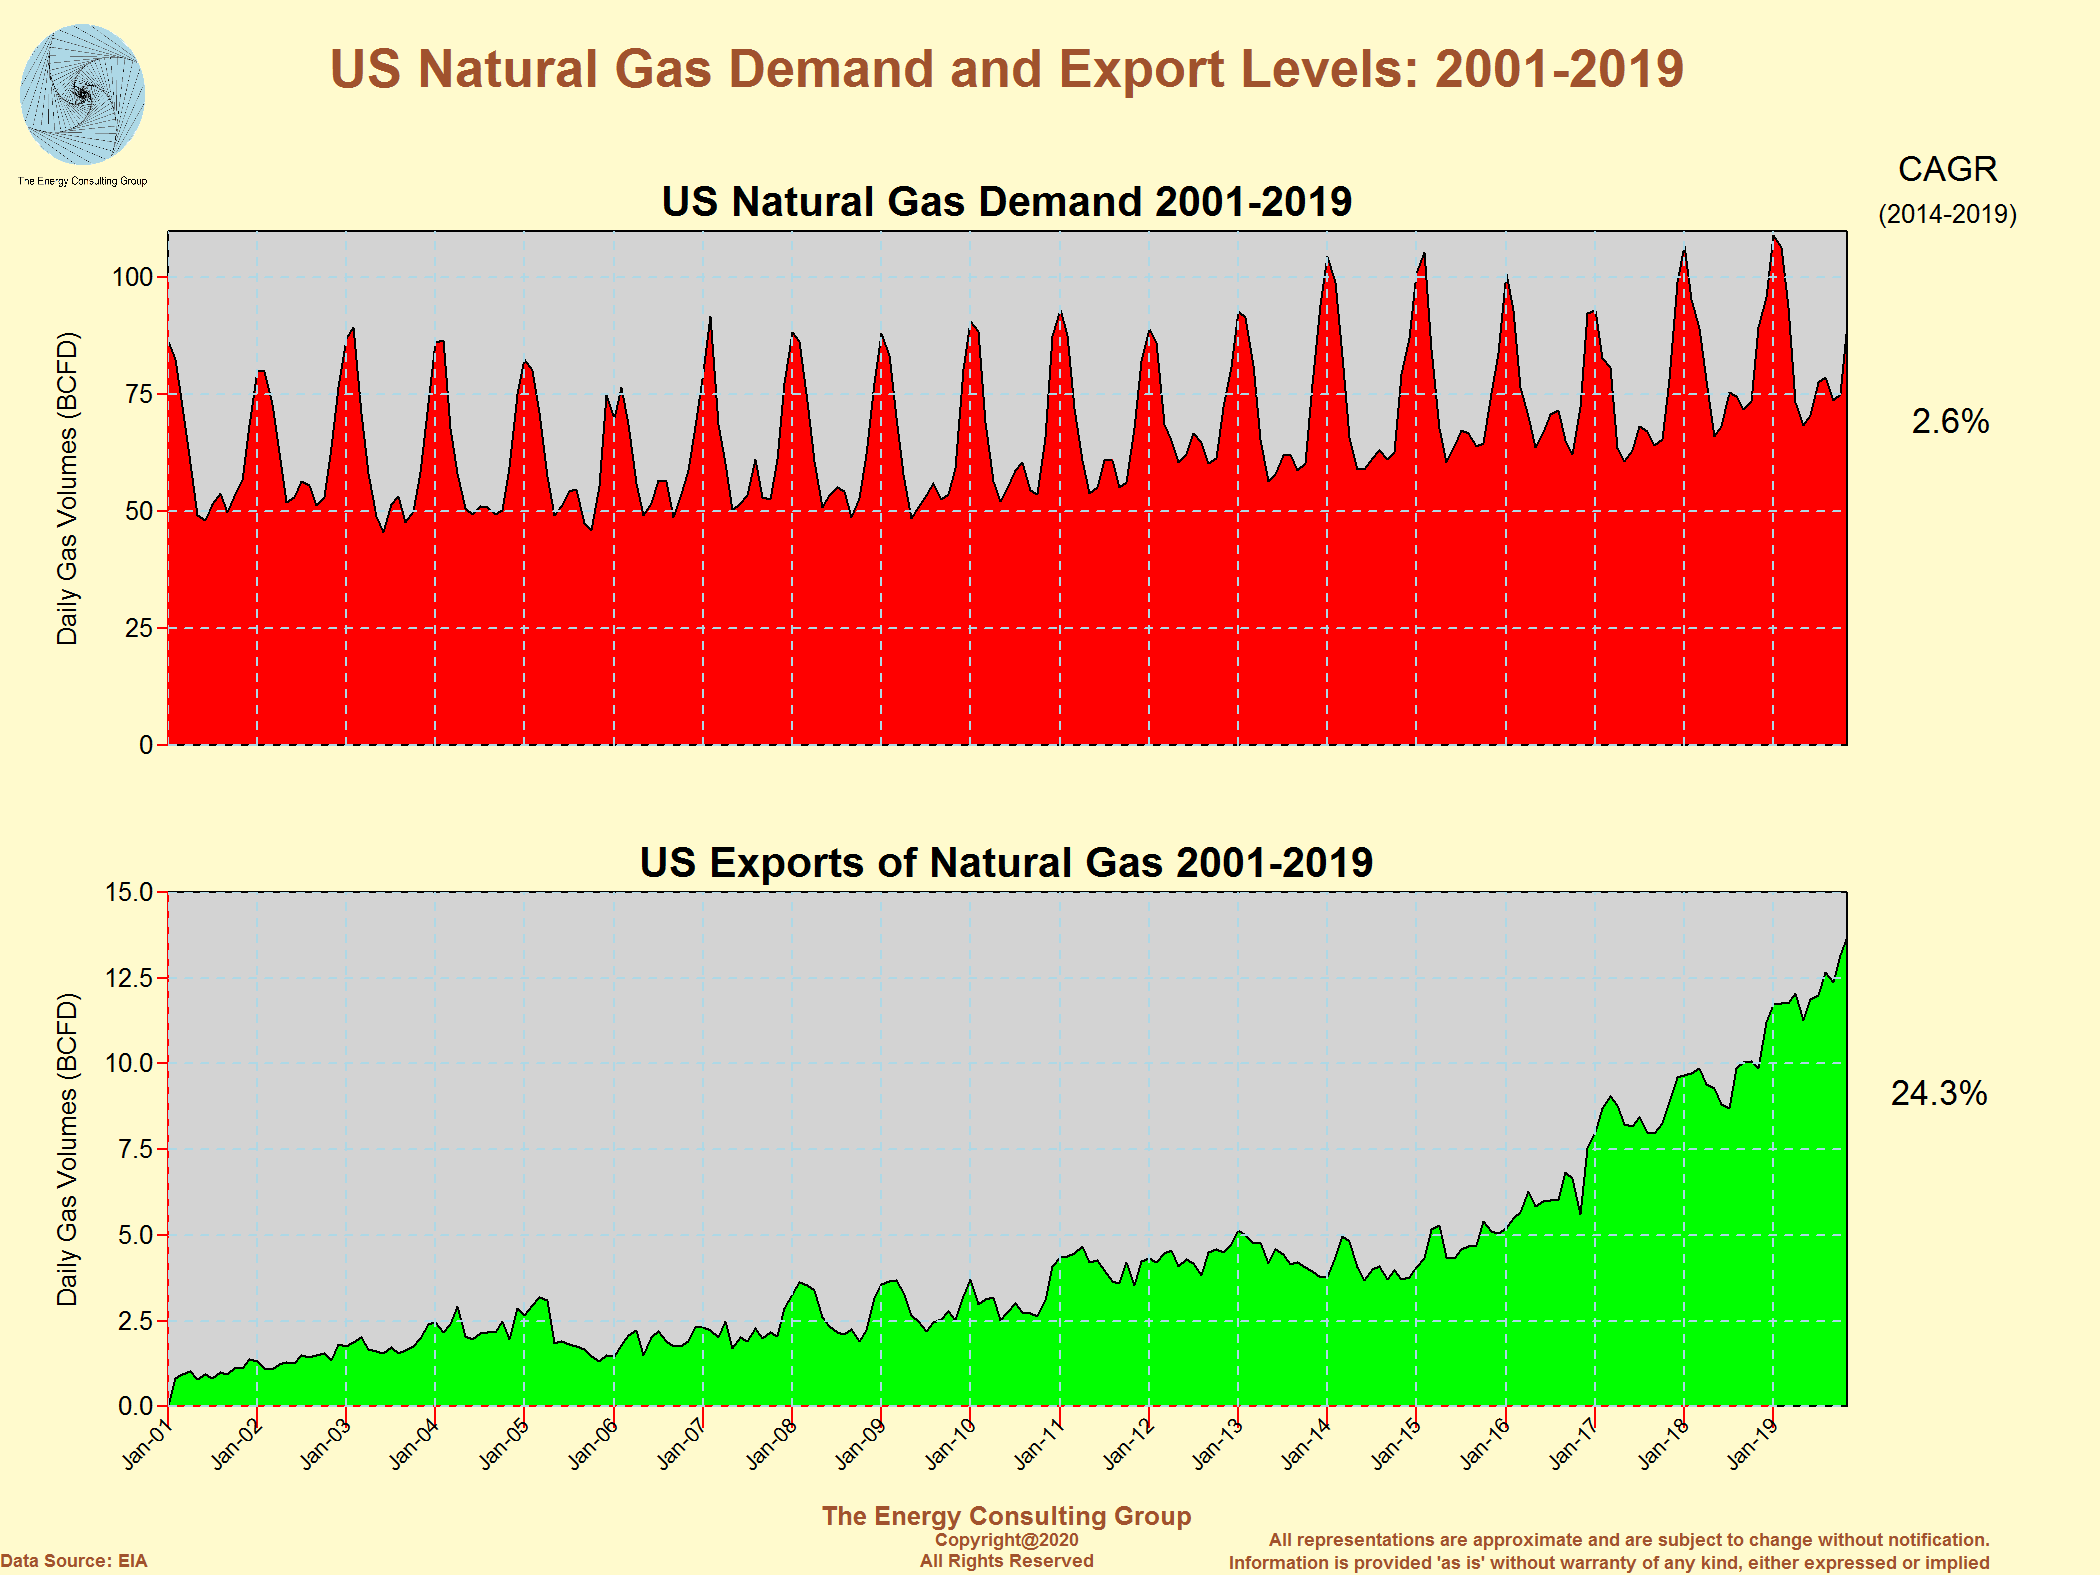 For Larger, Higher Resolution View, Click Image |
|
US Natural Gas Demand by Major User Segment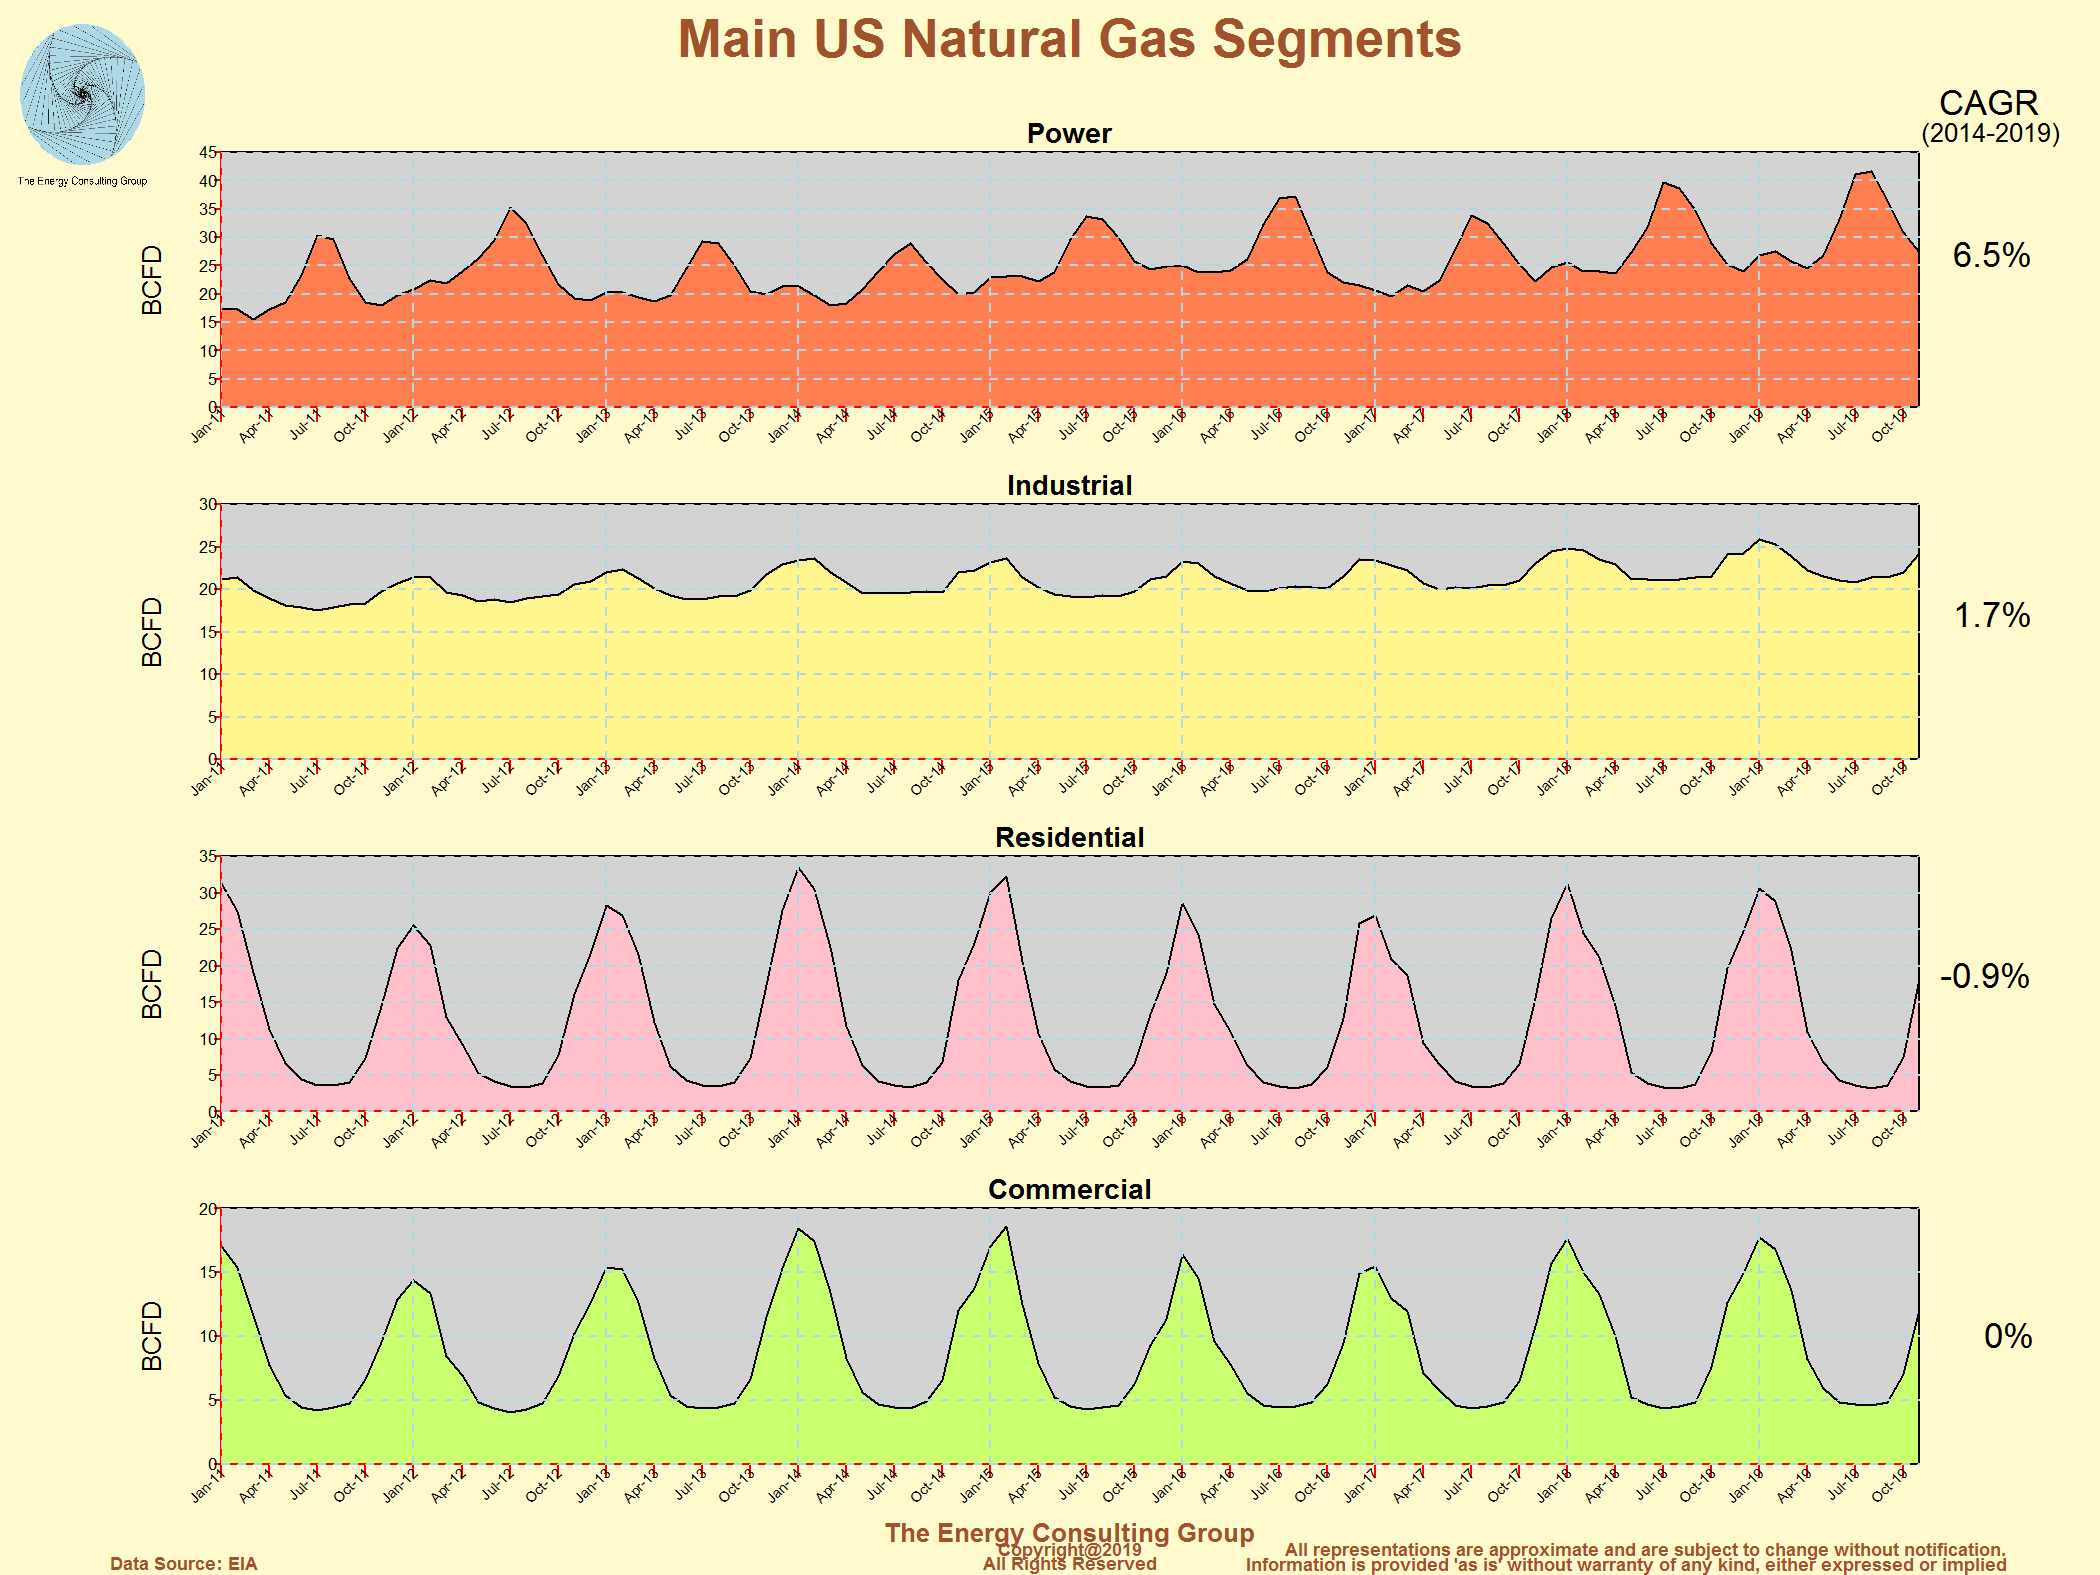 For Higher Resolution, Click Image |
Year-on-Year Change in Daily Natural Gas Demand For Larger, Higher Resolution View, Click Image |
US Natural Gas LNG and Pipeline Export Summary
The daily estimates of pipeline flows to the right was sourced from the
useful
US Natural Gas Trade (Exports, Imports, Net Trade Balance)

For Larger, Higher Resolution View, Click Image
US Natural Gas Exports to Mexico: A 20 Year
Look
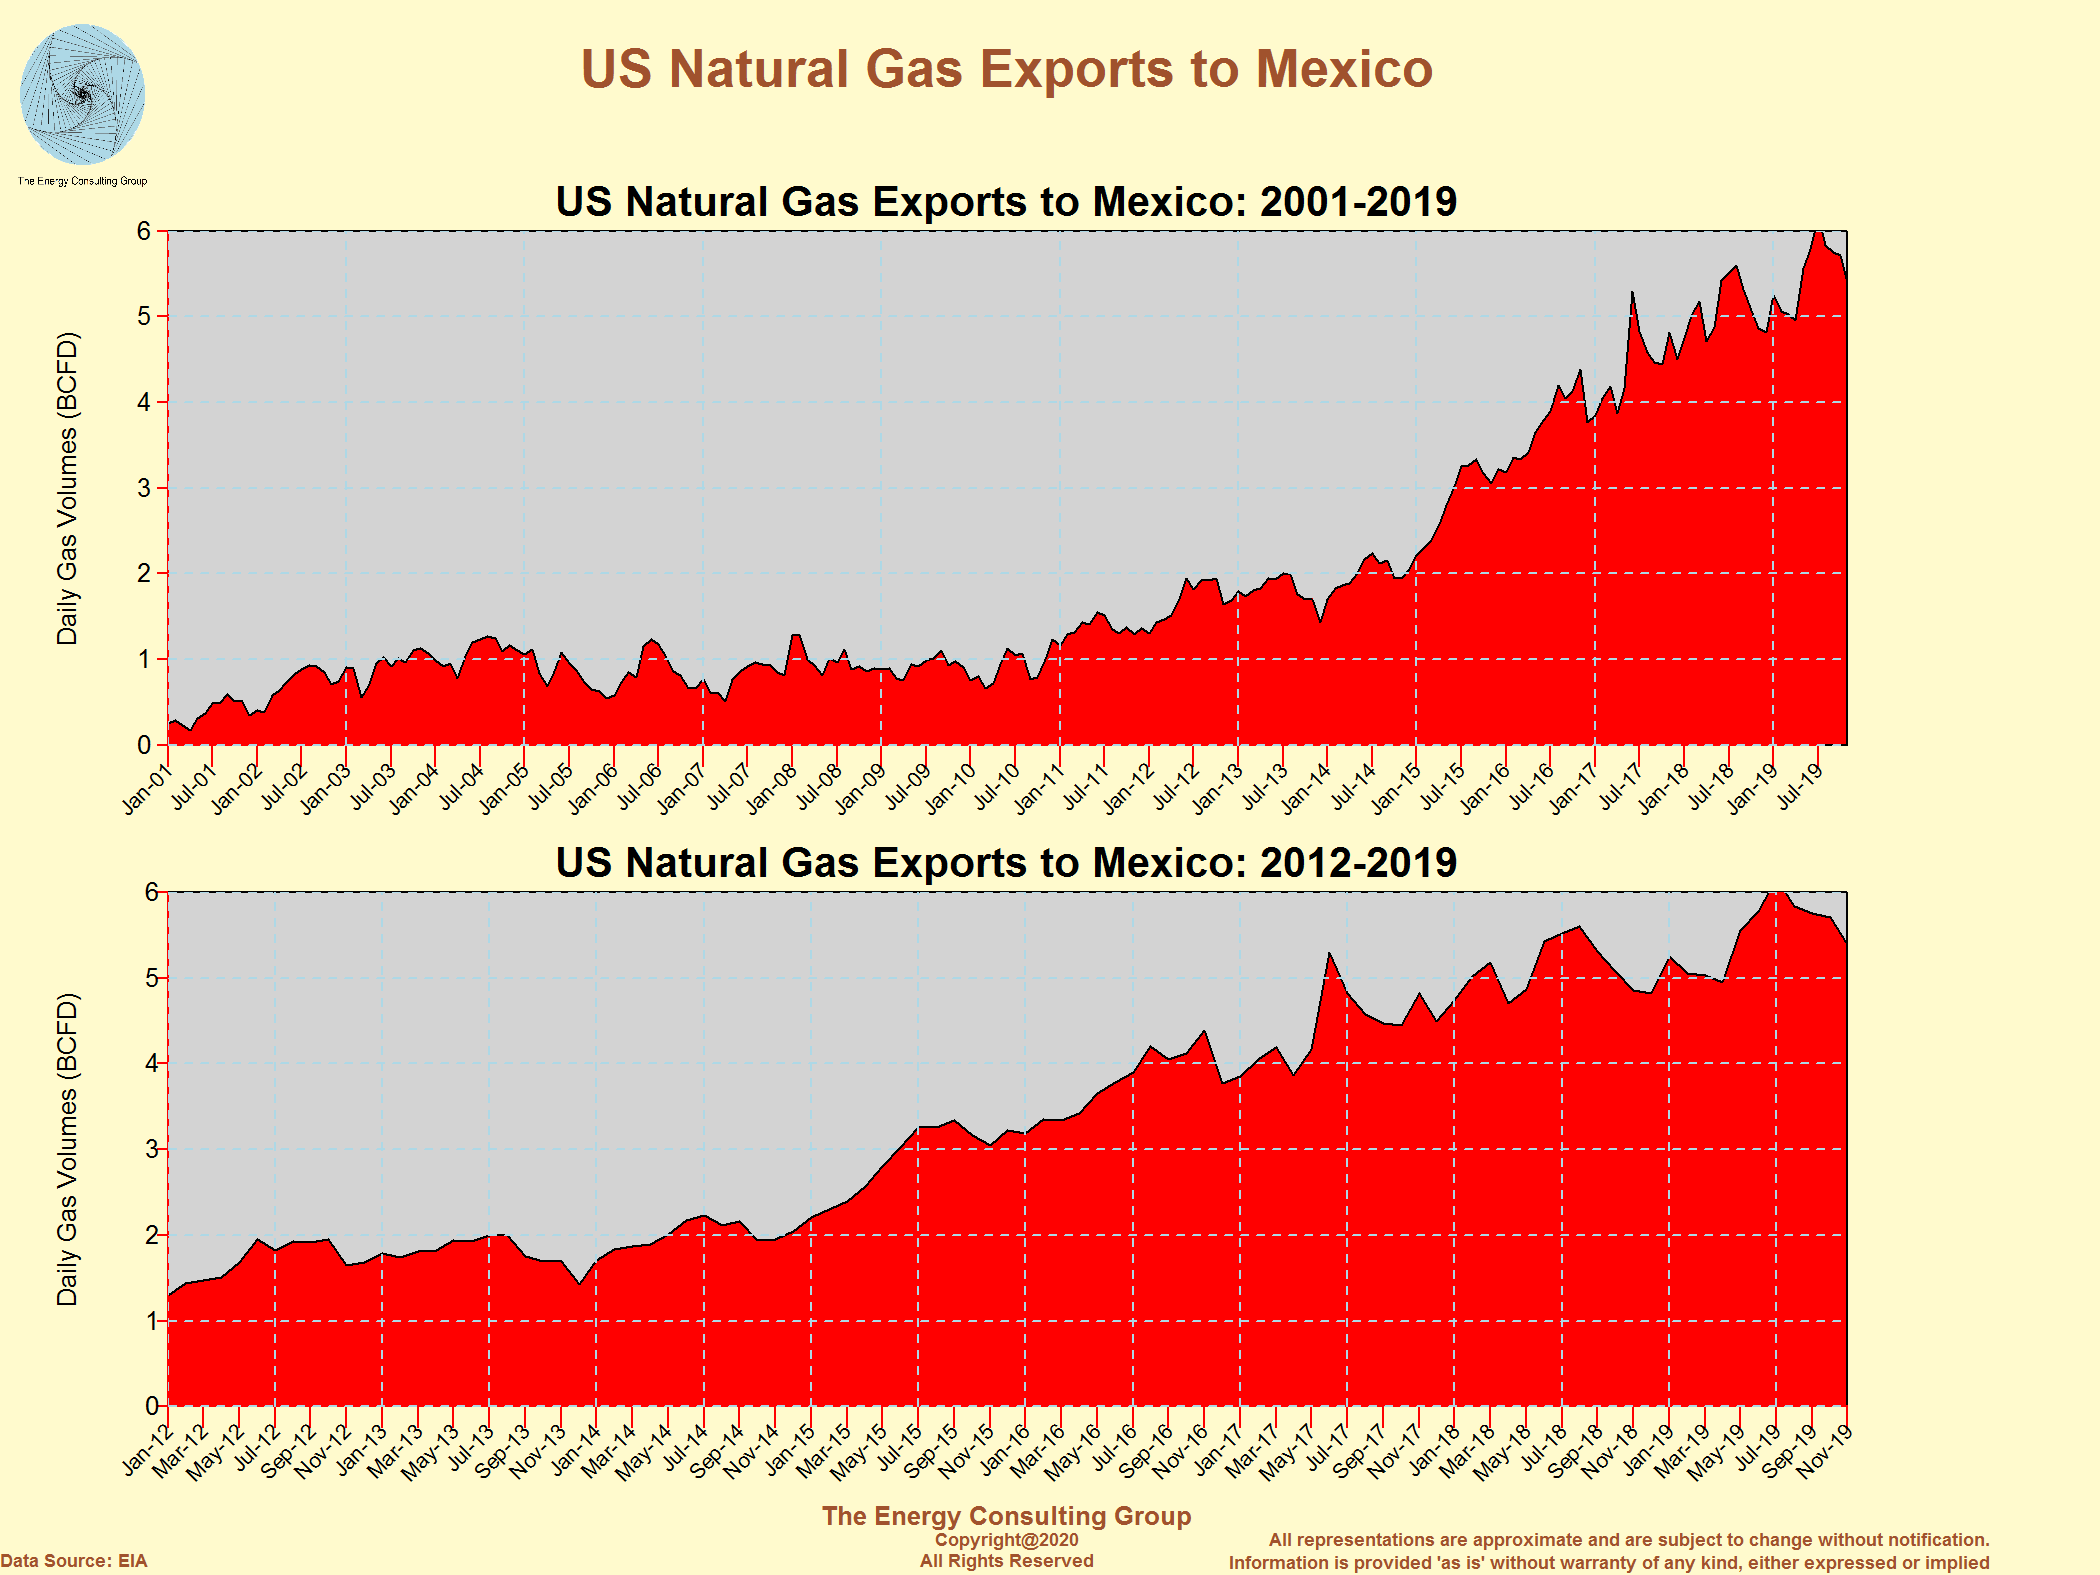
For Larger, Higher Resolution View, Click Image
USA LNG Export Report Card
(Thru December 2018)
![]()
For Larger, Higher Resolution View, Click Image
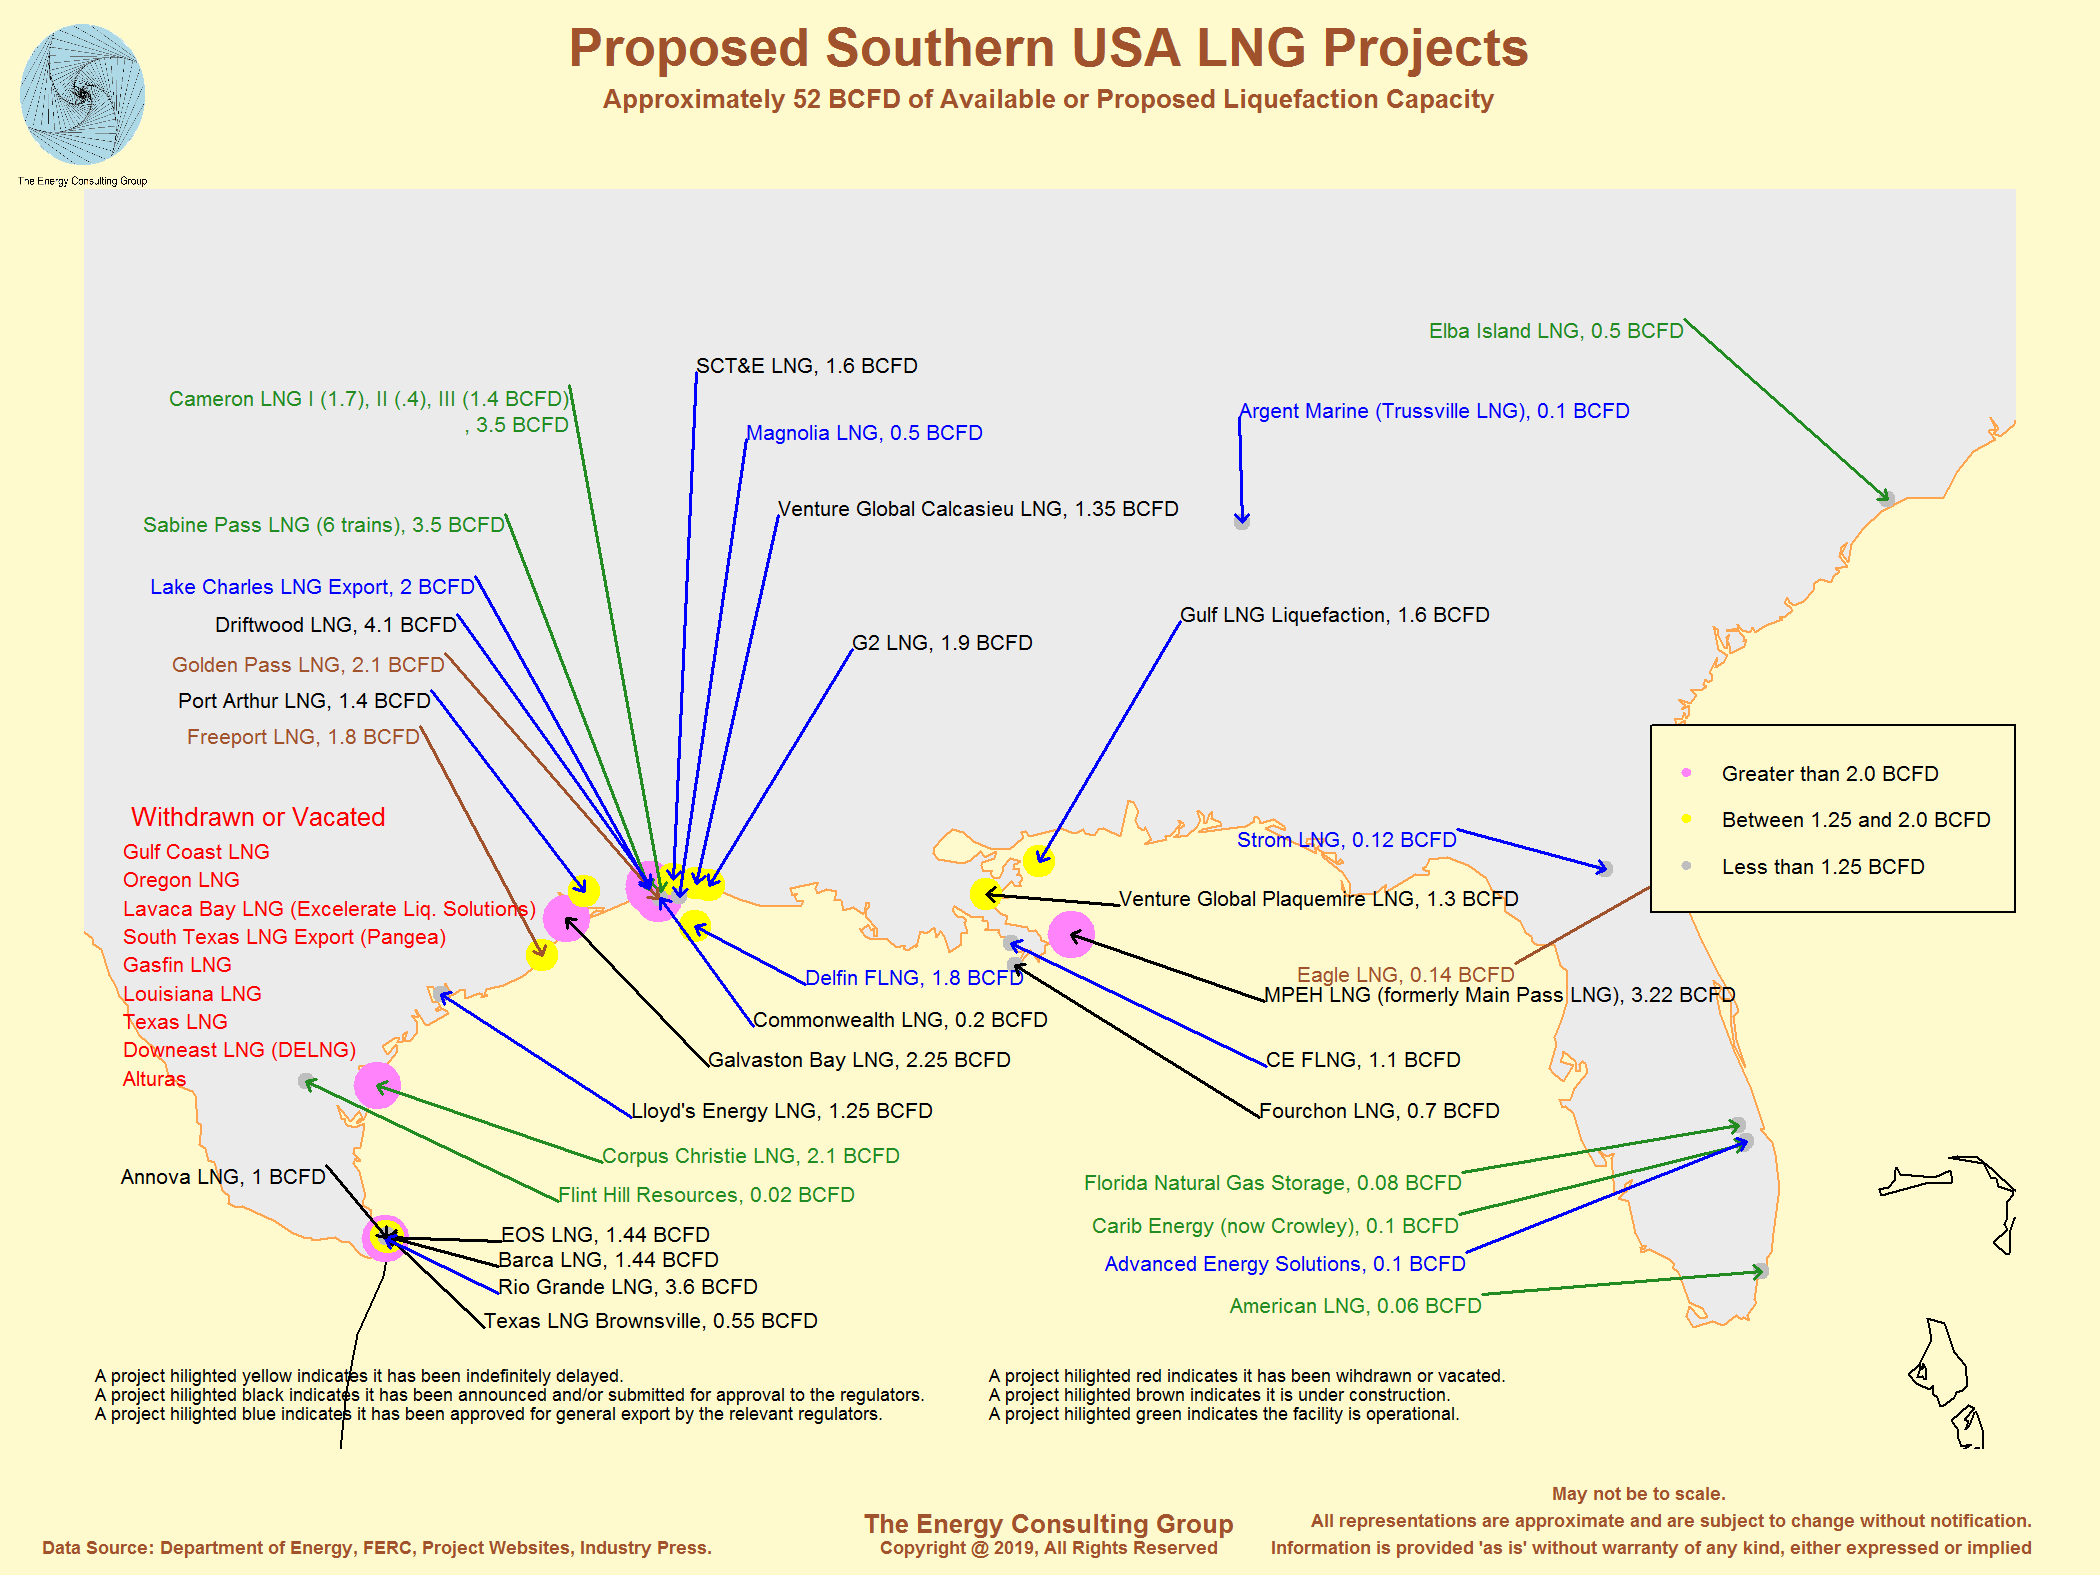
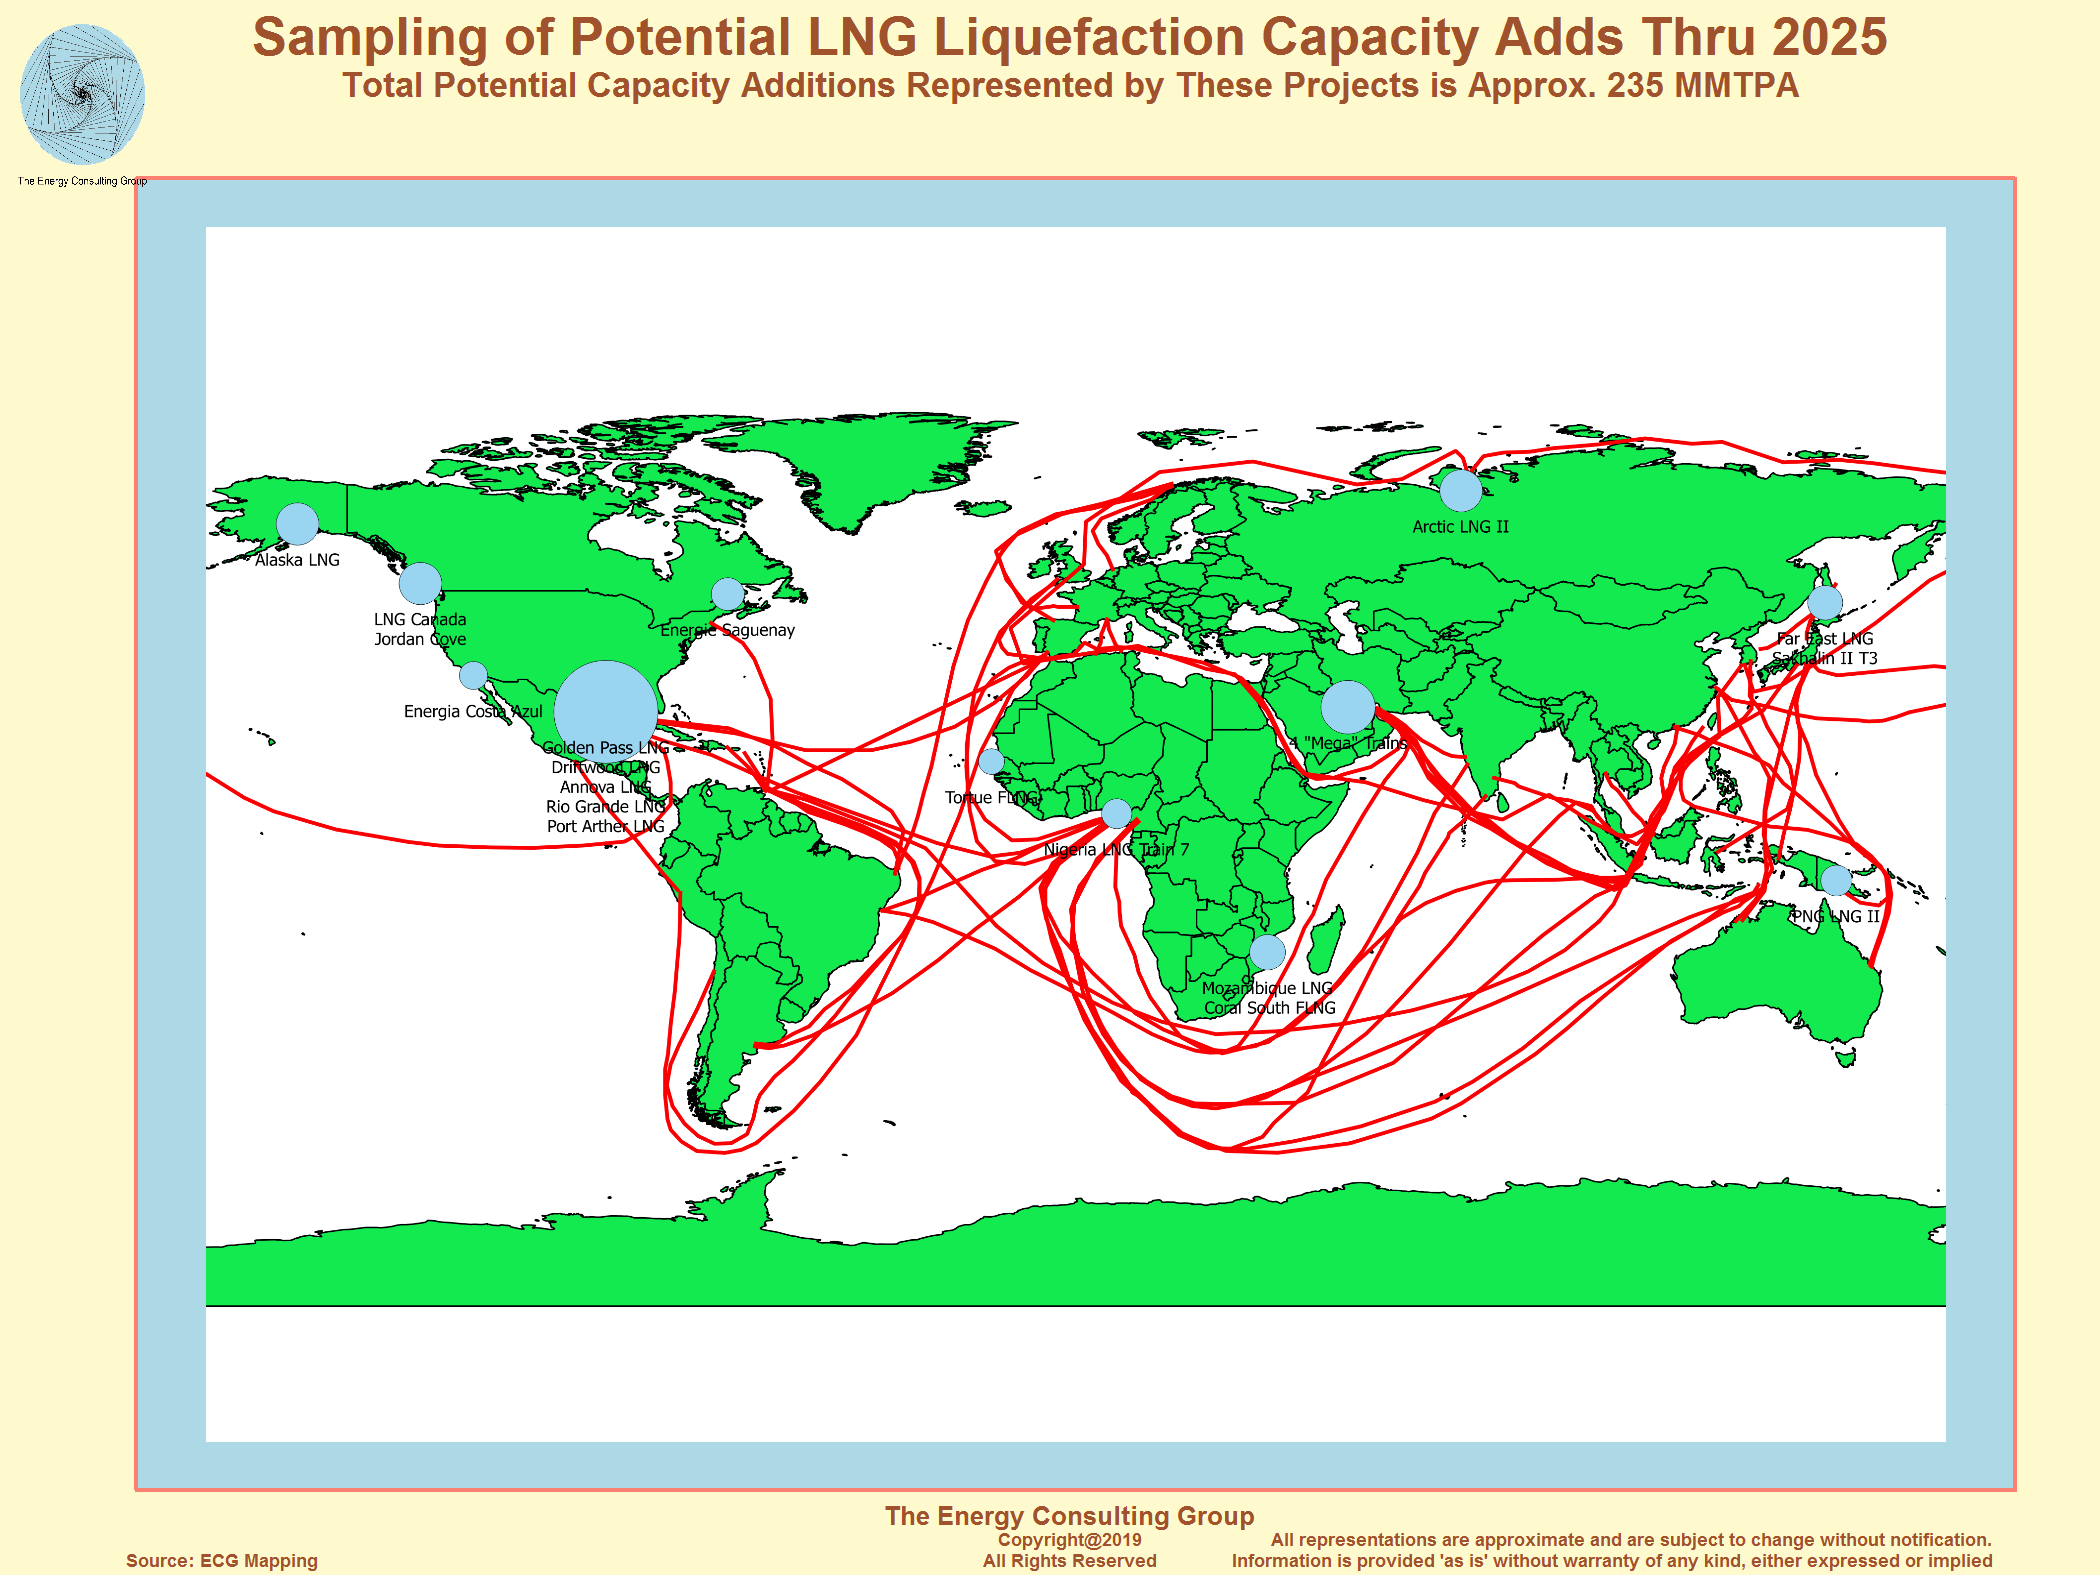
Proposed Southern USA LNG Projects
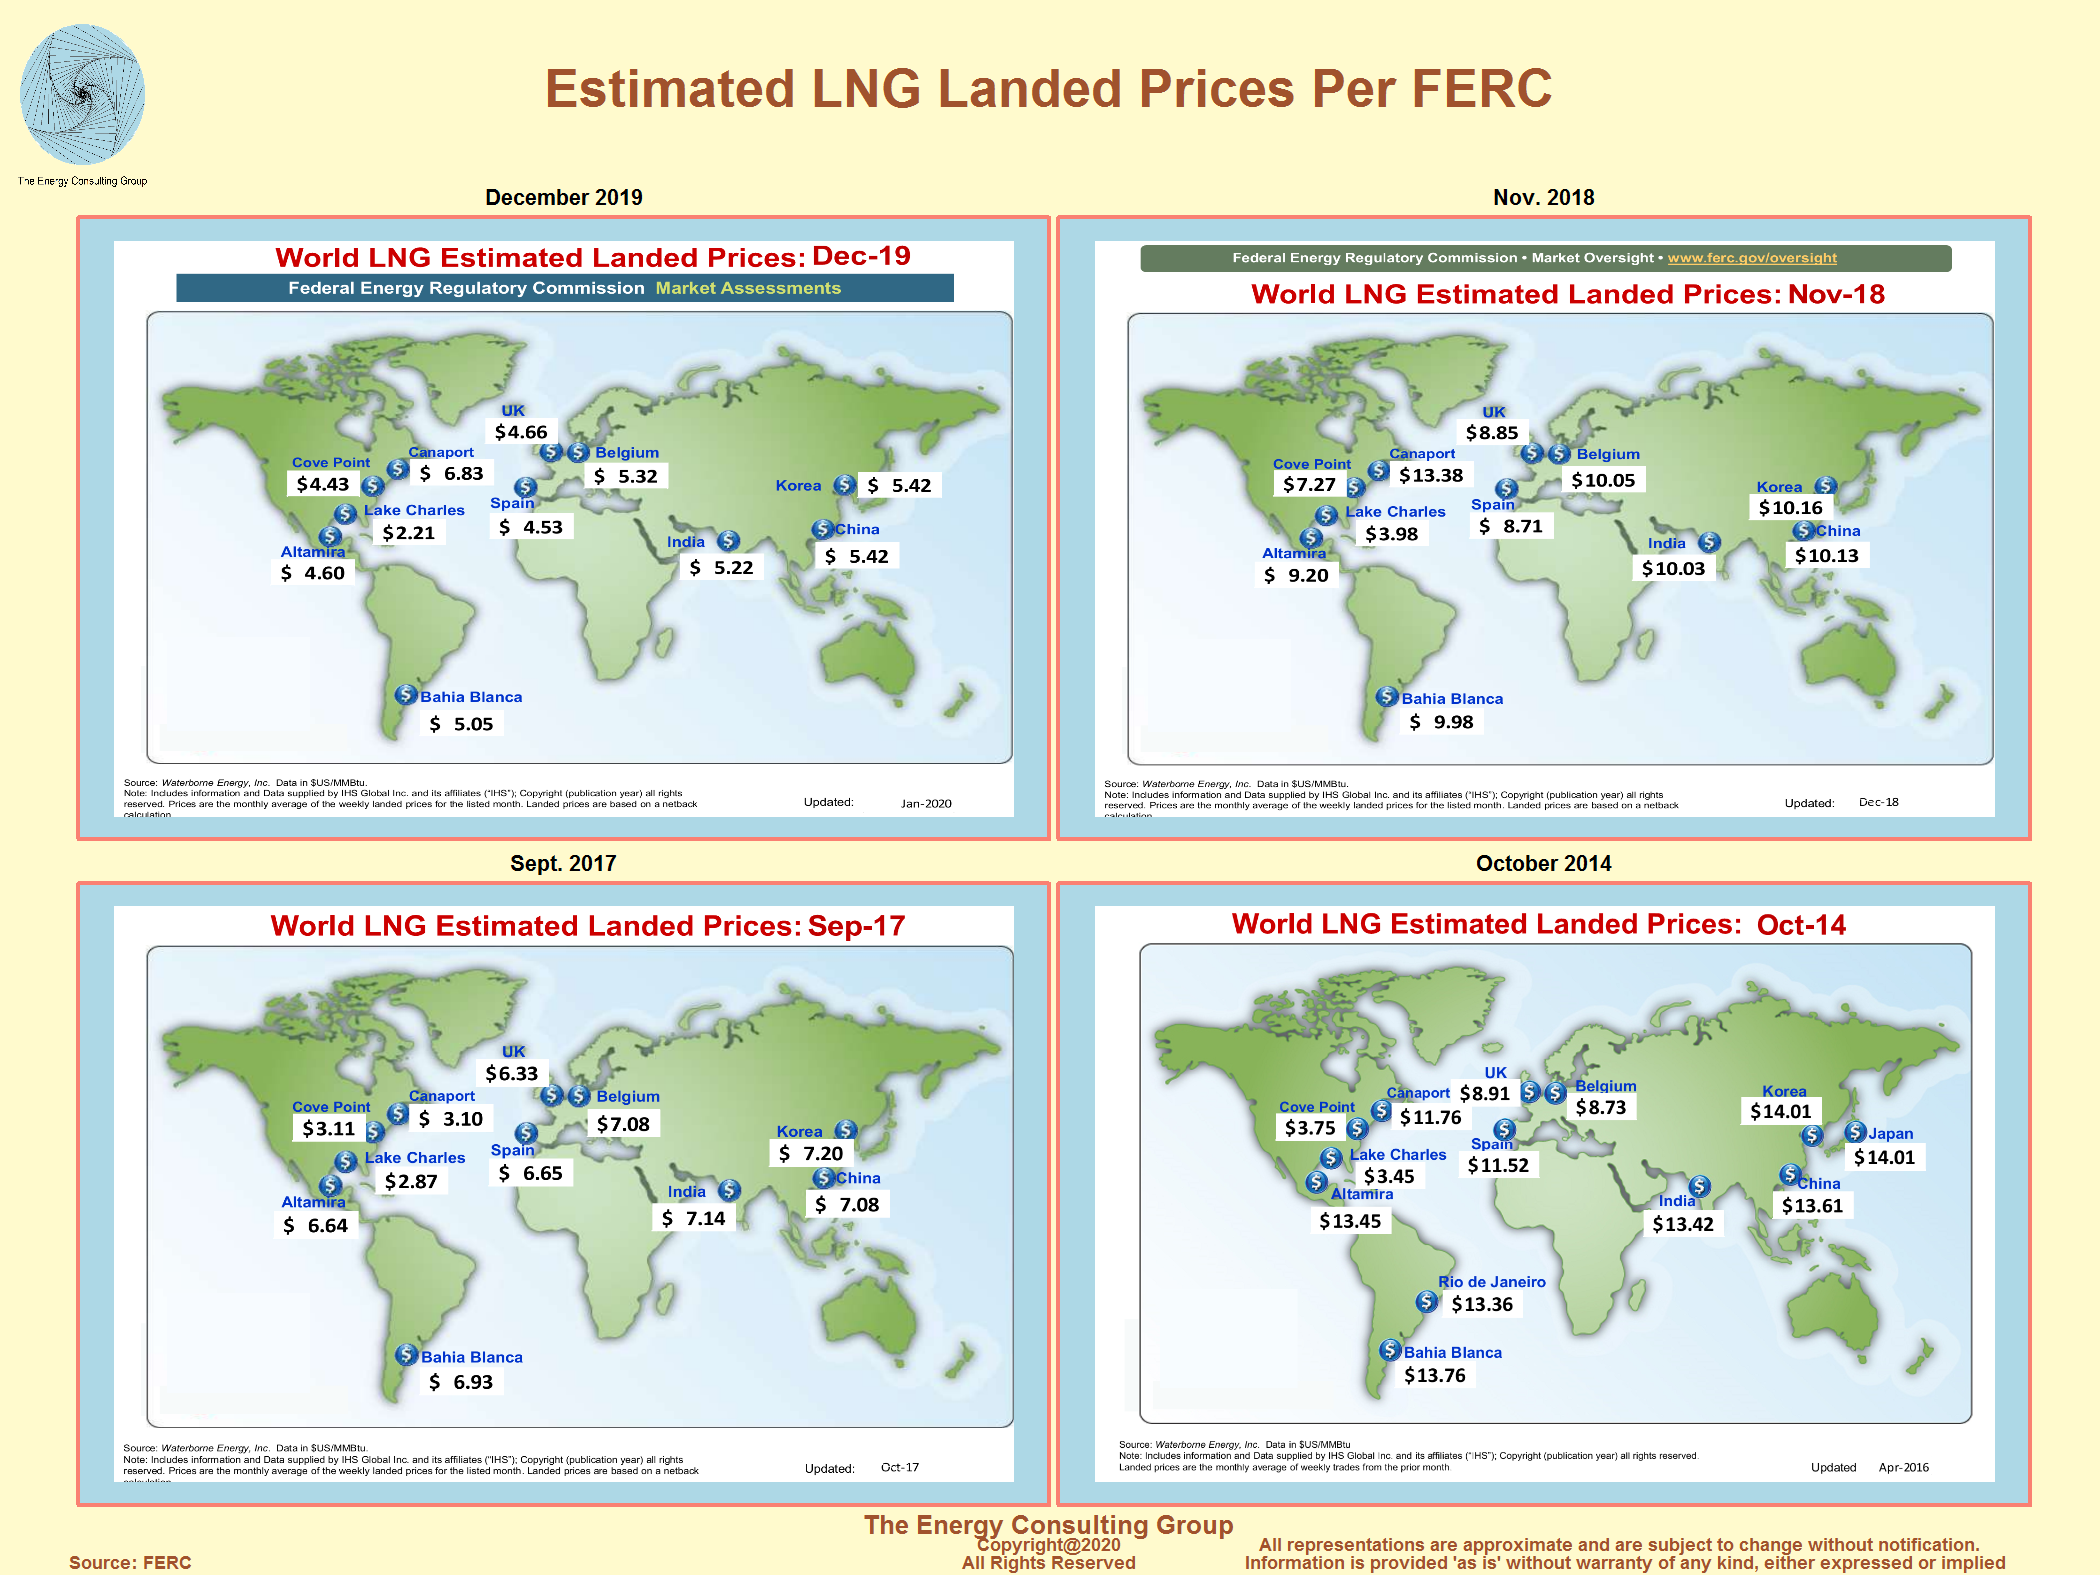
Recent and Historical Landed LNG Prices Reported At Selected Locales Around the World
For Larger, Higher Resolution View, Click Image
Sampling of Potential LNG Liquefaction Capacity Adds Thru 2025
Natural Gas and the US Power Sector
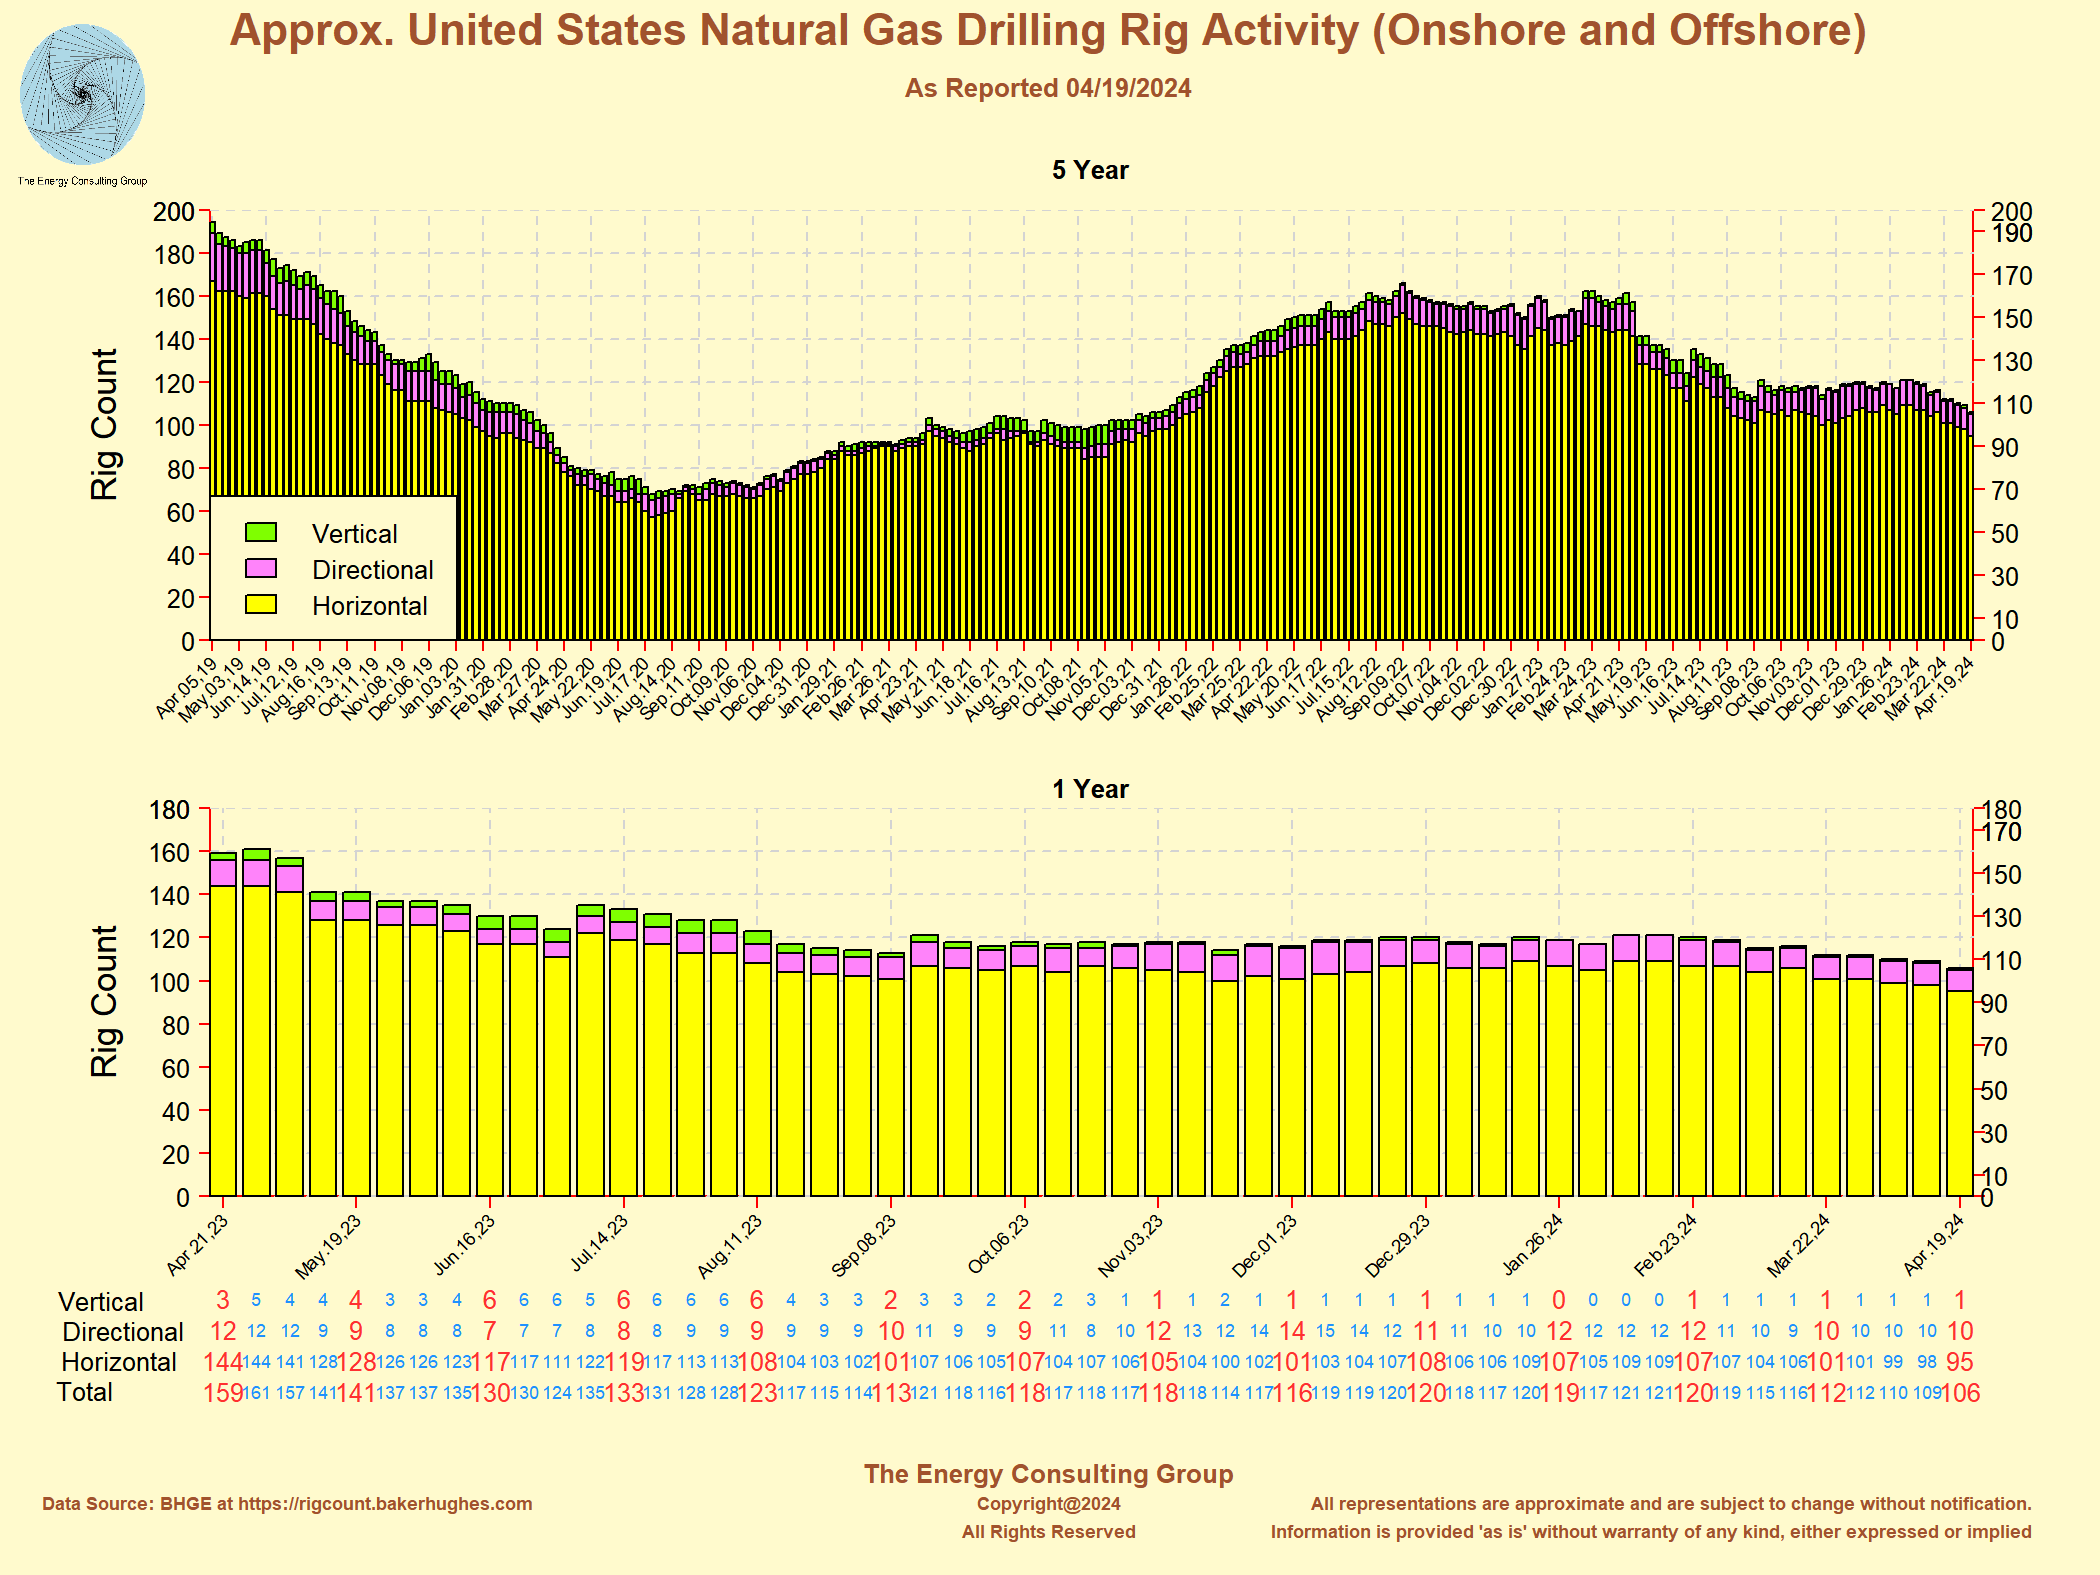
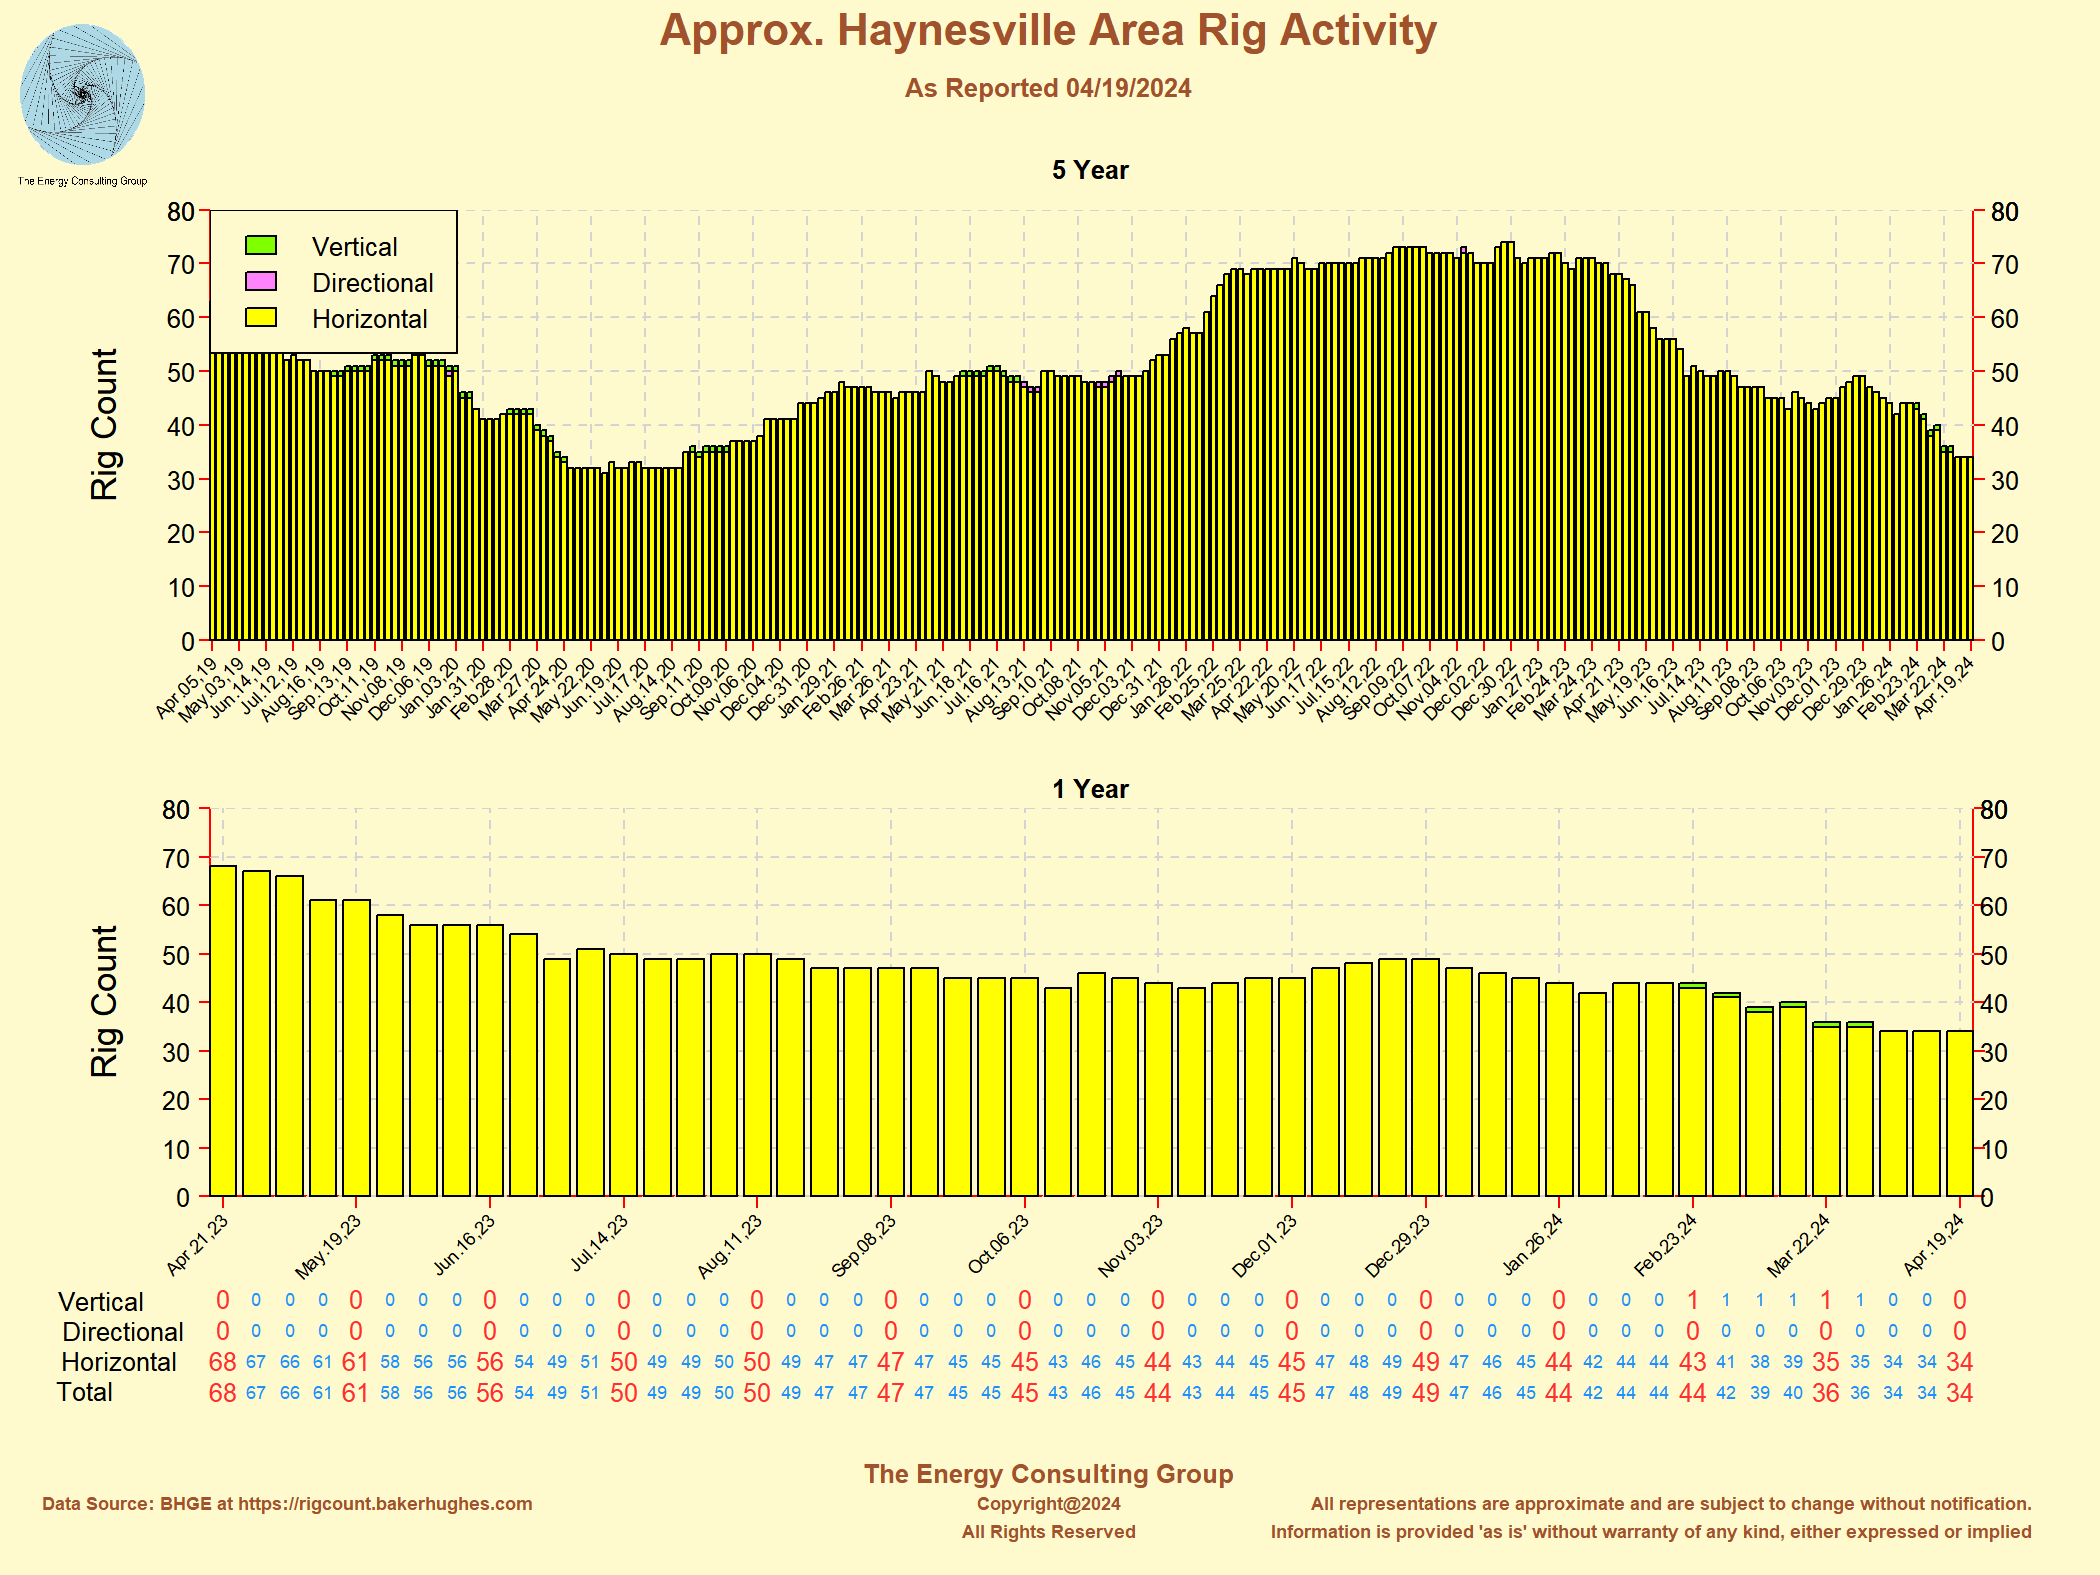
ECG Assessment of Horizontal Drilling Activity
in Several Large Shale Gas Plays in the USA (February 2020)

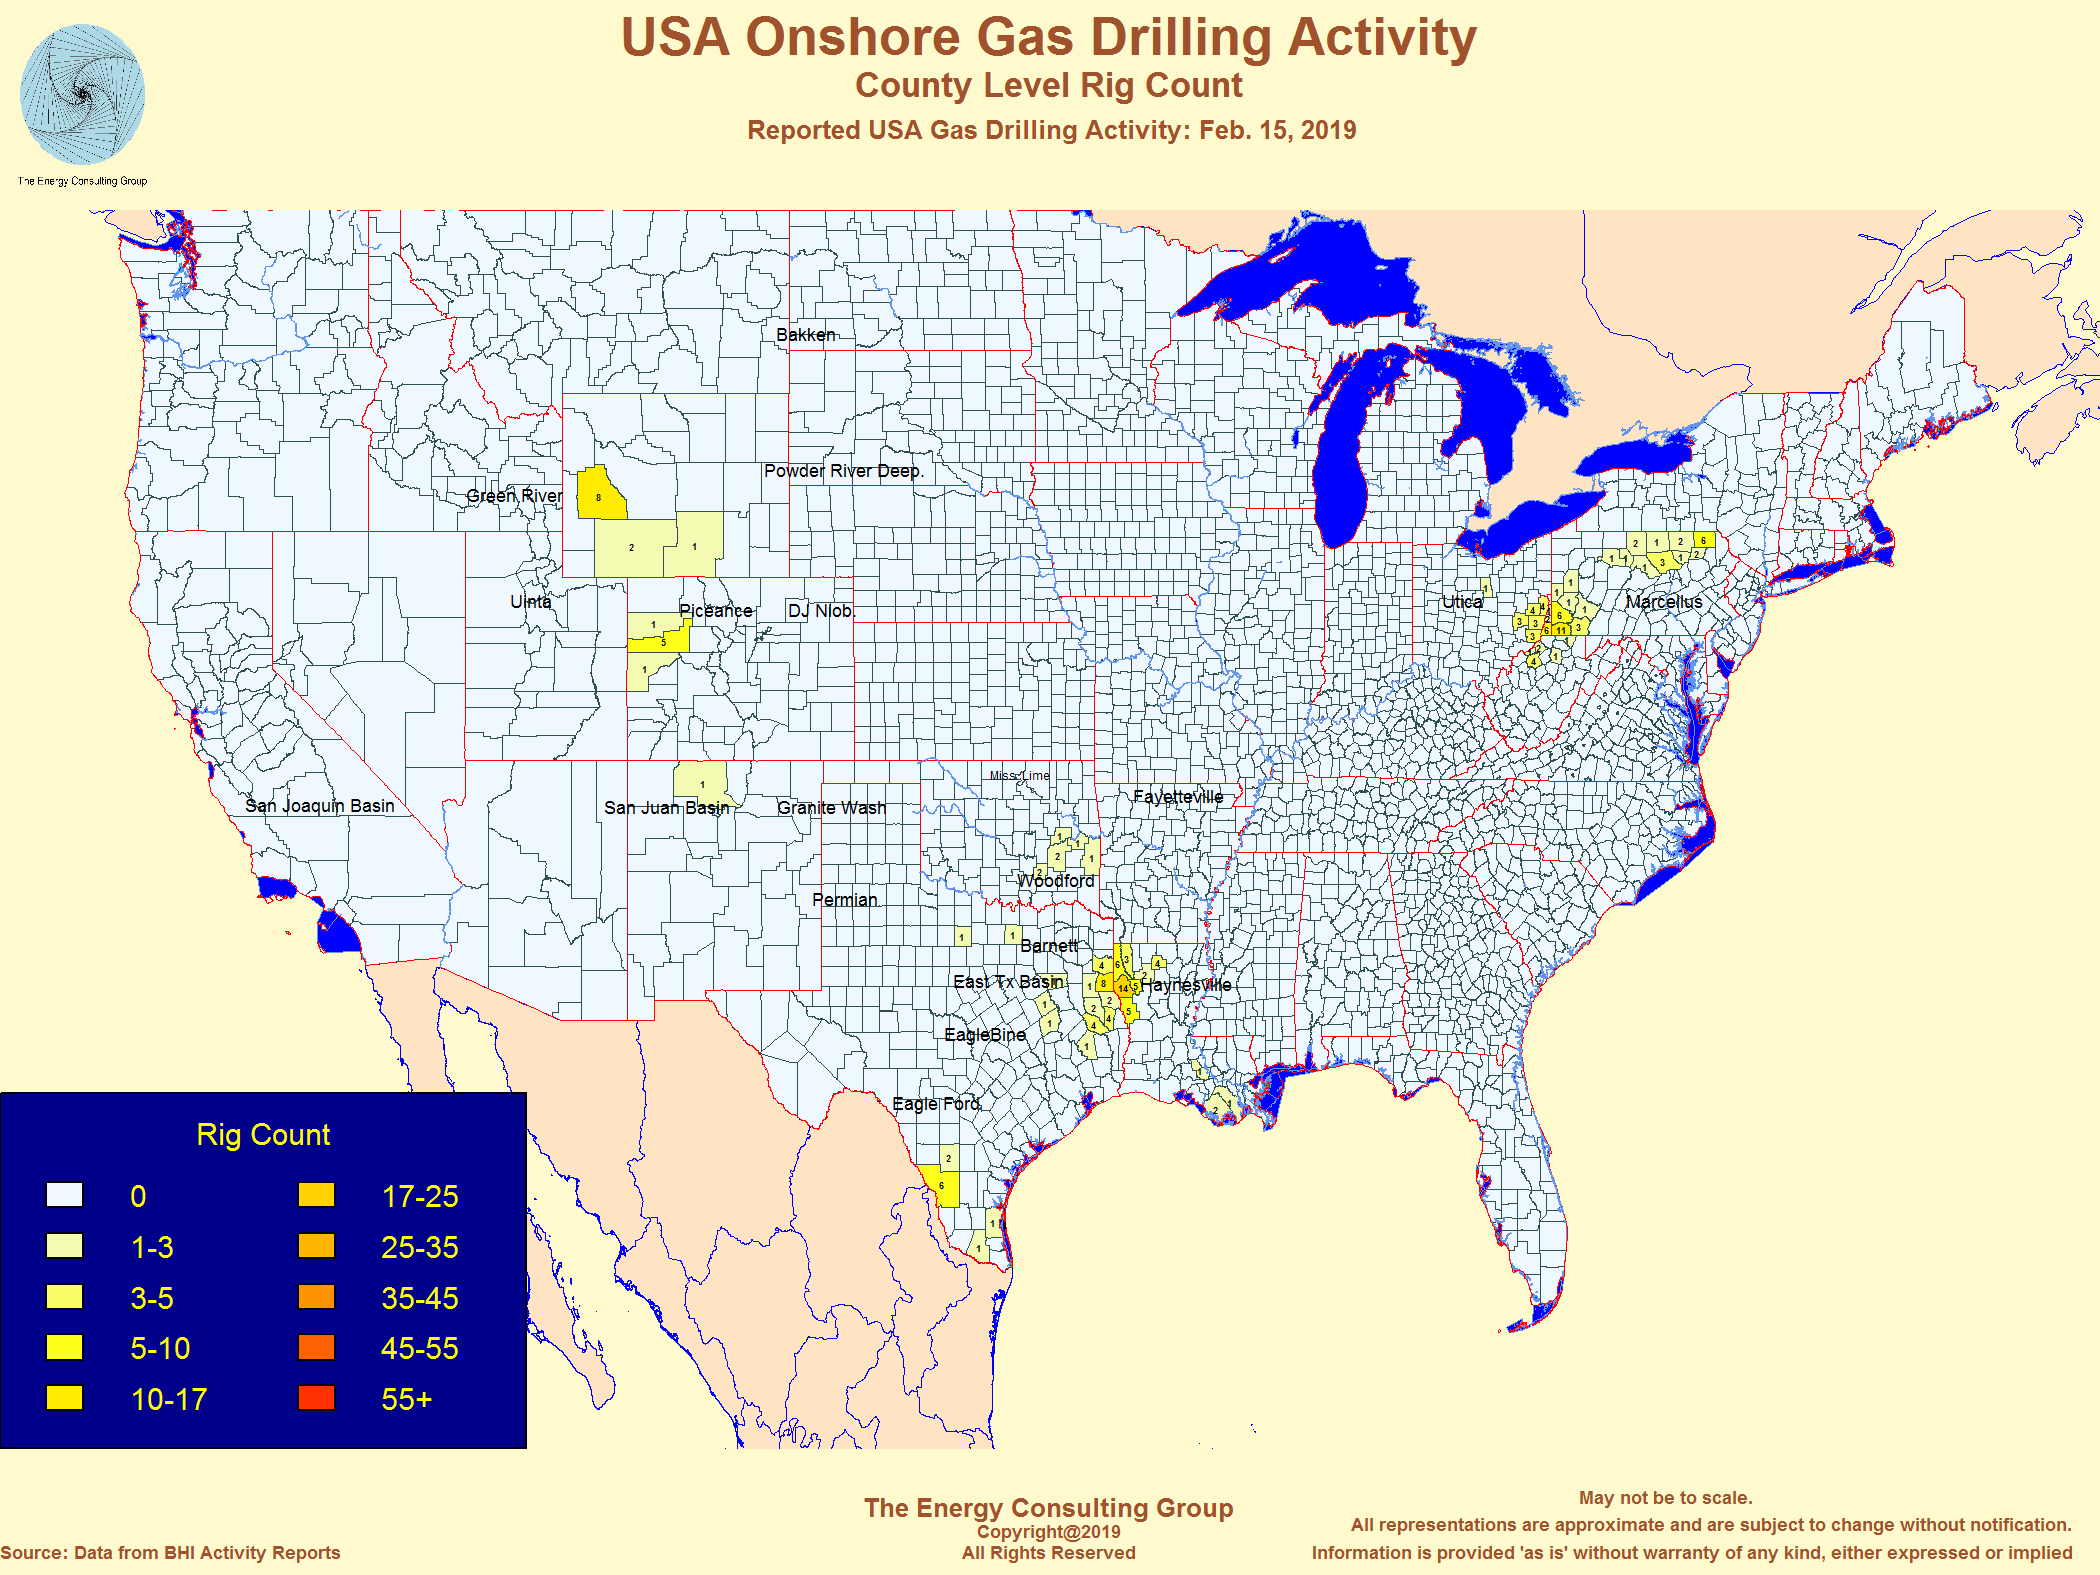
For Larger, Higher Resolution View, Click ImageMap of USA Onshore Gas Drilling Activity
February 2019
For Larger, Higher Resolution View, Click Image
Gas Price Versus Gas Rig Count
(Feb 2020)

For Larger, Higher Resolution View, Click ImageMap of USA Onshore Drilling Active
September
2021

For Larger, Higher Resolution View, Click Image
Link to webpage with in-depth data and information about North America
oil and gas drilling activity.
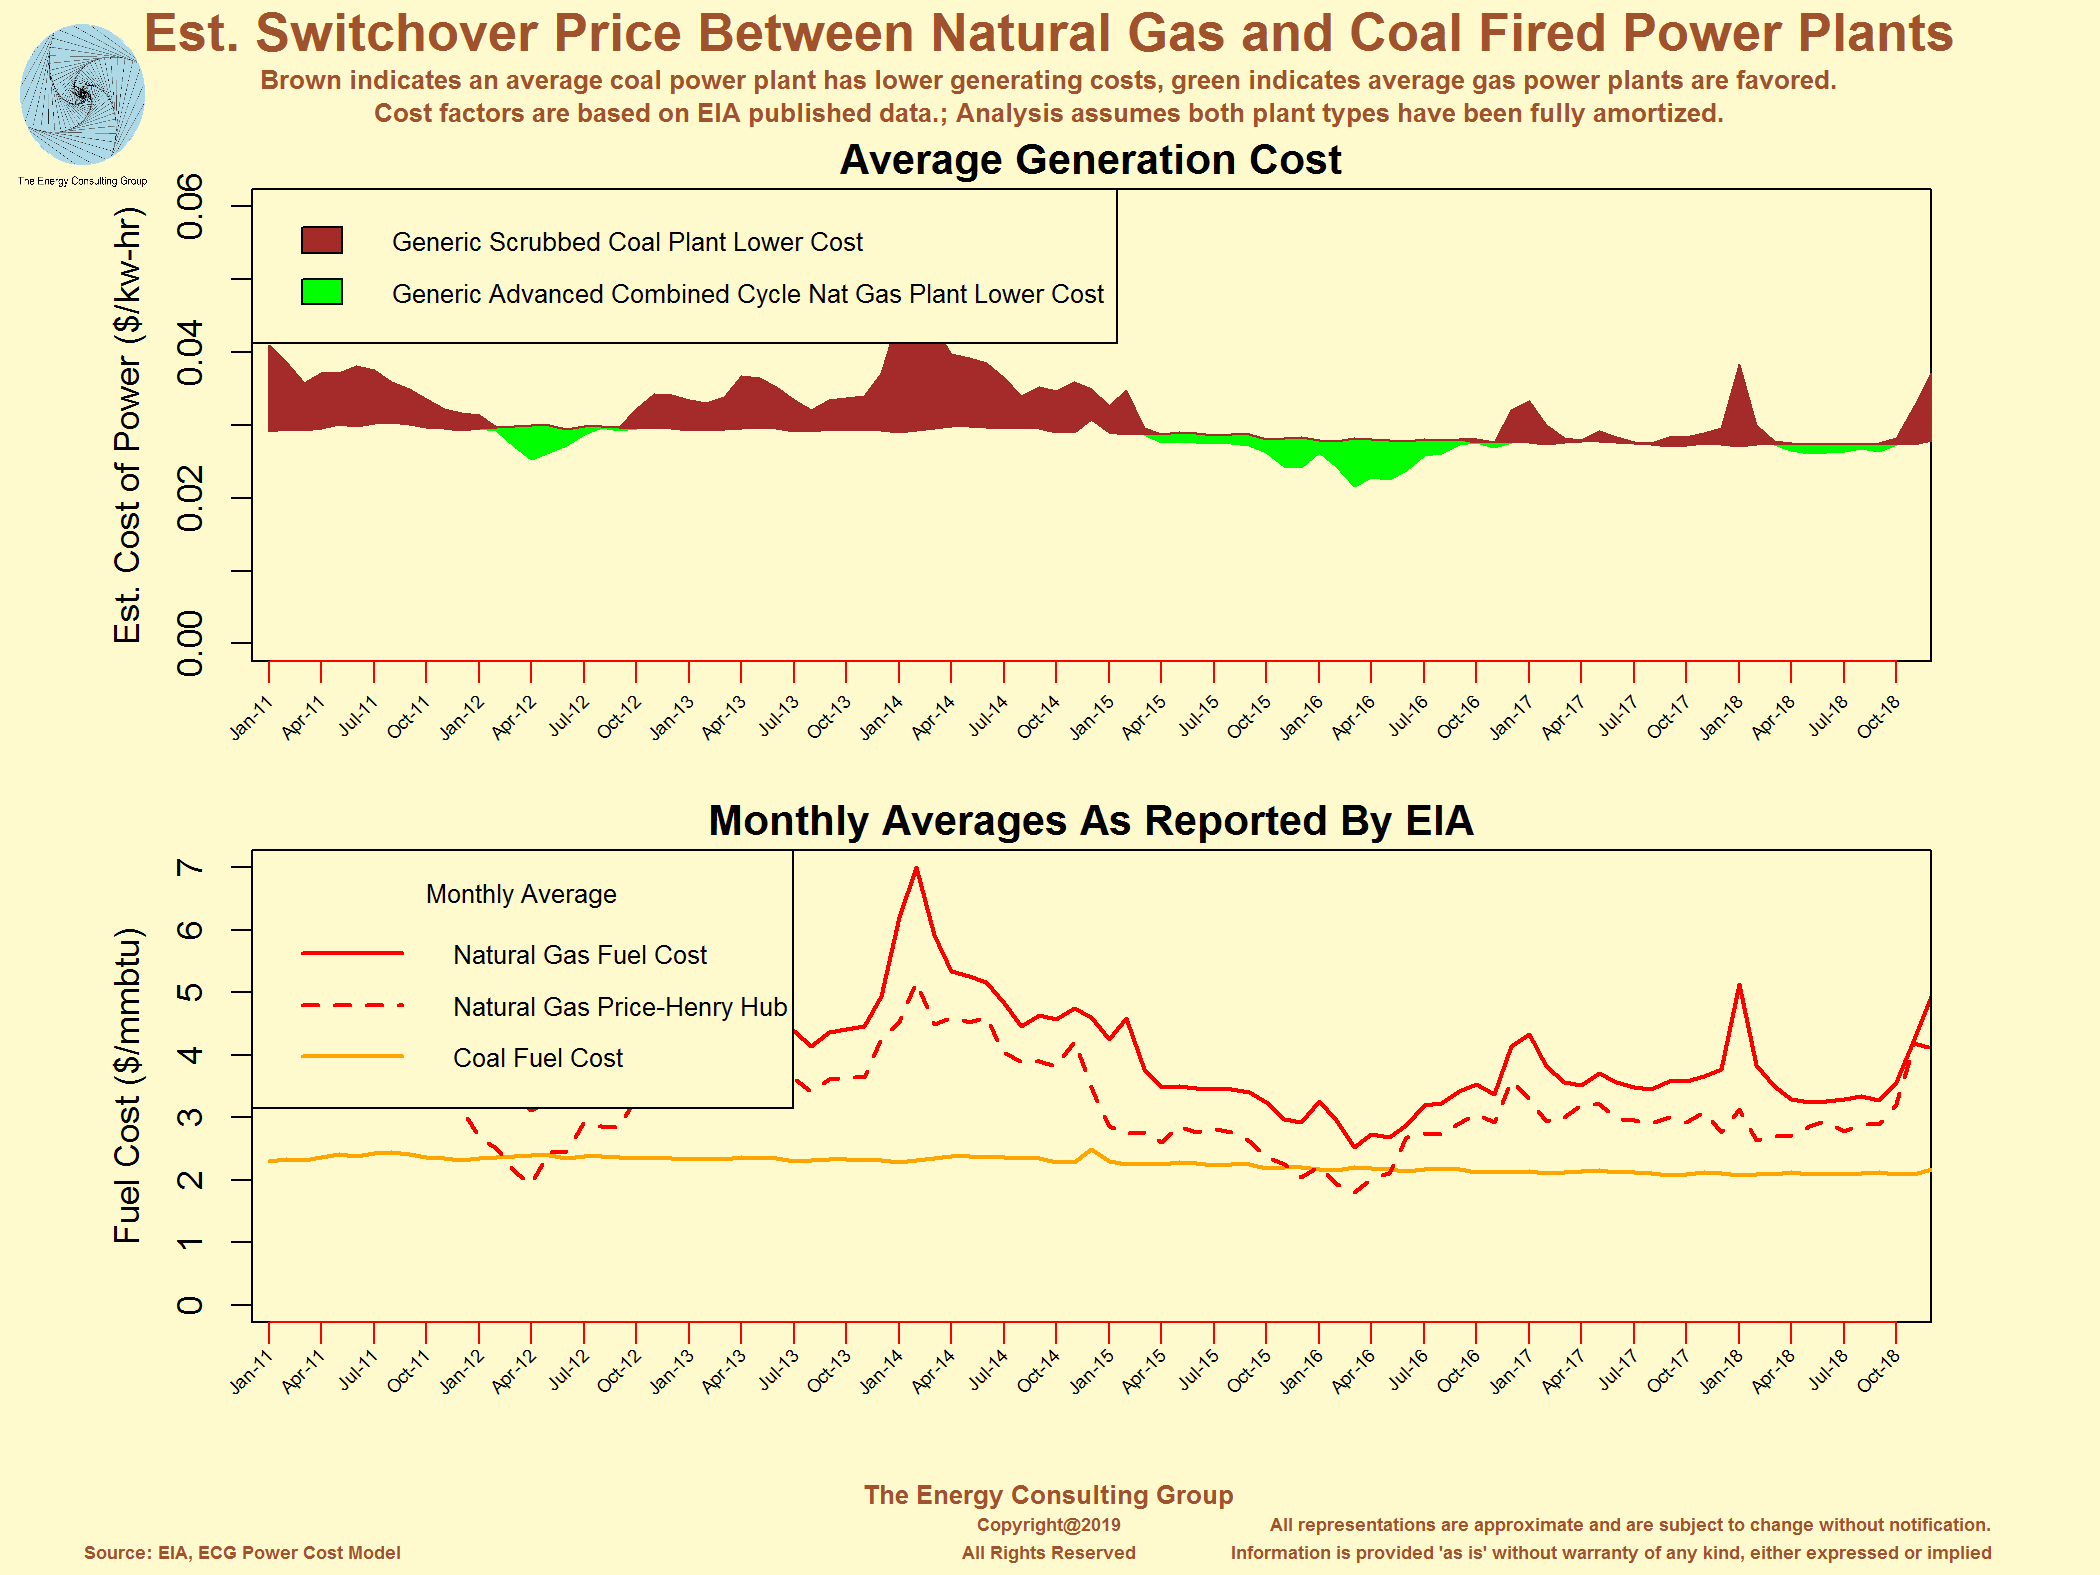
Another short to medium term factor in North American natural gas demand is fuel-on-fuel competition in the electric power industry.
So, while there is a secular, long term shift out of coal in the power sector
(noted below, in the exhibit titled, "US Electric Power Generation ByType: Coal
Market Share is Declining"), the power sector has also become adept at
short term, back and forth switching between between coal and natural gas fueled
power plants. The reason is to arbitrage relative price differences
between the fuels. Our research
(see below) illustrates that once natural gas prices at Henry Hub move below
$3.00/mmbtu, gas becomes increasingly competitive with coal for power
burn, and vice versa.
Return to Web Page Index
Regional Price Variation Across the US Natural
Gas Market
The spot price, trading hub maps presented below
illustrate the price impact that plays can have on the underlying commidty
price. In this case, the
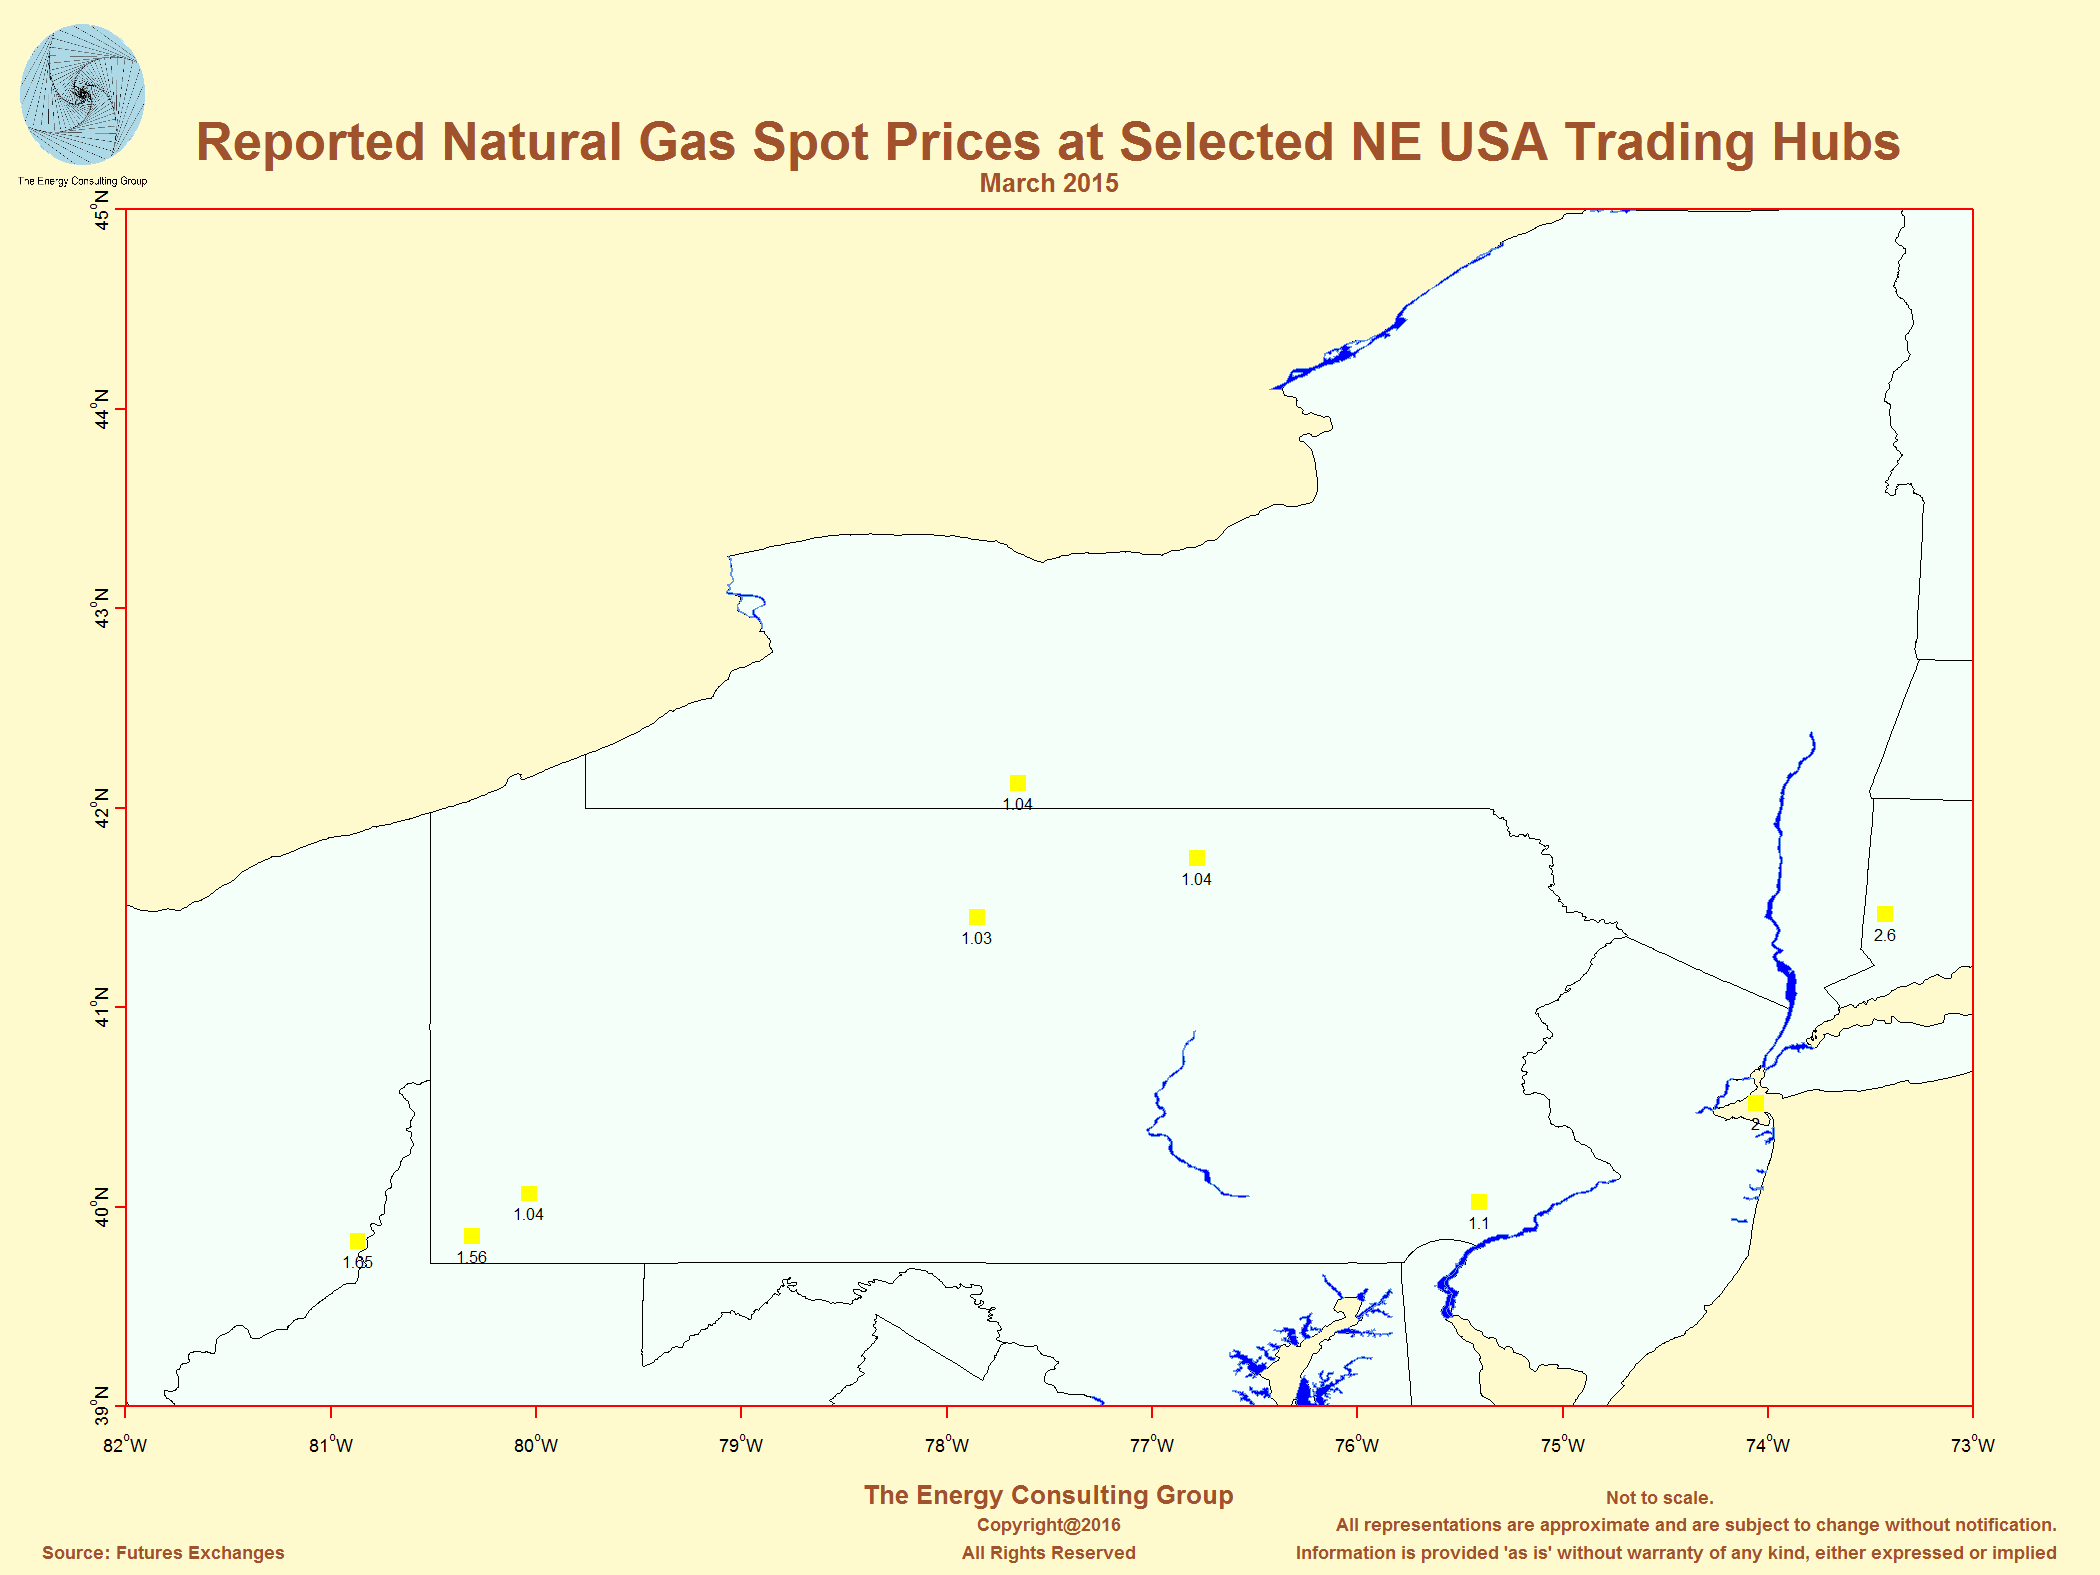
Marcellus and Utica in the northeast USA are hi-lighted. As shown by the spot price map
of the northeast USA, prompt prices in the Marcellus/Utica area were about half
or less that of Henry Hub/NYMEX pricing in January and February 2015.
Select USA Natural Gas Hubs
(These map locations should roughly correspond with the hubs listed to
the right)
![]()
or Larger, Higher Resolution View, Click Image
Natural Gas Intelligence (NGI) and Genscape website.
Click
here to go to the full page for all the information.
Return to Web Page Index
Reported January 2015
Natural Gas Spot Prices at Selected Trading Hubs in the
United States: This demonstrates pricing relative to
Henry Hub

For
Larger, Higher Resolution View, Click Image
Reported January 2015
Natural Gas Spot Prices At Selected Trading Hubs in the Northeast United
States
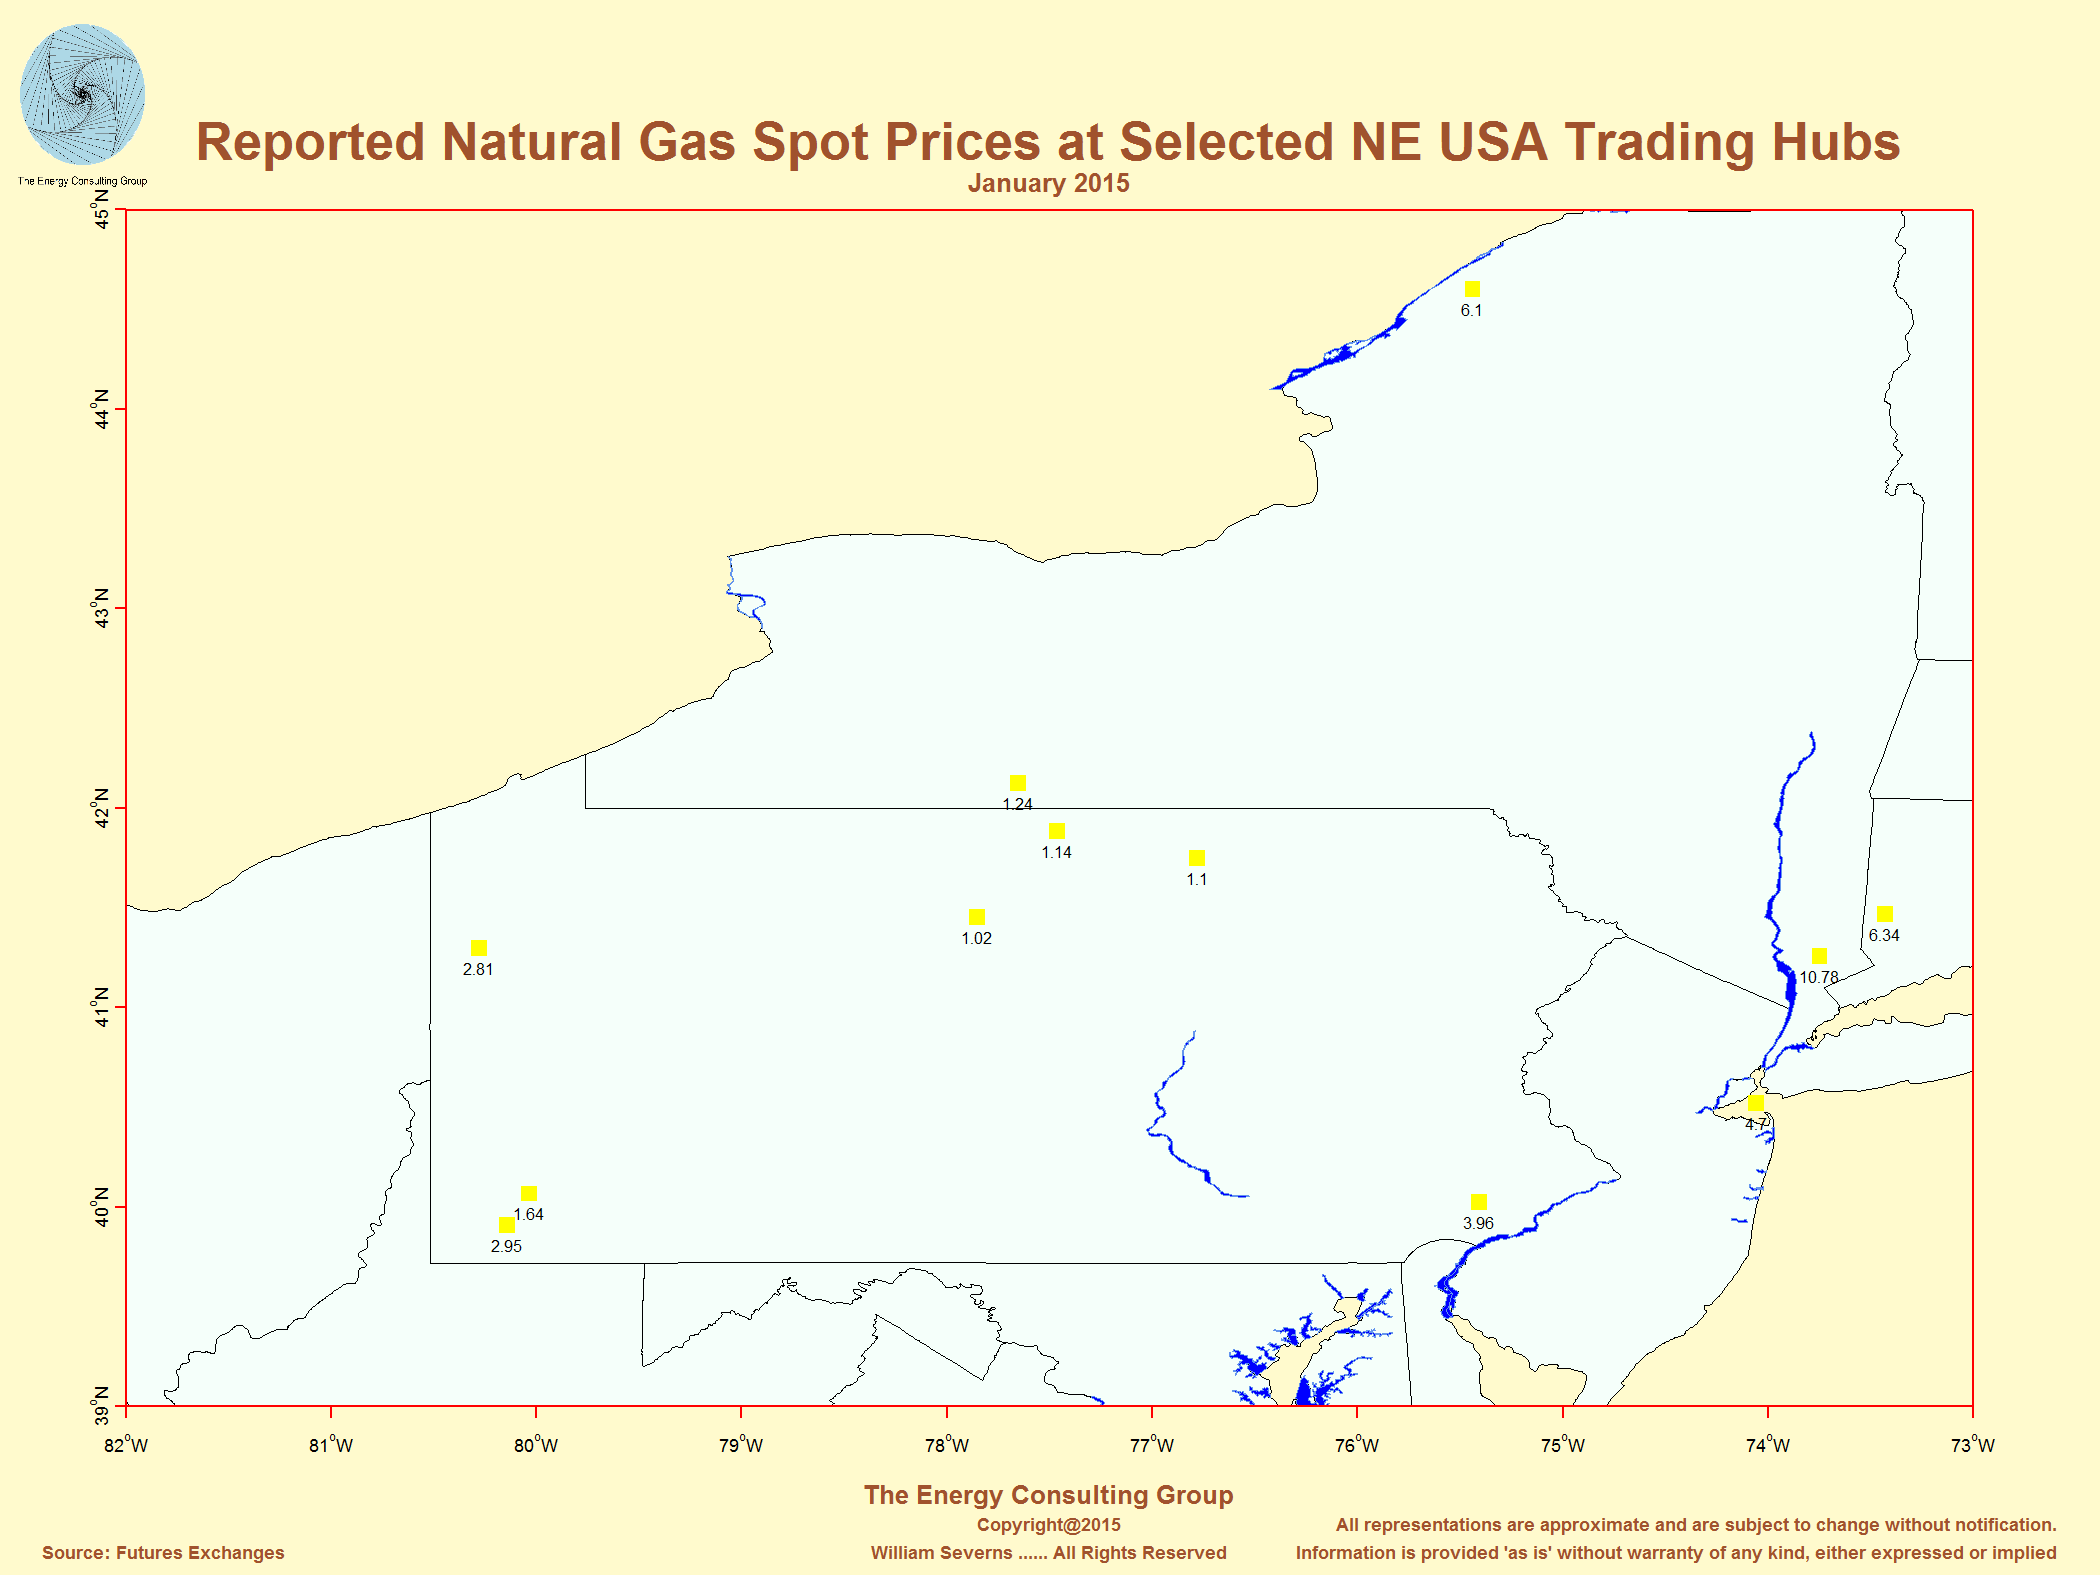
For Larger, Higher Resolution View, Click Image
Reported Natural Gas
Spot Prices At Selected Trading Hubs Across the United States as of
March 2016
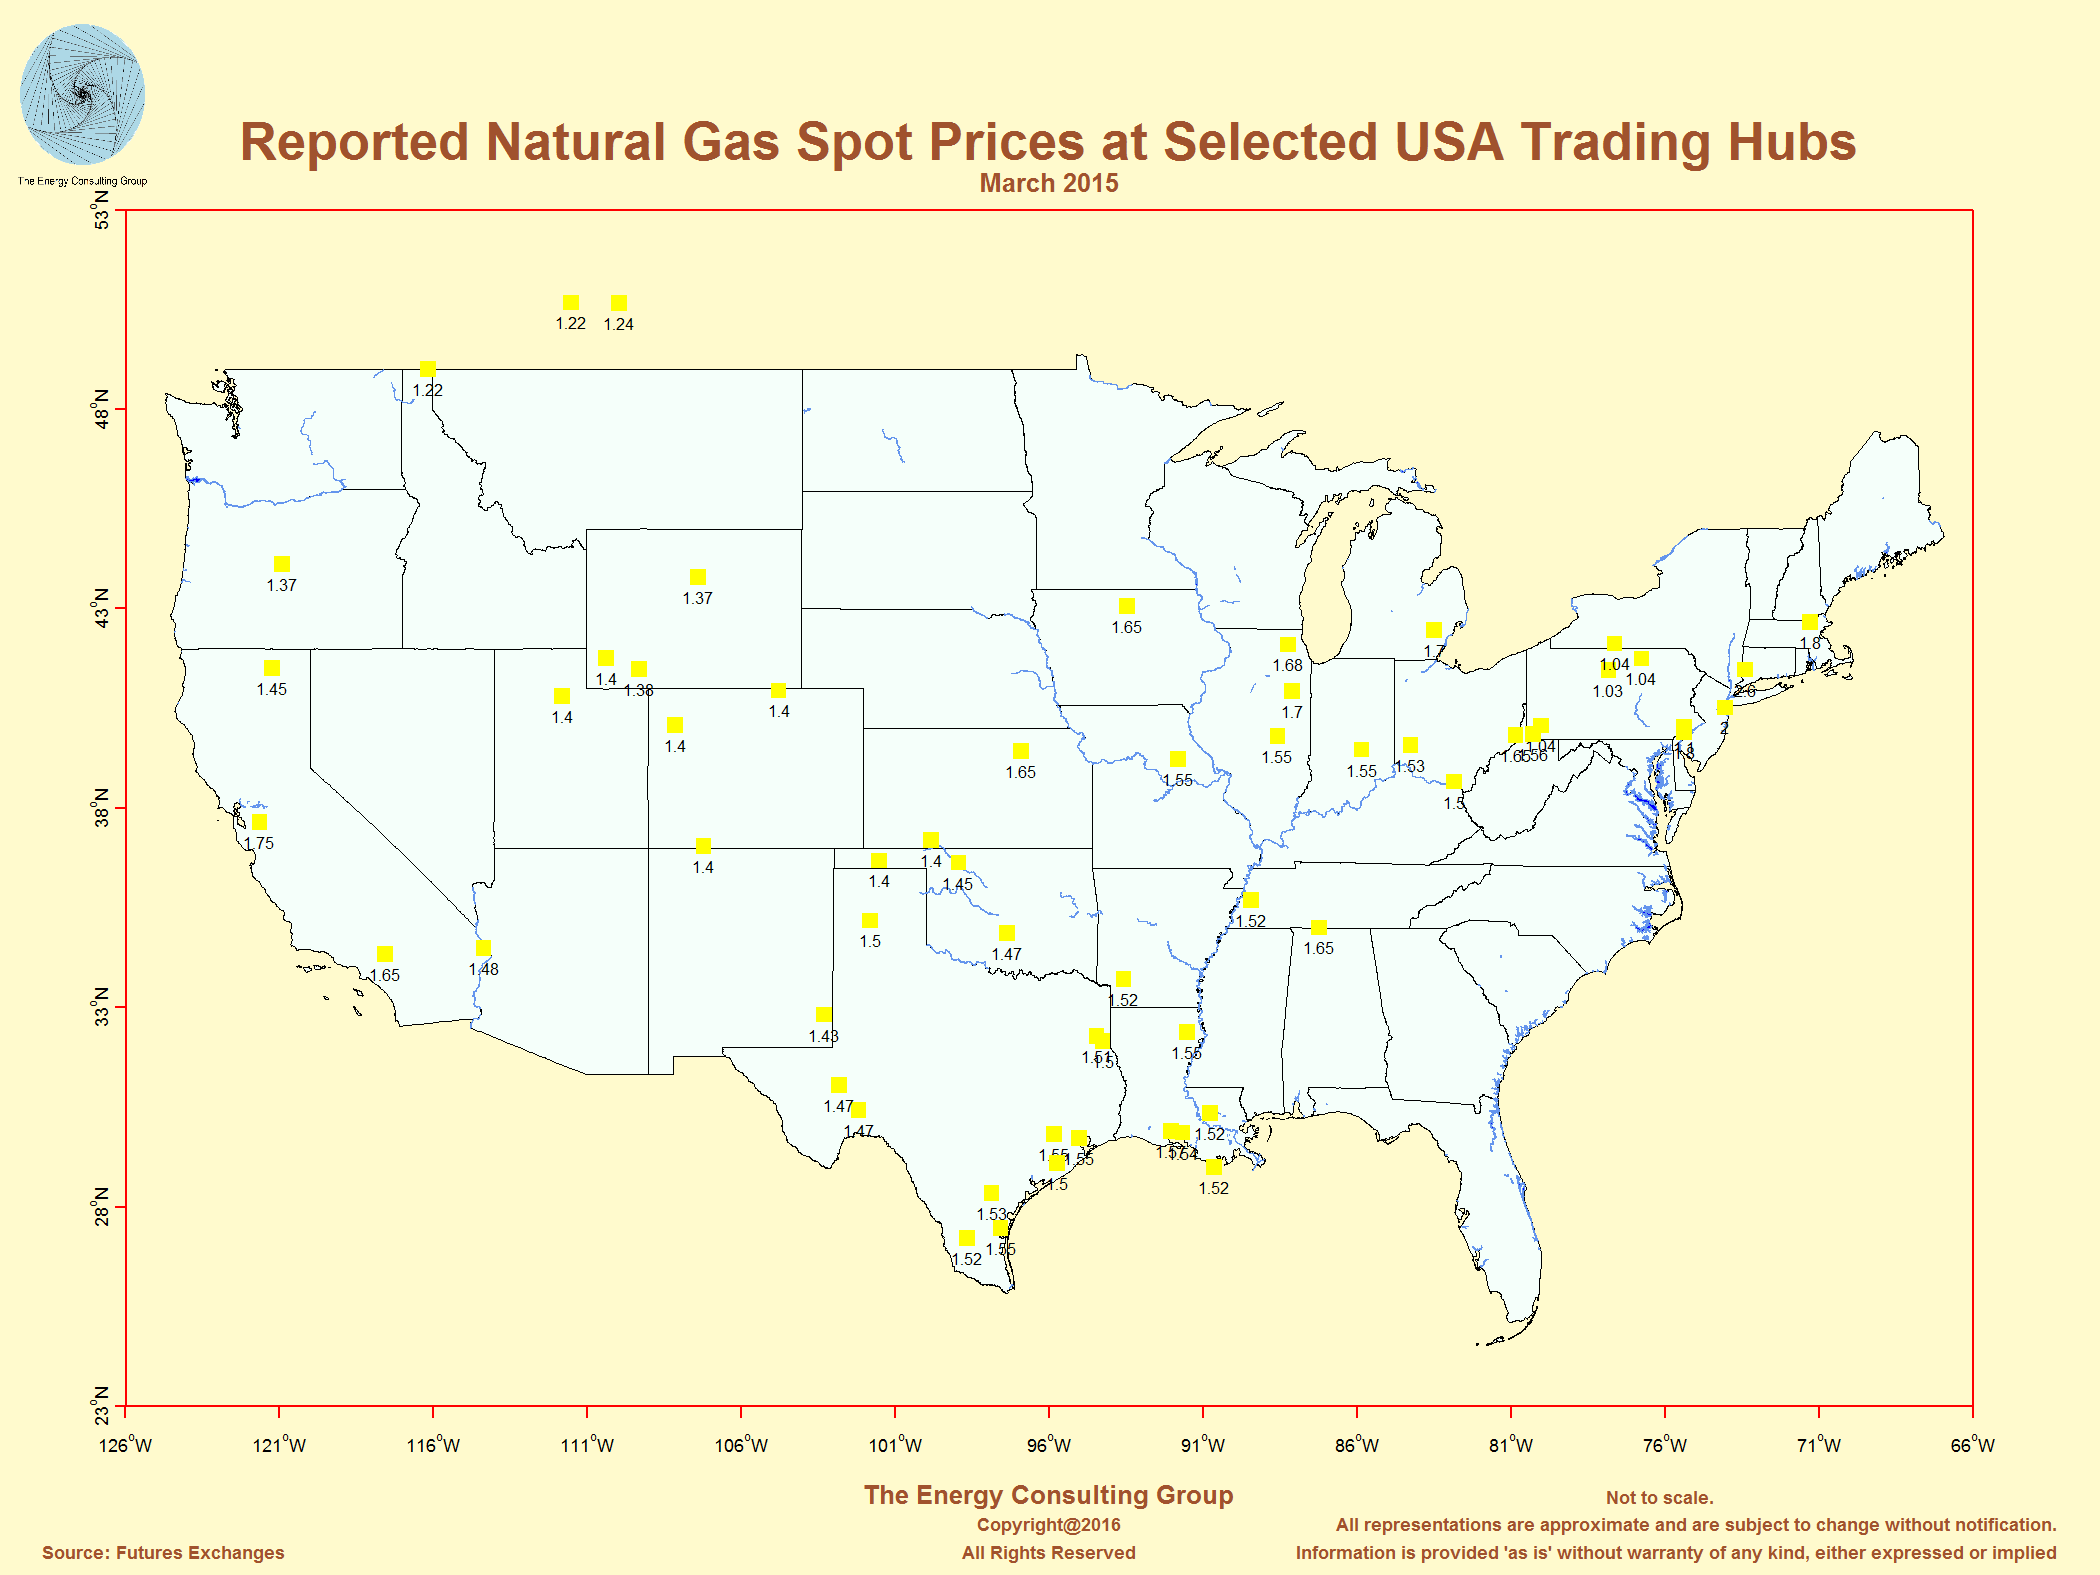
For Higher Resolution View, Click Image
Reported Natural Gas
Spot Prices At Selected Trading Hubs in the Northeast United States as
of March 2016
For Larger, Higher Resolution View, Click Image
Shale Gas Technology and Productivity Trends
The rapid pace and magnitude with which
shale play technology is improving is illustrated by the two plots below. The
one on the left is an example is from an early shale gas well with an initial
rate of about 3 MMCFD, and an EUR of about 4.5 BCF. As the horizontal drilling,
multistage fracking technology improved and became less expensive, individual
well rates and recoveries climbed. After years of this dynamic, the industry is
now developing super wells, which are capable of flowing as much as 60-80 MMCFD,
and producing as much as 30 BCF from a single well. This 20-25x increase in
rate, and 4-6 times increase in EUR, is accomplished with about a 2x-2.5x increase in
well cost. Such "super" wells are becoming increasingly common. See
map below for reported initial rates from Marcellus wells completed in NE PA in
2019.


|
Rig Productivity Growth Within One Major Shale Gas Play 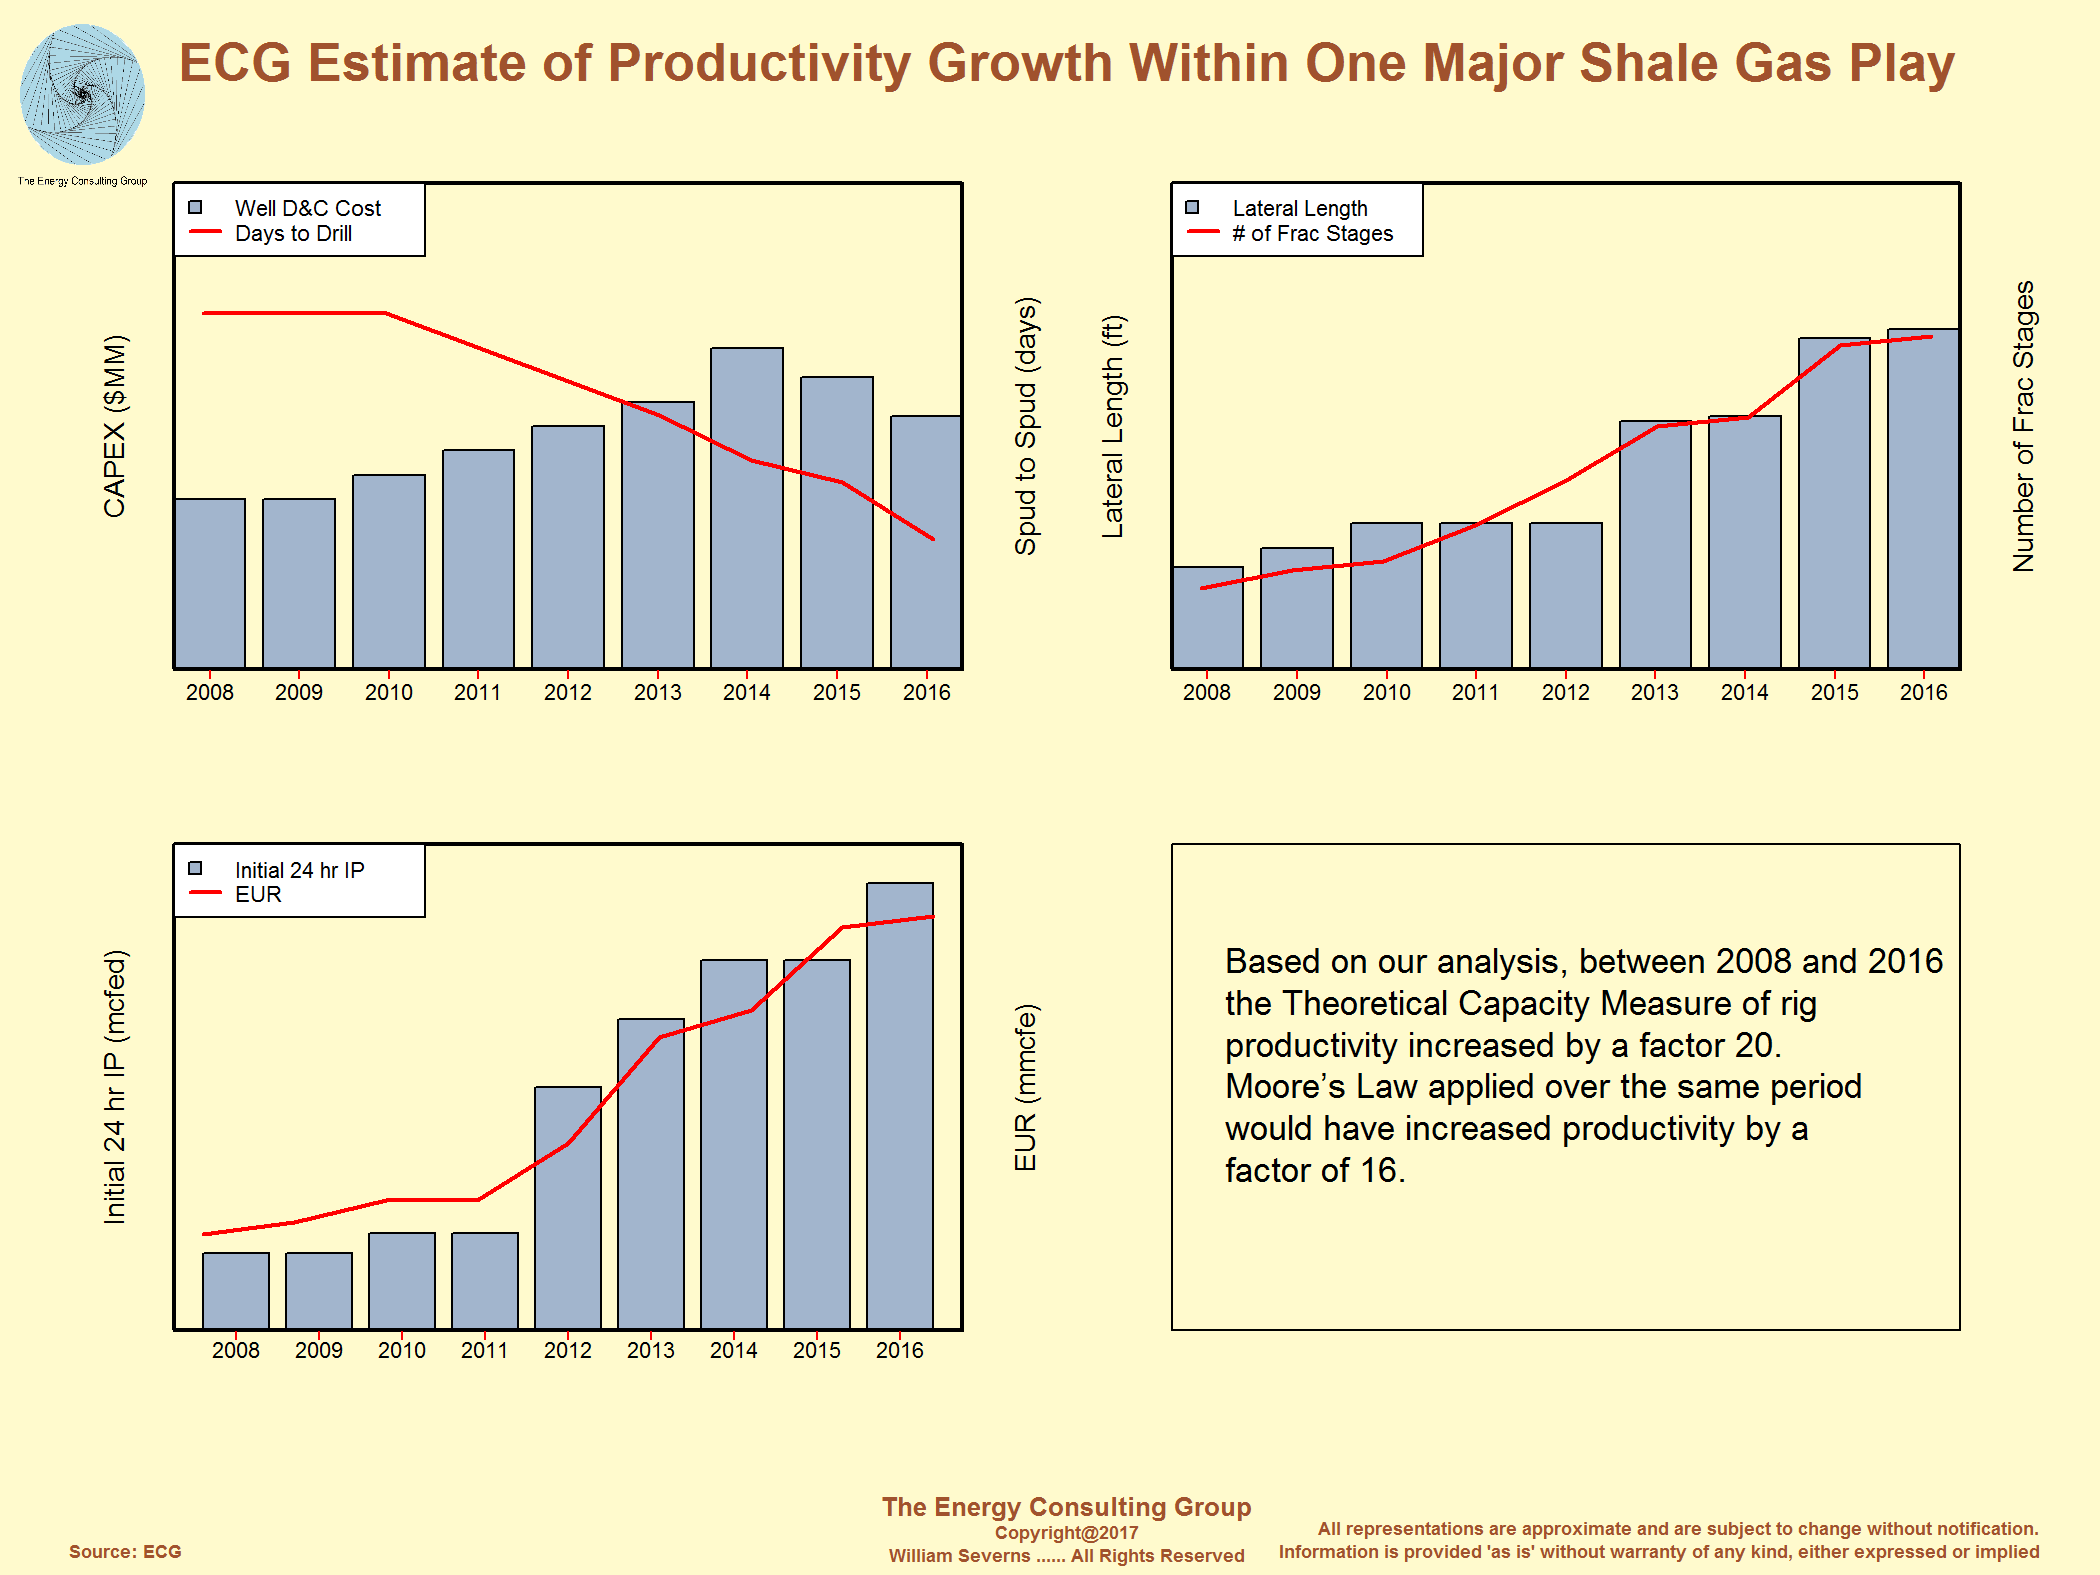 For Larger, Higher Resolution View, Click Image |
How is this possible you might ask? Well, this is one of our
speciality areas, i.e. tracking new technology in the upstream oil and
gas industry, and assessing how that technology "moves the needle" for
companies and the larger industry. Below is an example from an
operator showing how over a few short years, it managed to increase average
drilling penetration rates in a major shale play by a factor of almost
three, from 2000'/day to almost 6000'/day.
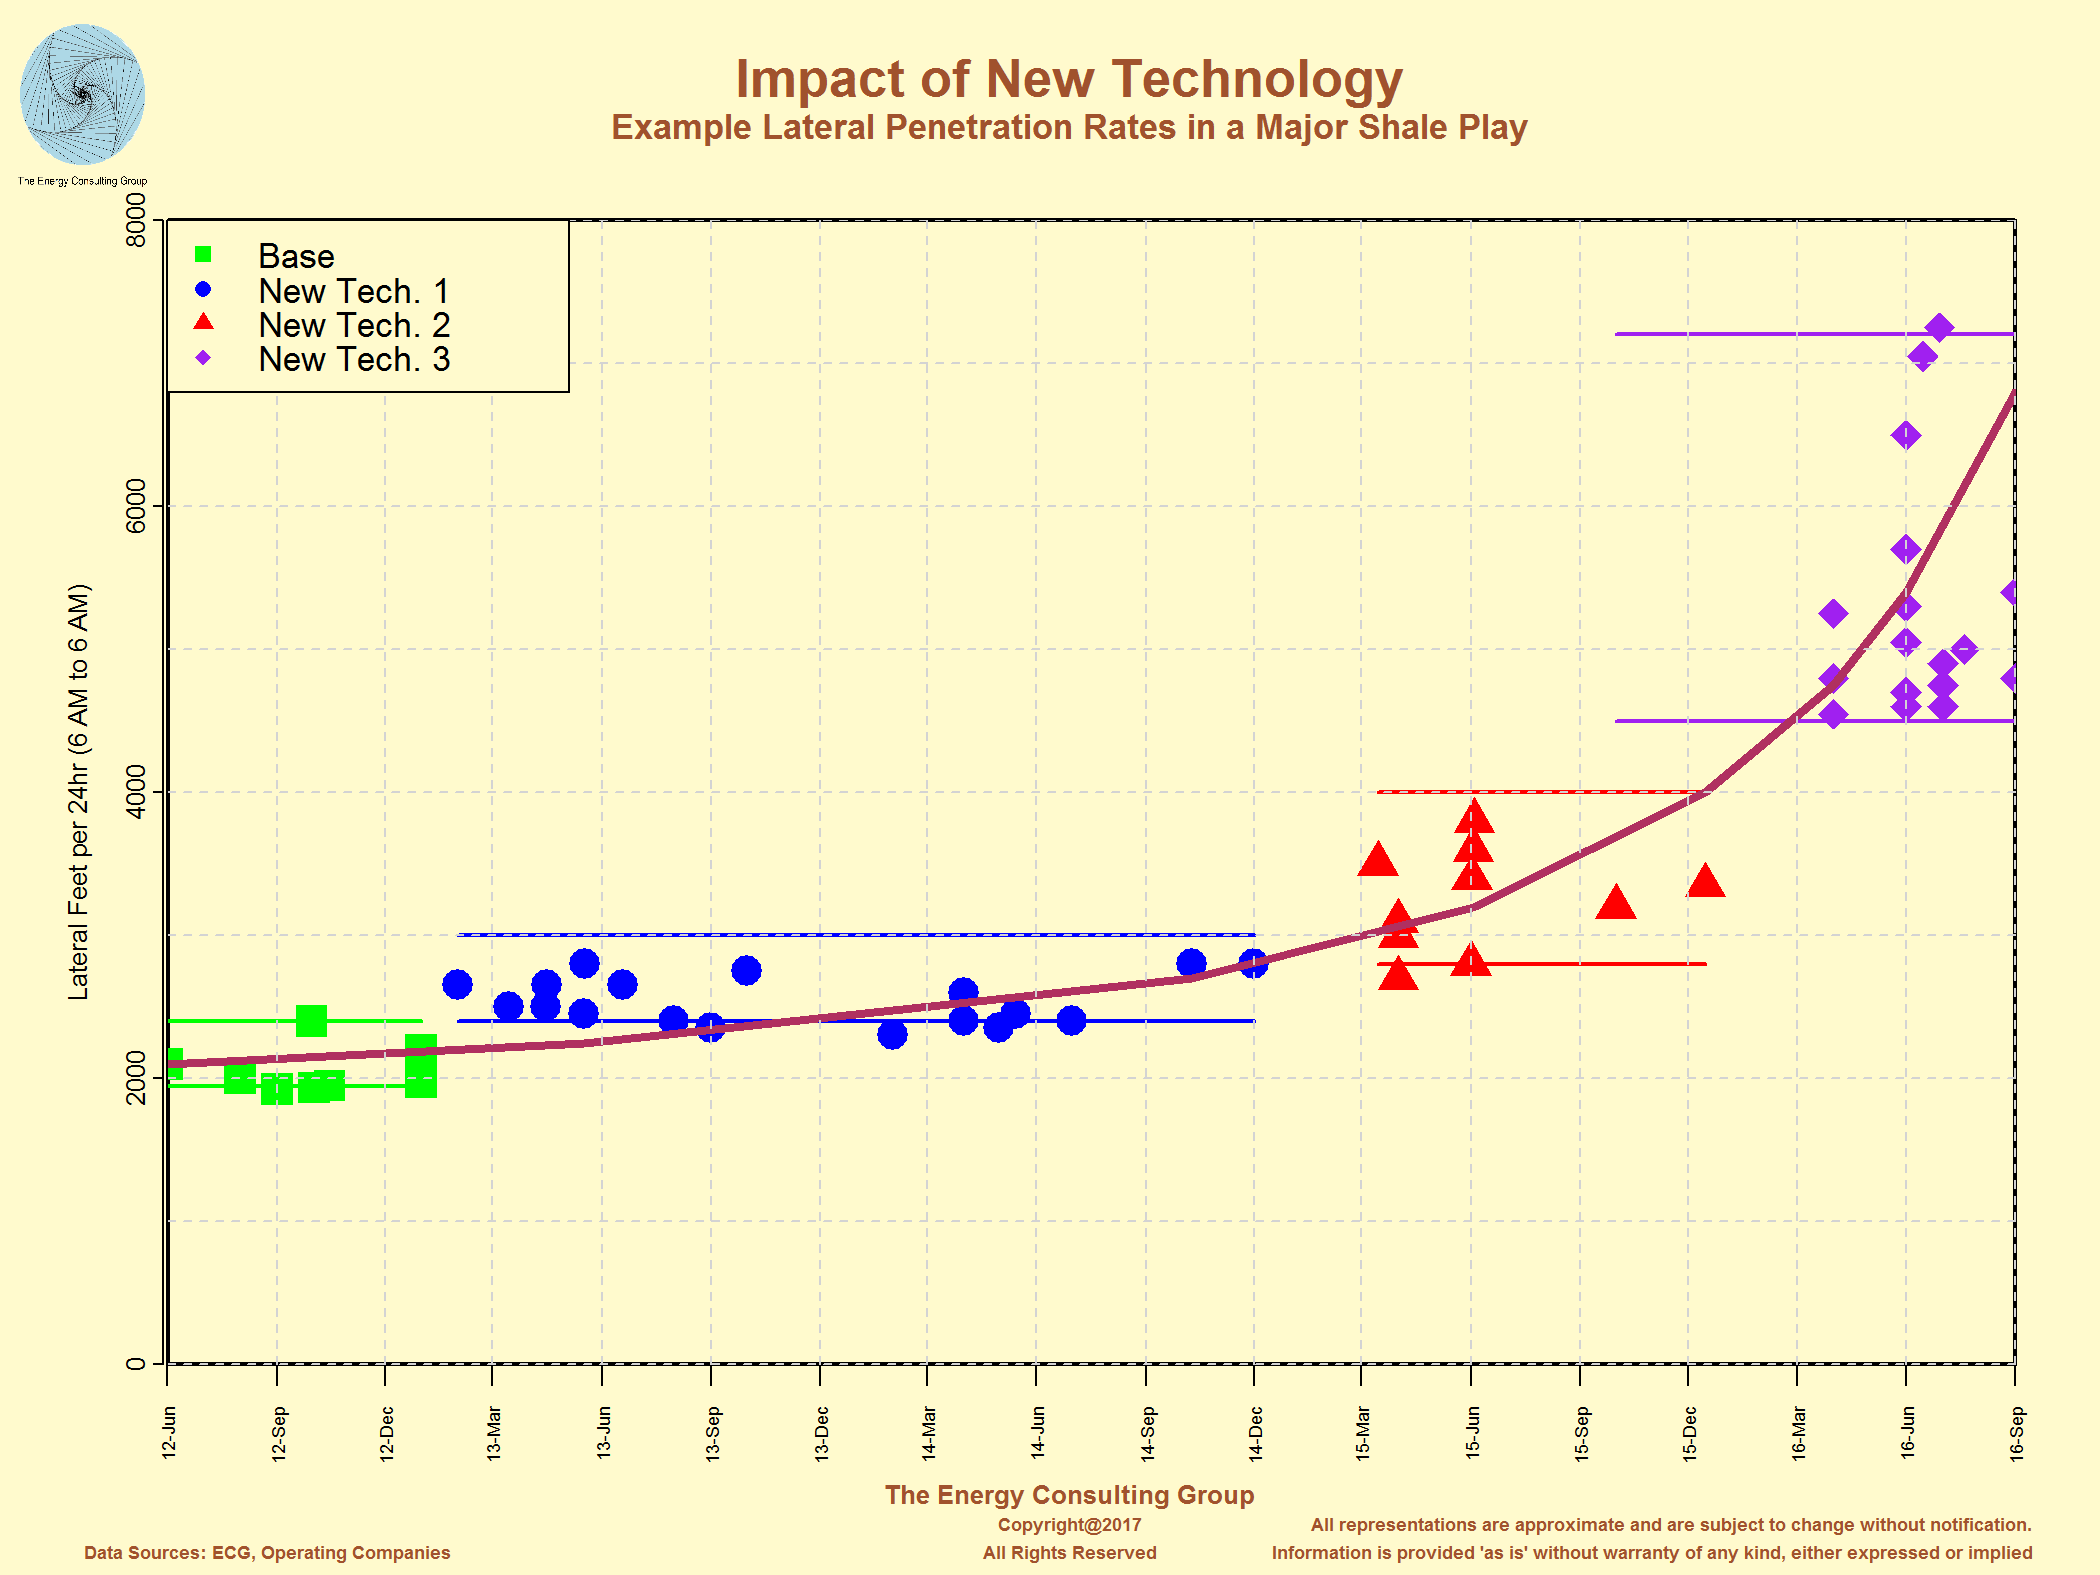 For Larger, Higher Resolution View, Click Image For Larger, Higher Resolution View, Click Image |
|
Northeast Marcellus Initial Rates Reported for One Operator mid-2019 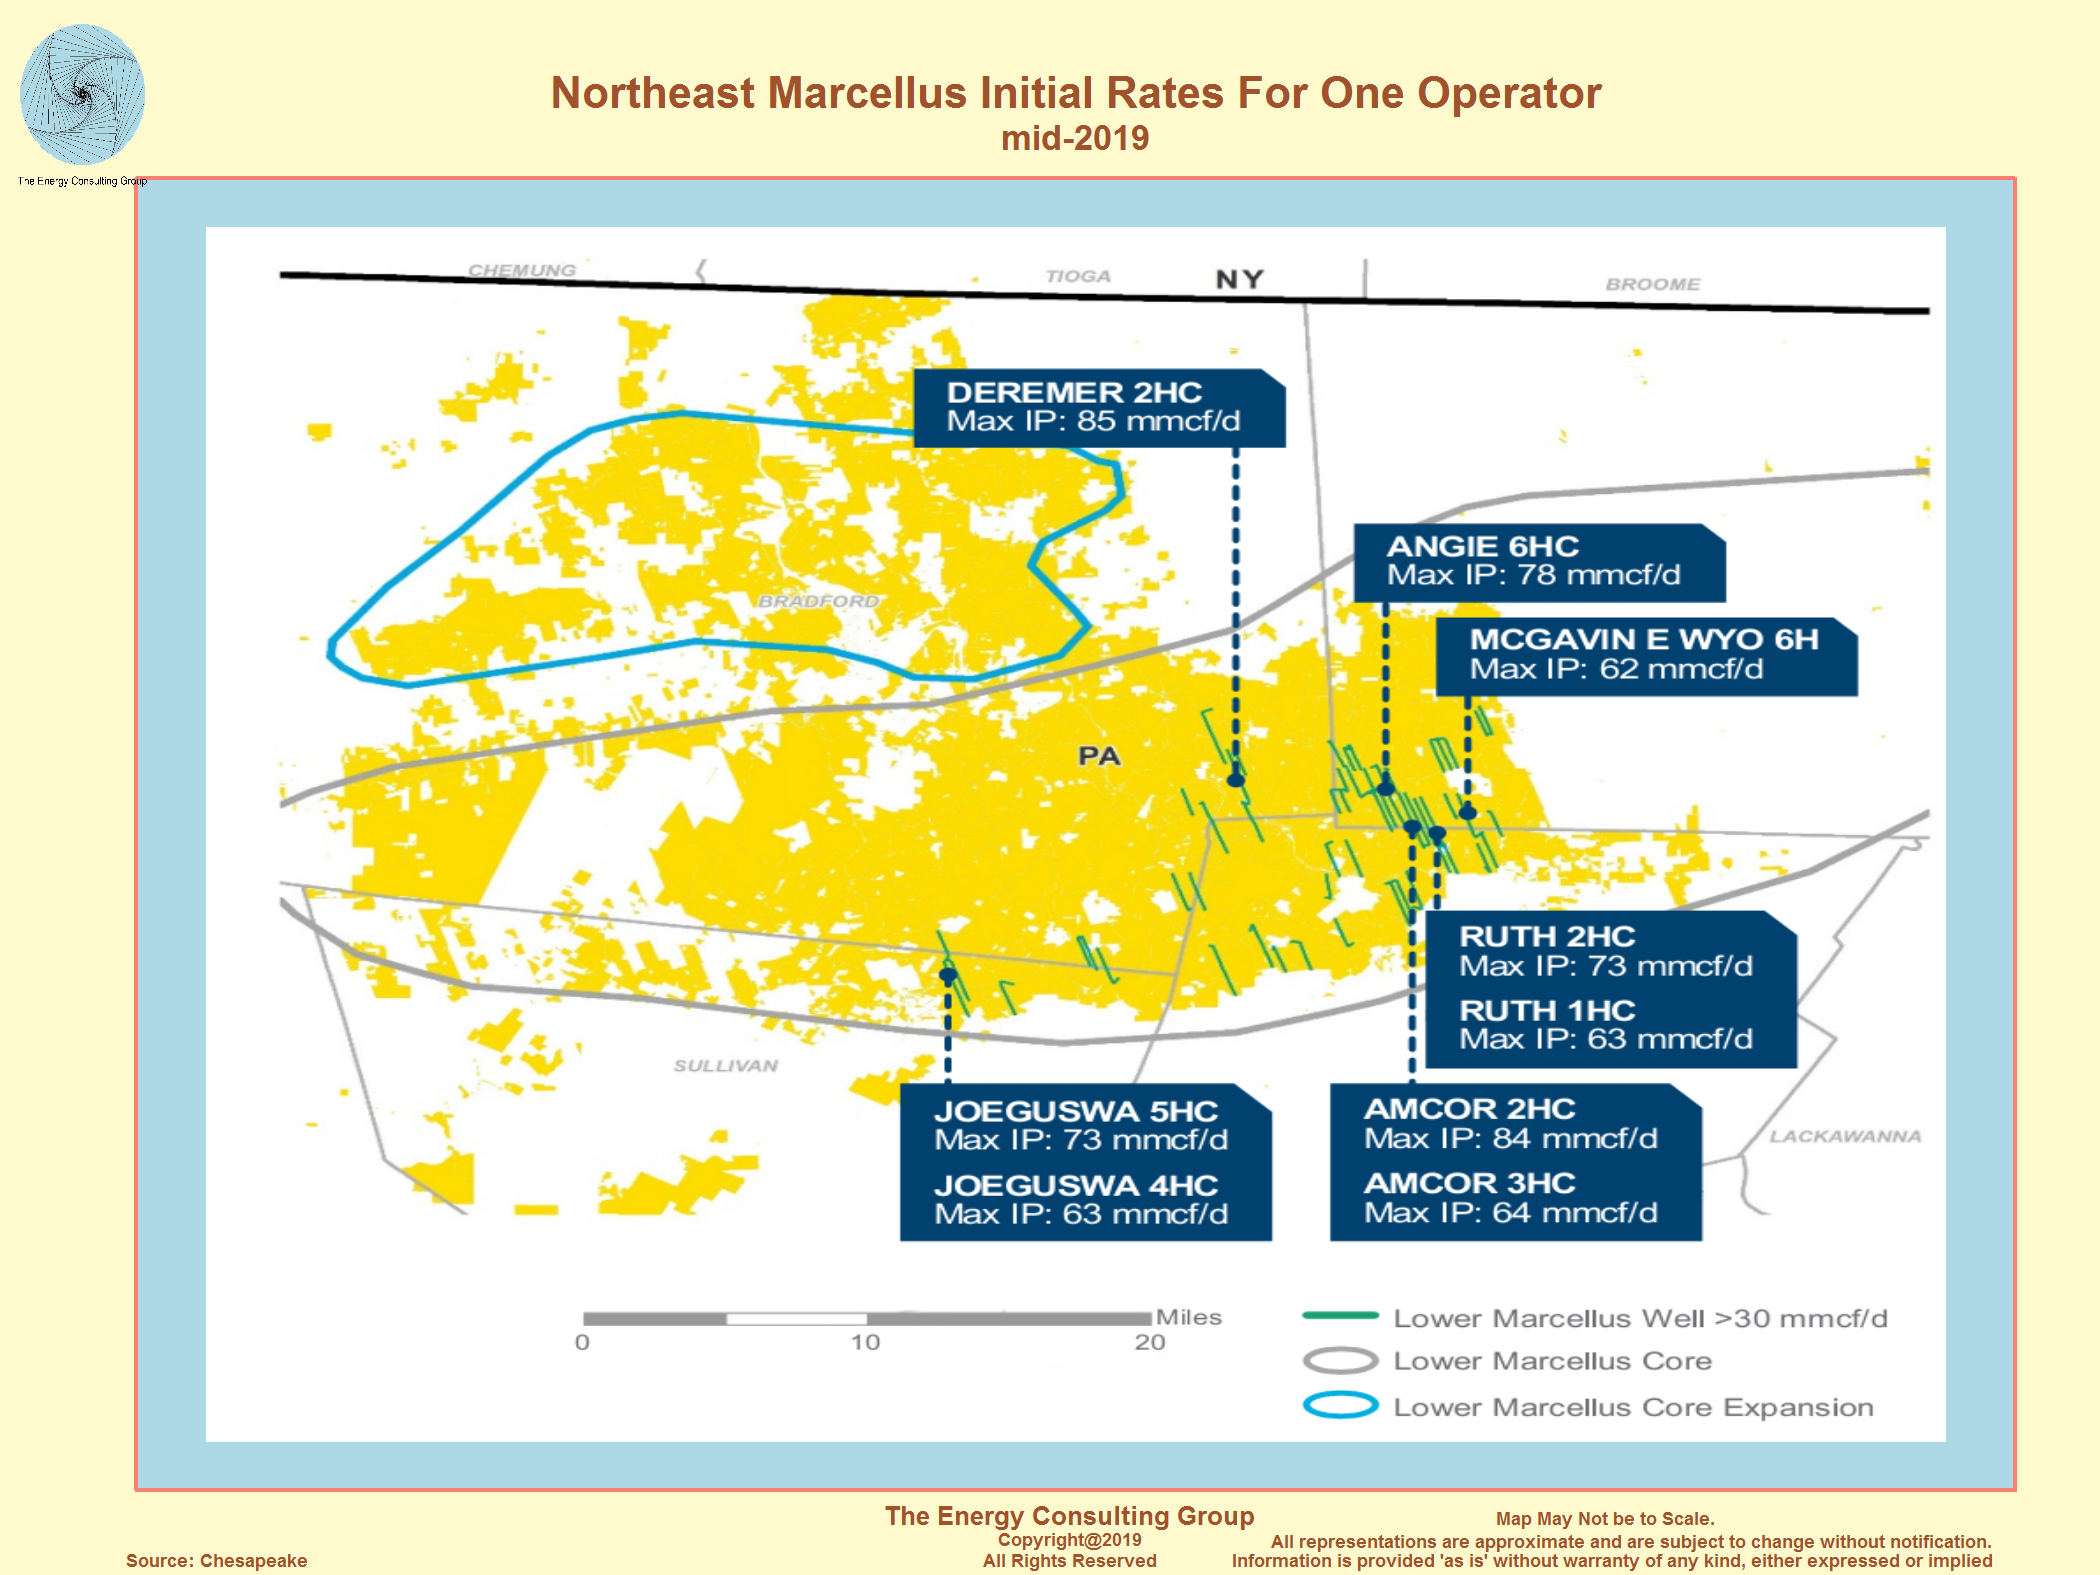 For Higher Resolution View, Click Image |
|
Example of Early Shale Gas Well Production Profile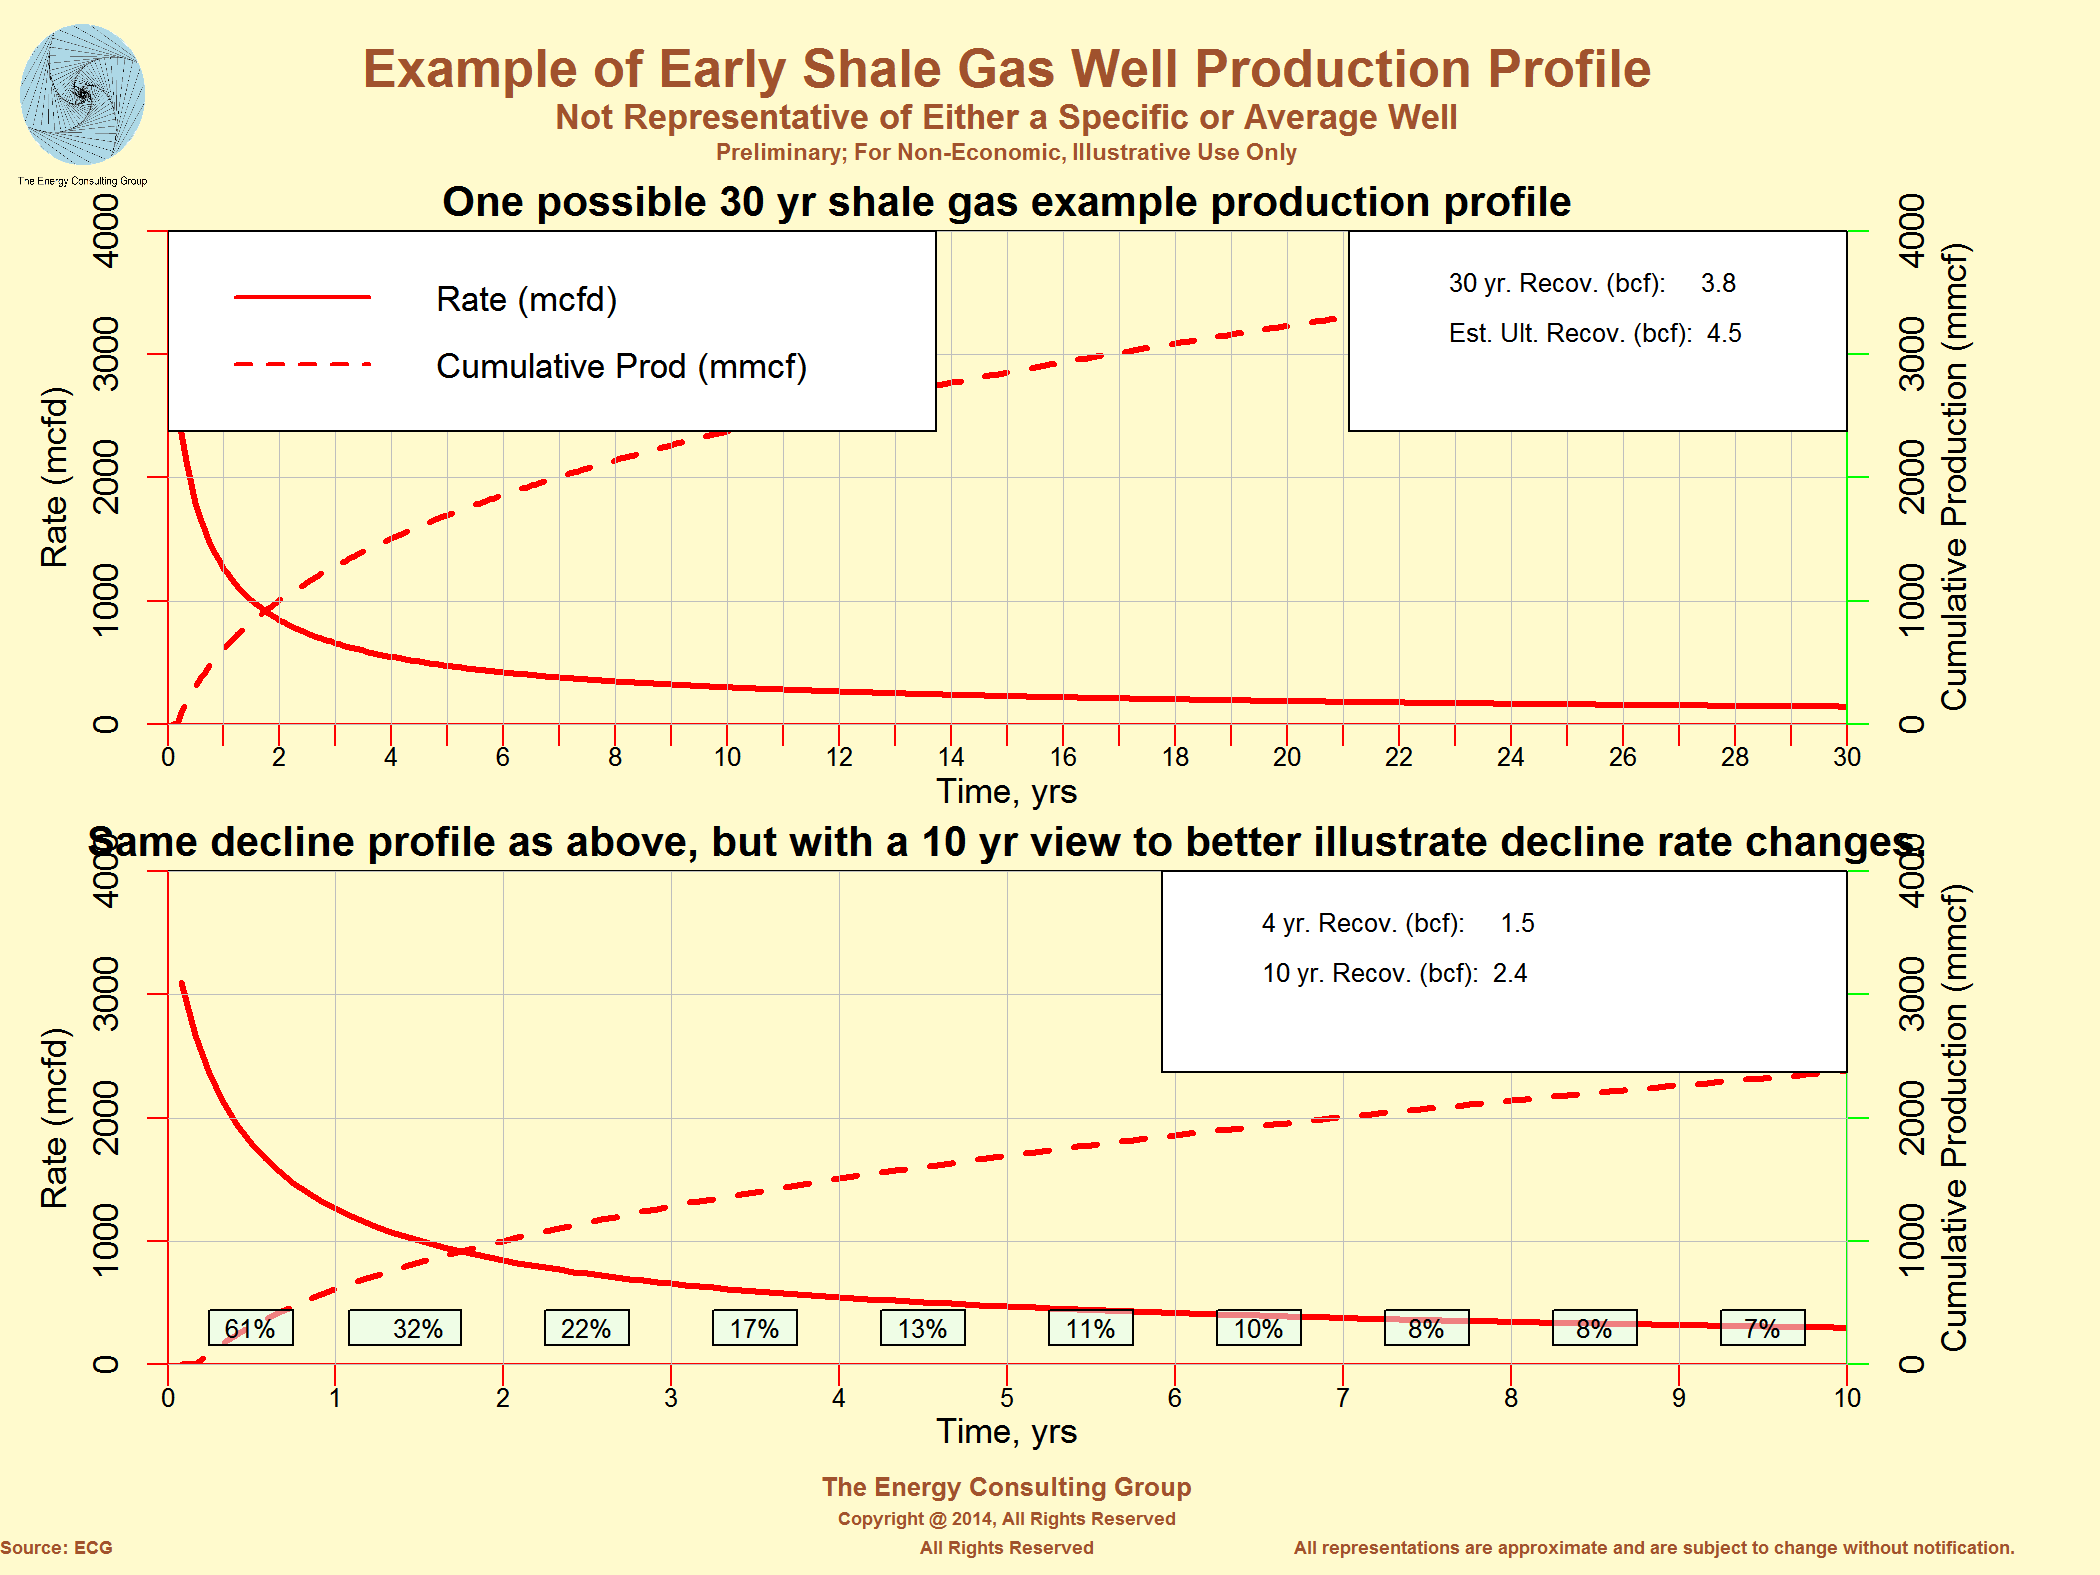 For Larger, Higher Resolution View, Click Image |
Example of Emerging Super Shale Gas Well Production Profile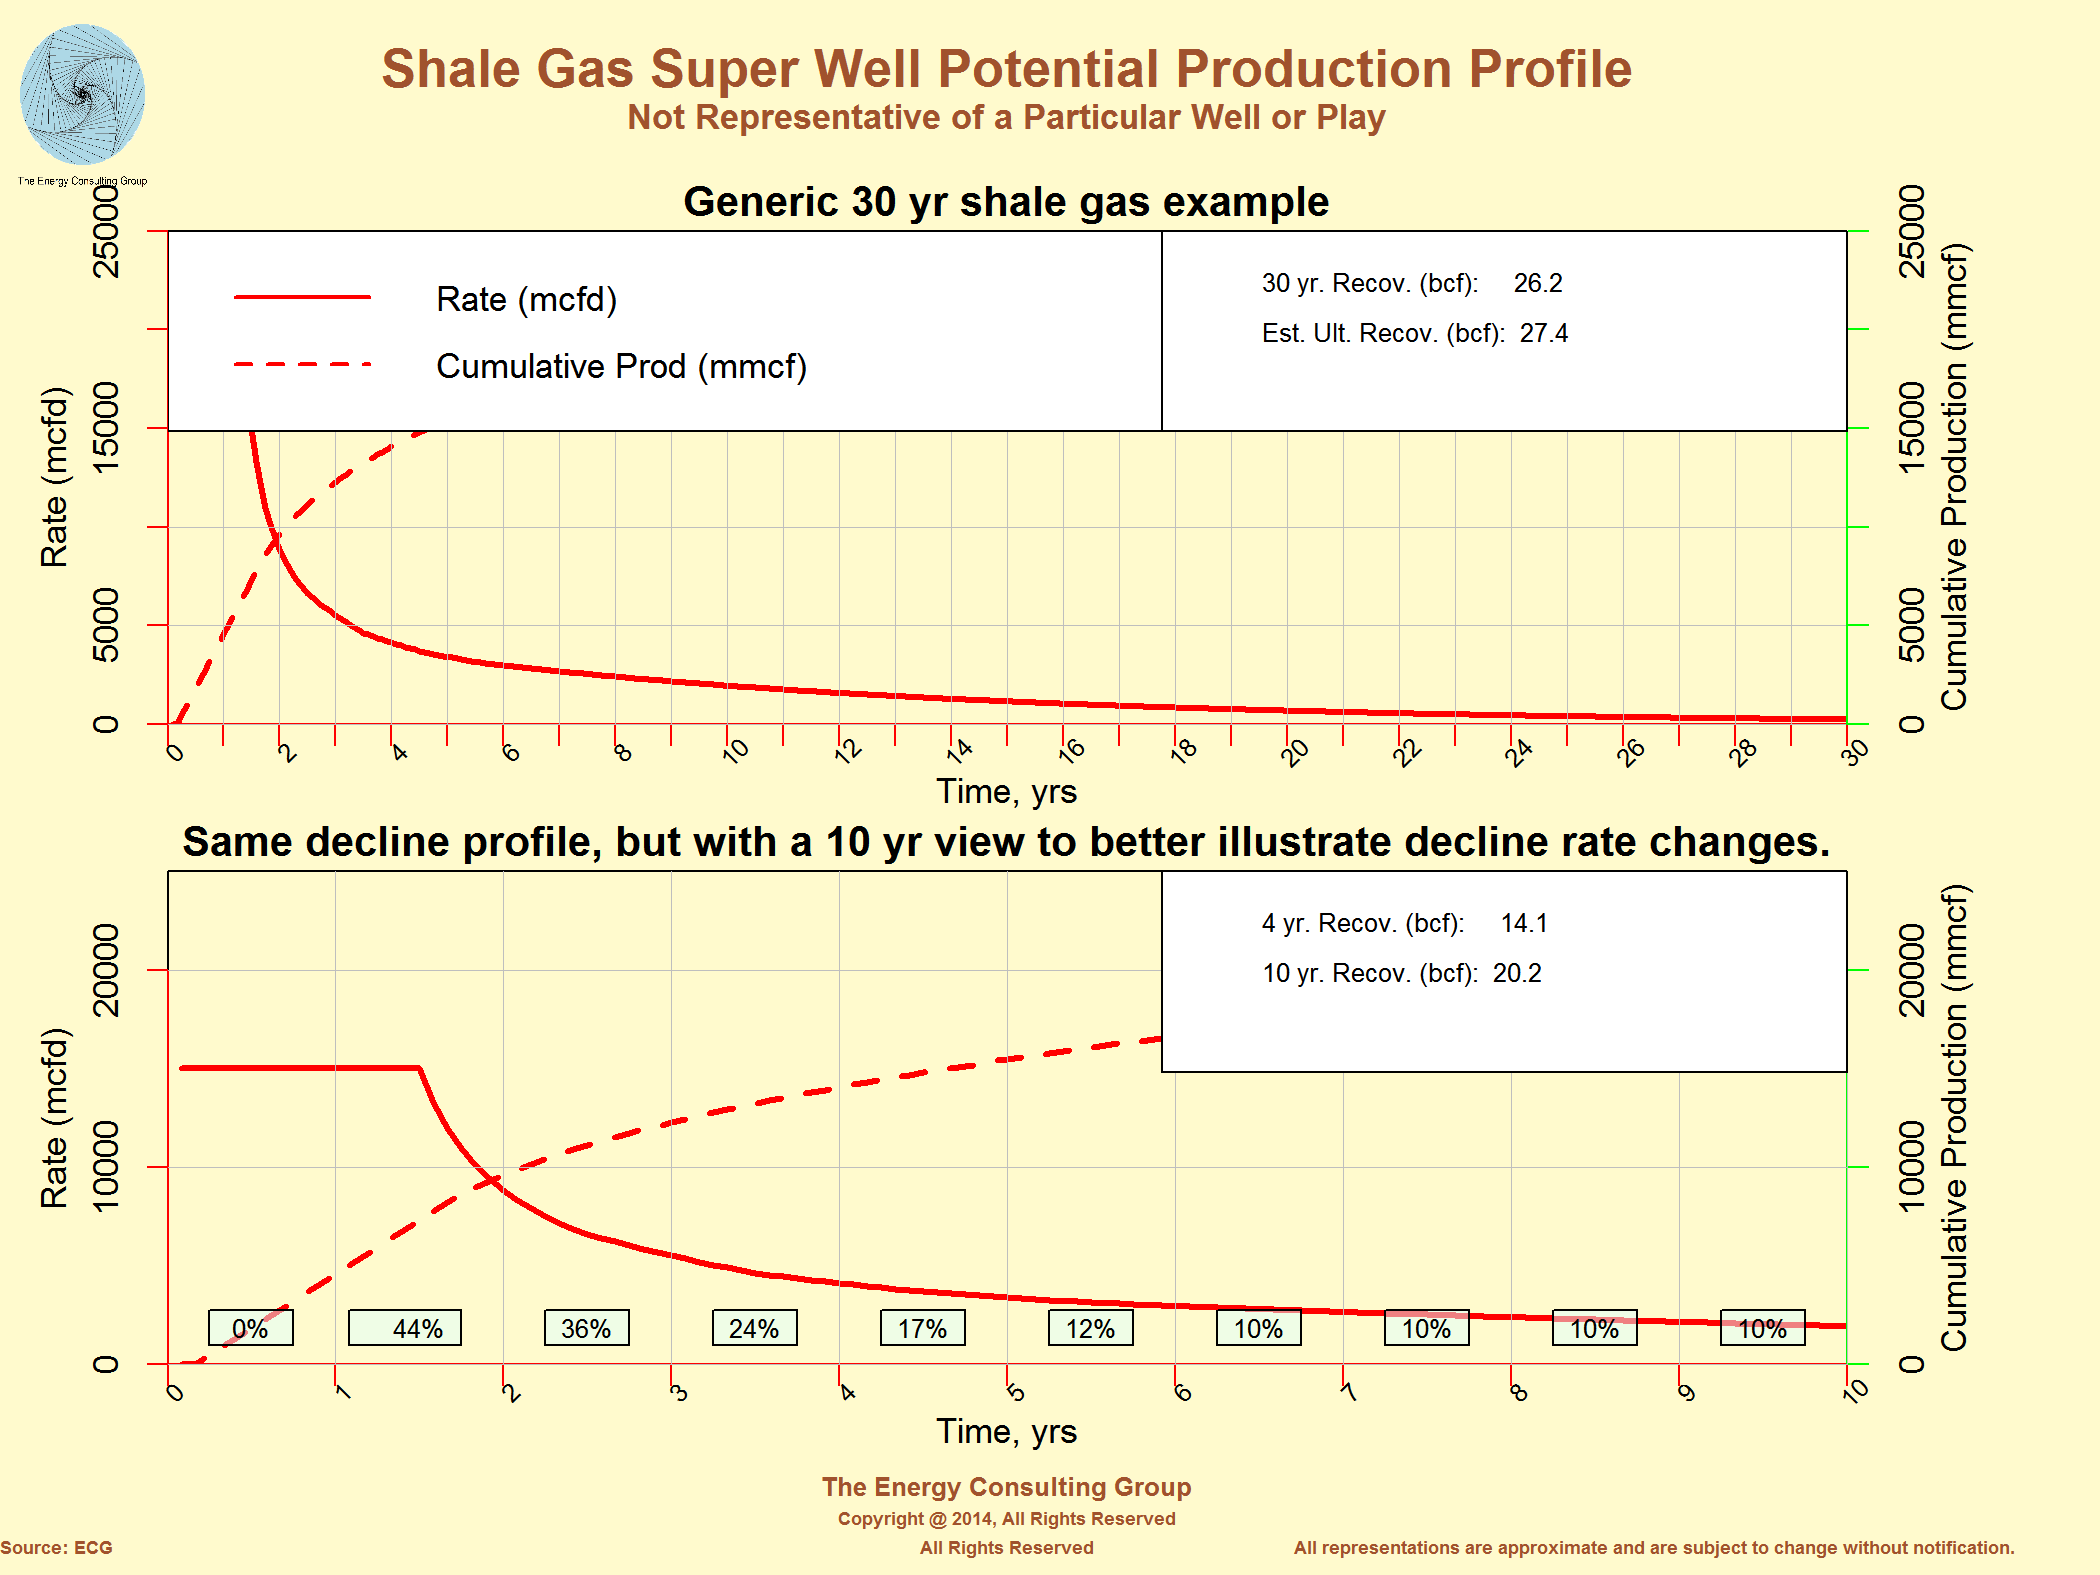 For Larger, Higher Resolution View, Click Image |
As a result of this technological revolution, the North American natural gas supply curve (below), as we calculate it, has been dramatically pushed down, and flattened. The implications are that large volumes of gas can be developed at lower breakeven costs. Meaning the shale revolution is not likely to be a flash in the pan, but rather a force of positive change that has the potential to lower the cost of living for everyone. There is no better example of this than what is happening in the deep, dry Utica in southwest Pennsylvania.
| A North American Natural
Gas Cost of Supply Curve October 2015 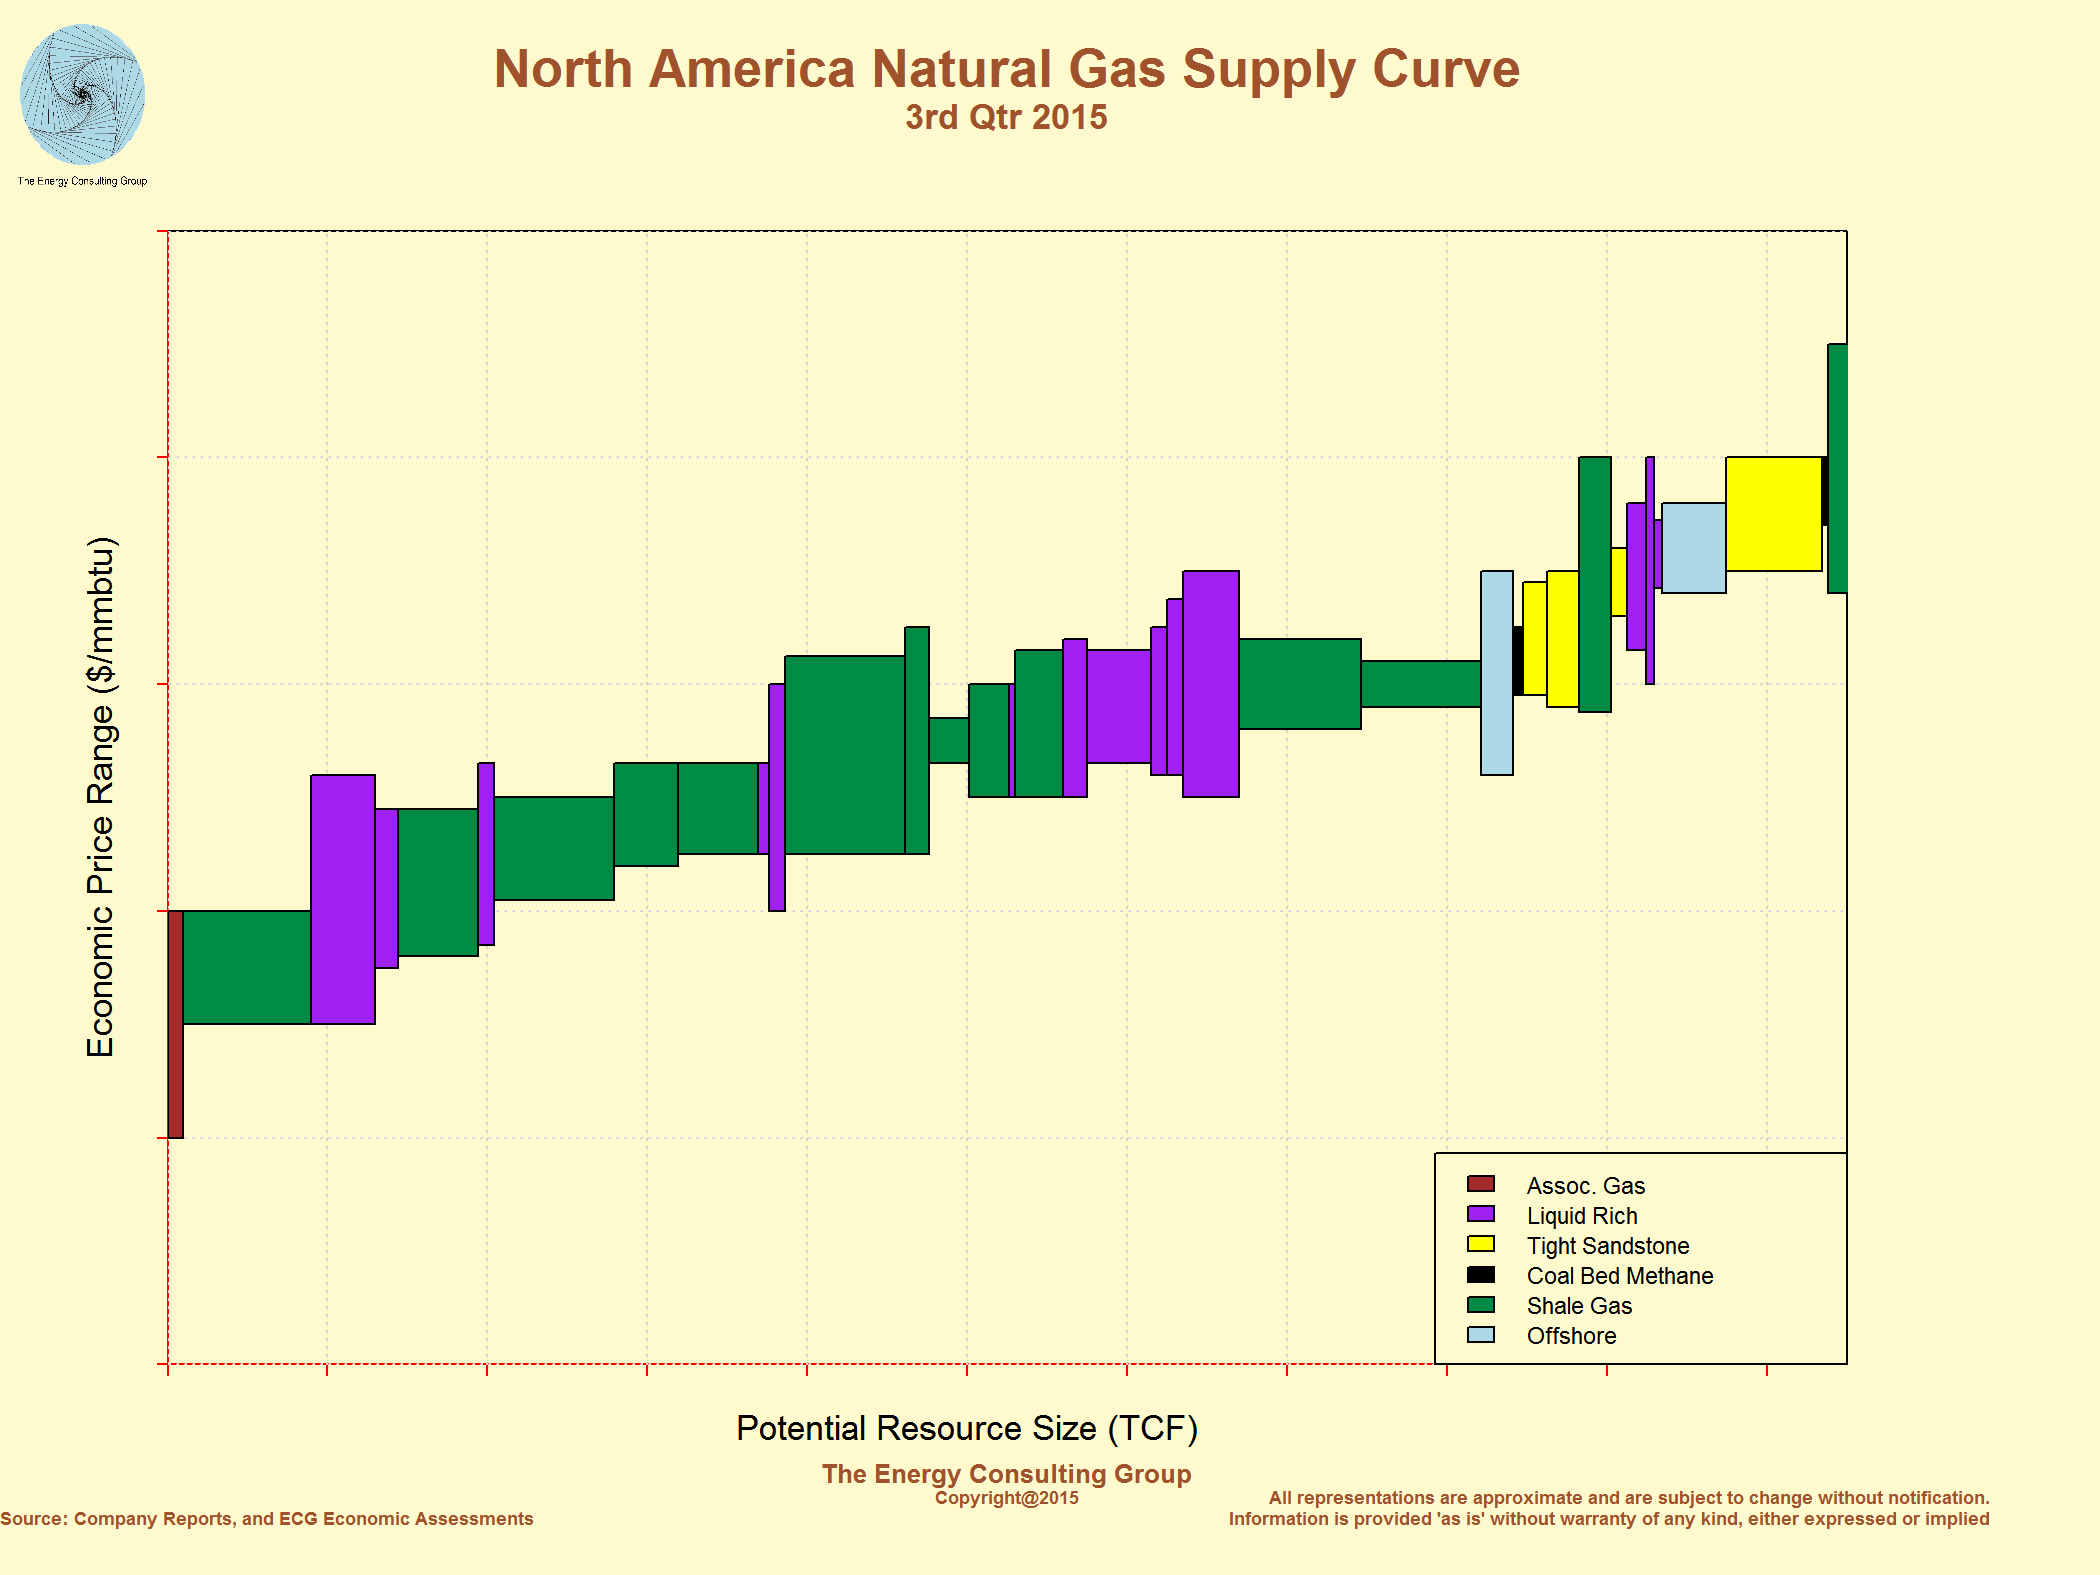 For Larger, Higher Resolution View, Click Image |
Top 40 Natural Gas Companies in the USA by Daily
Output (NGSA) For Larger, Higher Resolution View, Click Image |
Return to Web Page Index at the start of this web page
Go to The Energy Consulting Group home page for more oil and gas related information.
|
|