Click For Larger Image
Click For Larger Image
Click For Larger Image
The Energy Consulting GroupManagement consultants for upstream oil and gas producers and service companies |
|
Our focus is to work with management teams to develop and
implement business strategies that are practical, sustainable and allow
organizations to achieve their full potential. Our consultants have
long histories of working closely with senior executive teams of
firms of all sizes to help their companies not only be successful,
but achieve performance that stands out relative to
peers.
.
Contact us at
insight@energy-cg.com to find out how
we can help you. Alternatively, we can arrange a complementary SKYPE
or ZOOM consultation.
|
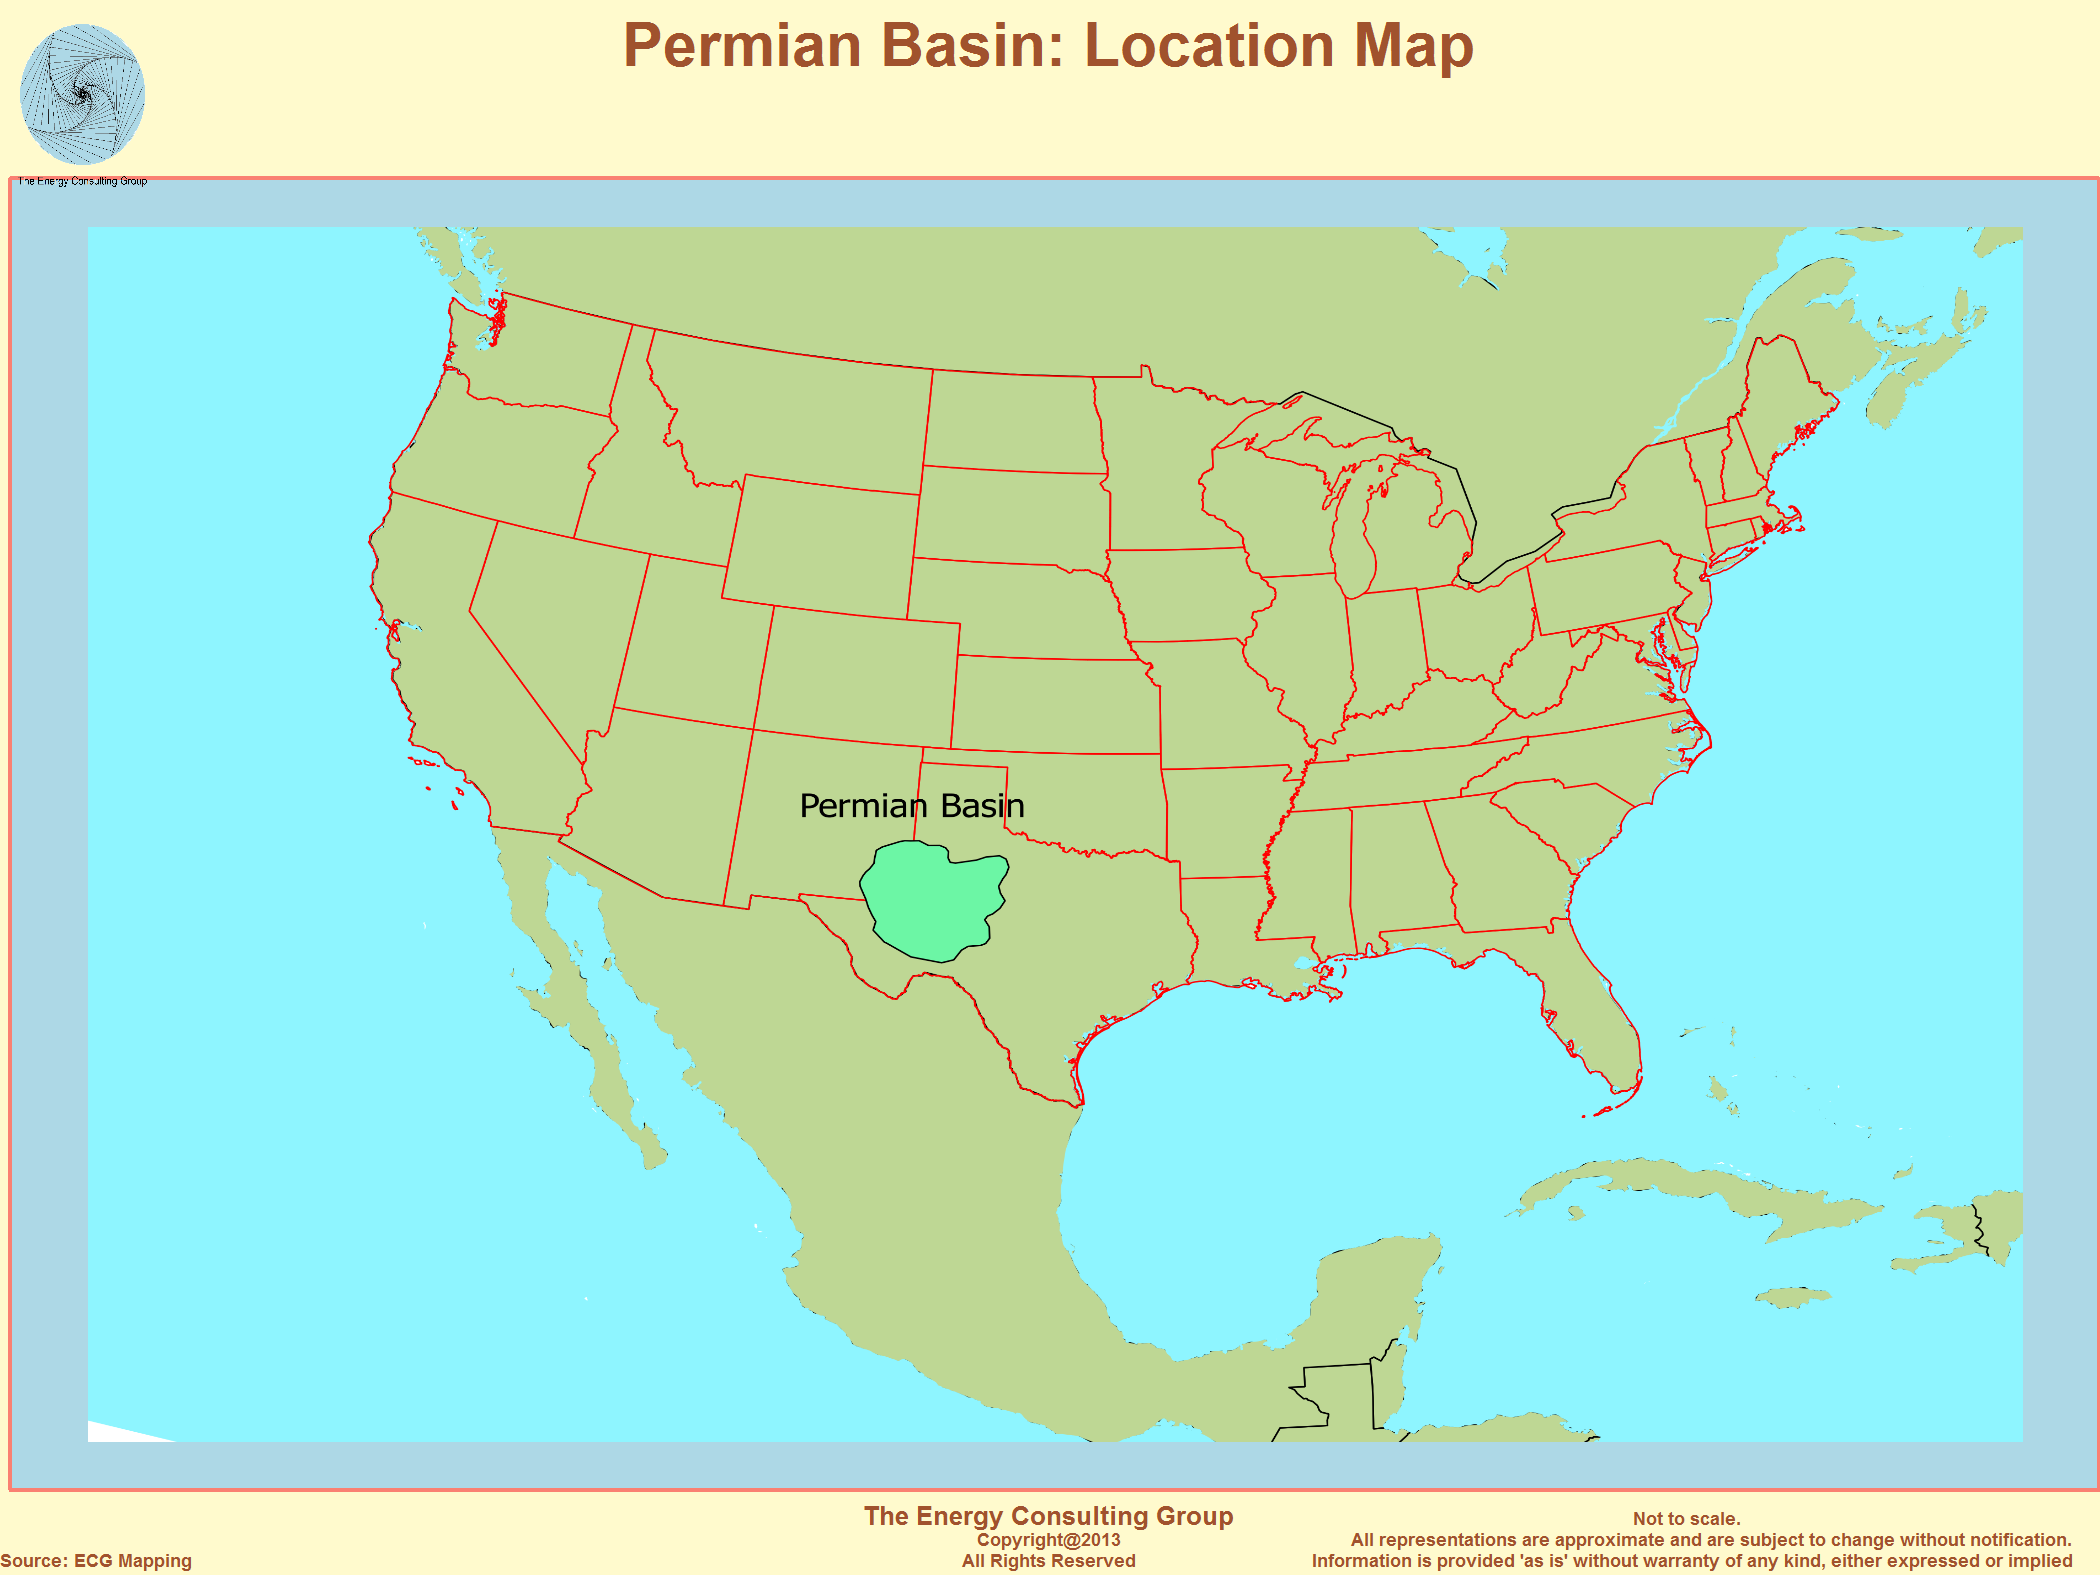
Permian Basin Overview
|
Permian Basin Index Map Click For Larger Image |
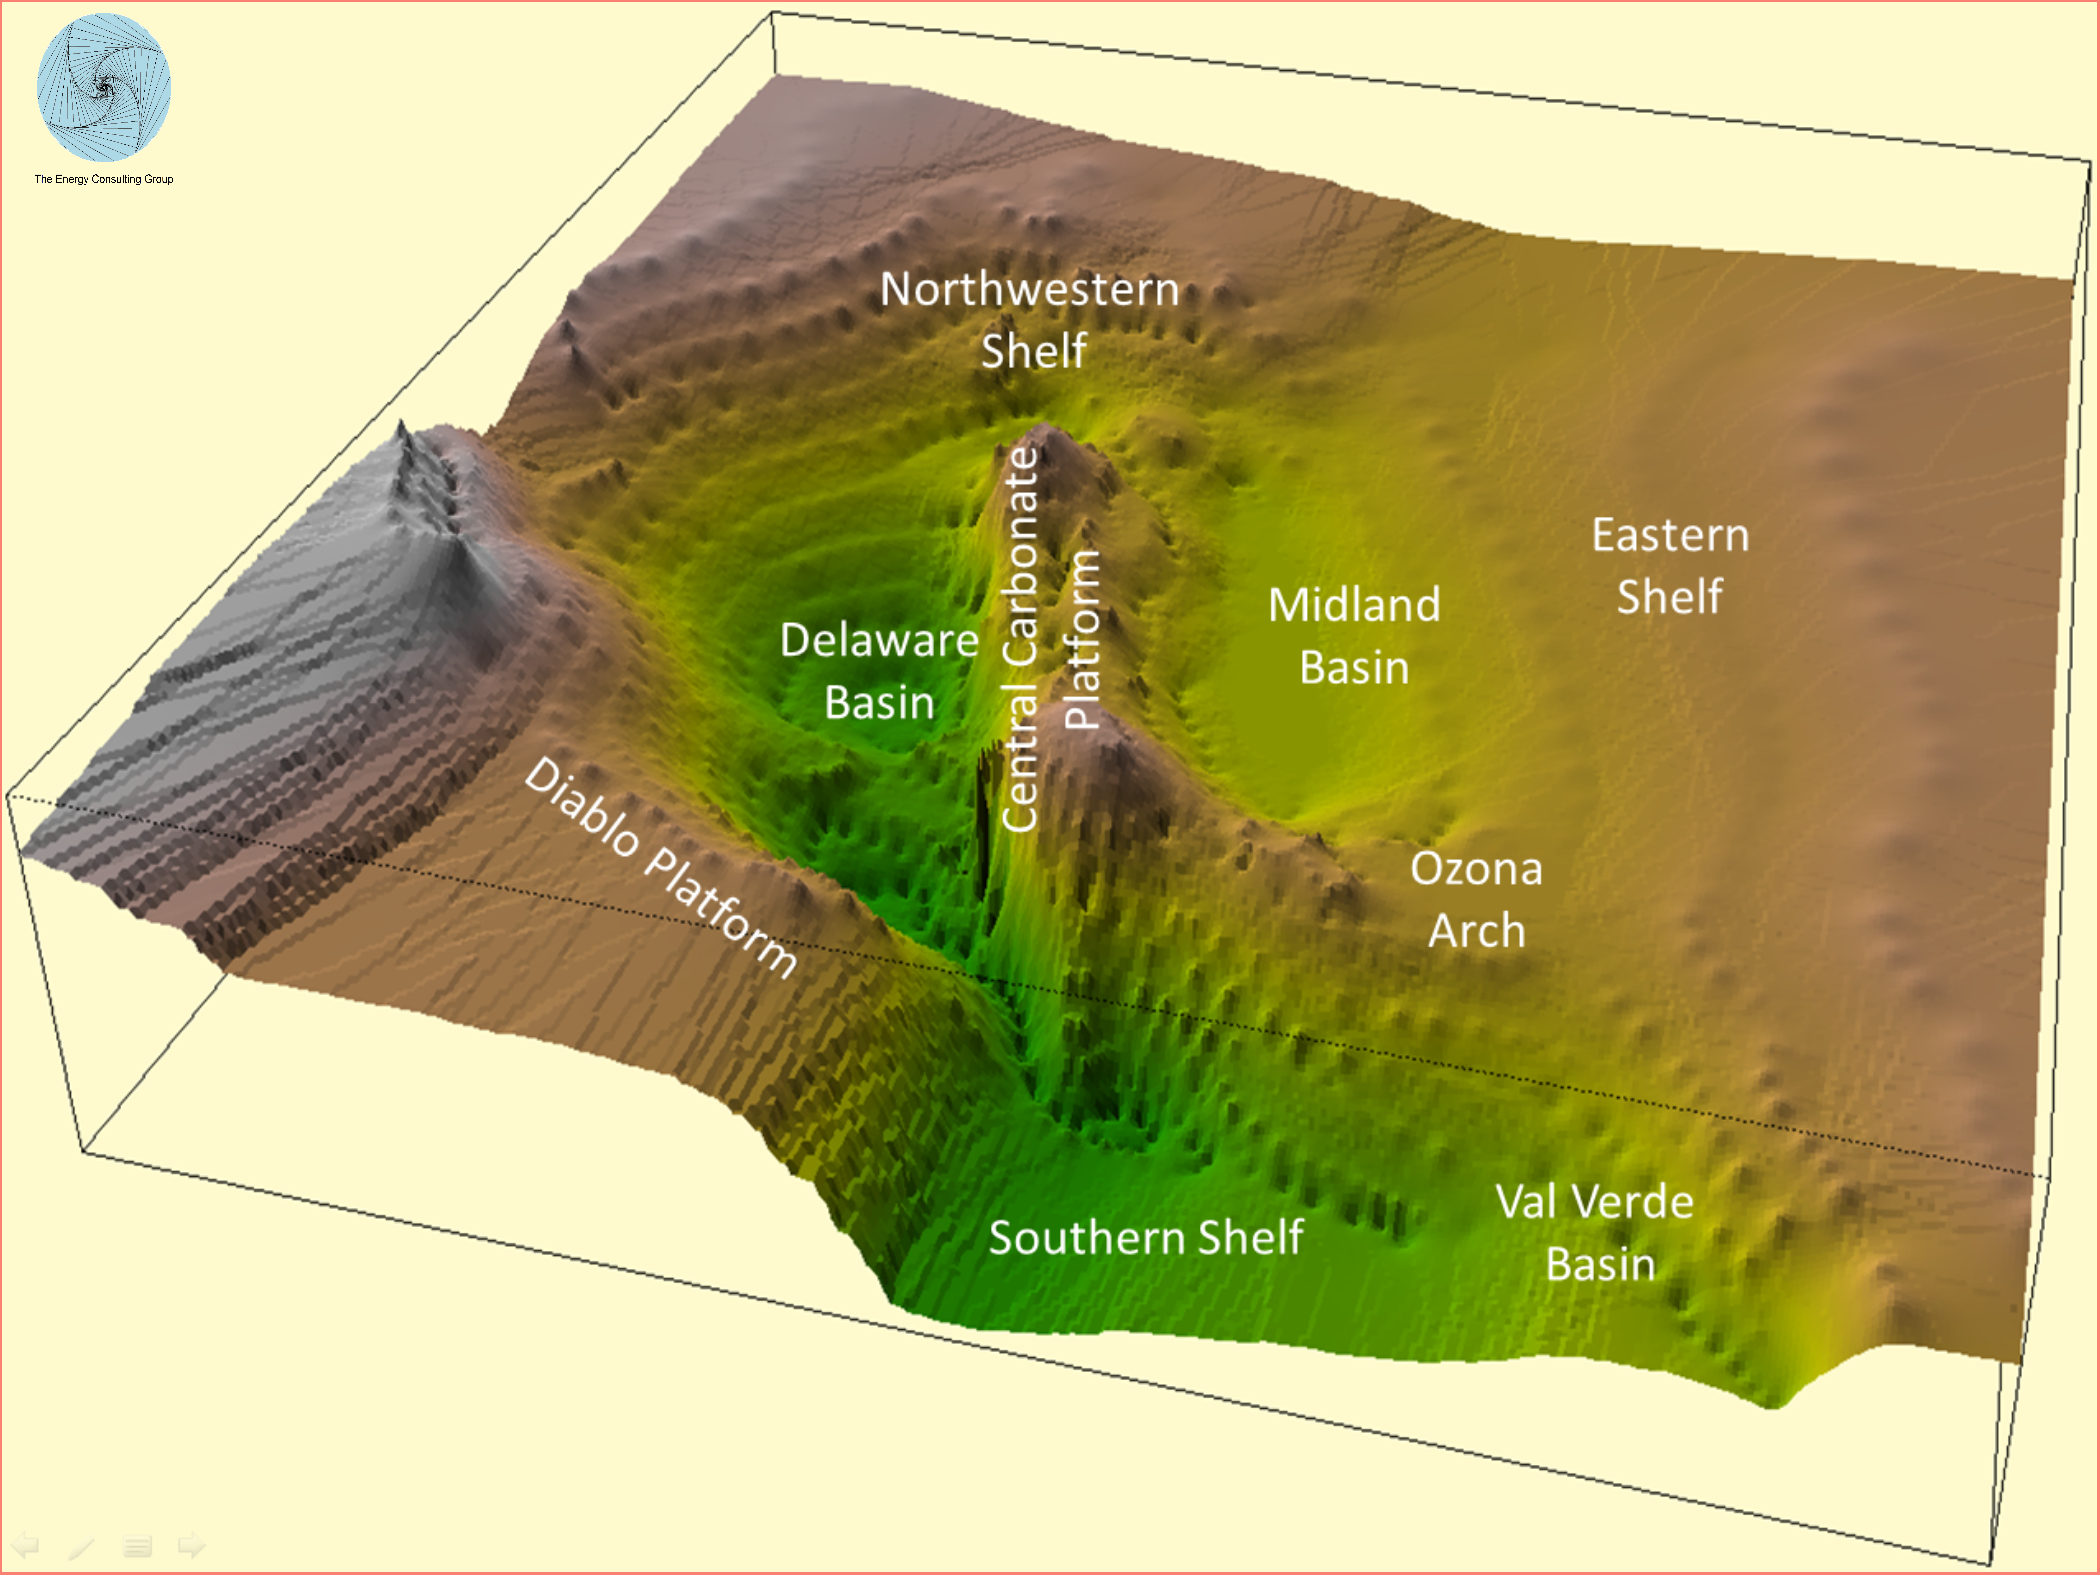
Permian Basin: SubBasins and Geological Features Click For Larger Image |
|
Permian Basin: Deep Structure Map Click For Larger Image |
The map to the left provides a sense of the subsurface relief that underlies many of the names the industry uses for different parts of the Permian Basin. This particular map is a deep structure map, but as is evident in the maps of the nonconventionals Wolfcamp below, much of this relief is conserved at shallower depths. |
 Click For Larger Image |
 Click For Larger Image |
However, despite the impressive volumes of oil remaining to be recovered from these fields, in the last decades of the 20th century Permian oil production was flat to declining. But, operators have successfully developed, tested and applied new technologies to stem and reverse this trend, and are even now taking oil production to new heights. |
 Click For Larger Image |
The growth in natural gas output has been just as impressive. |
Permian Oil, Gas, and NGL Pipelines: Recent, In-Process, and
Potential Click For Larger Image |
Permian Basin: Natural Gas Processing
Infrastructure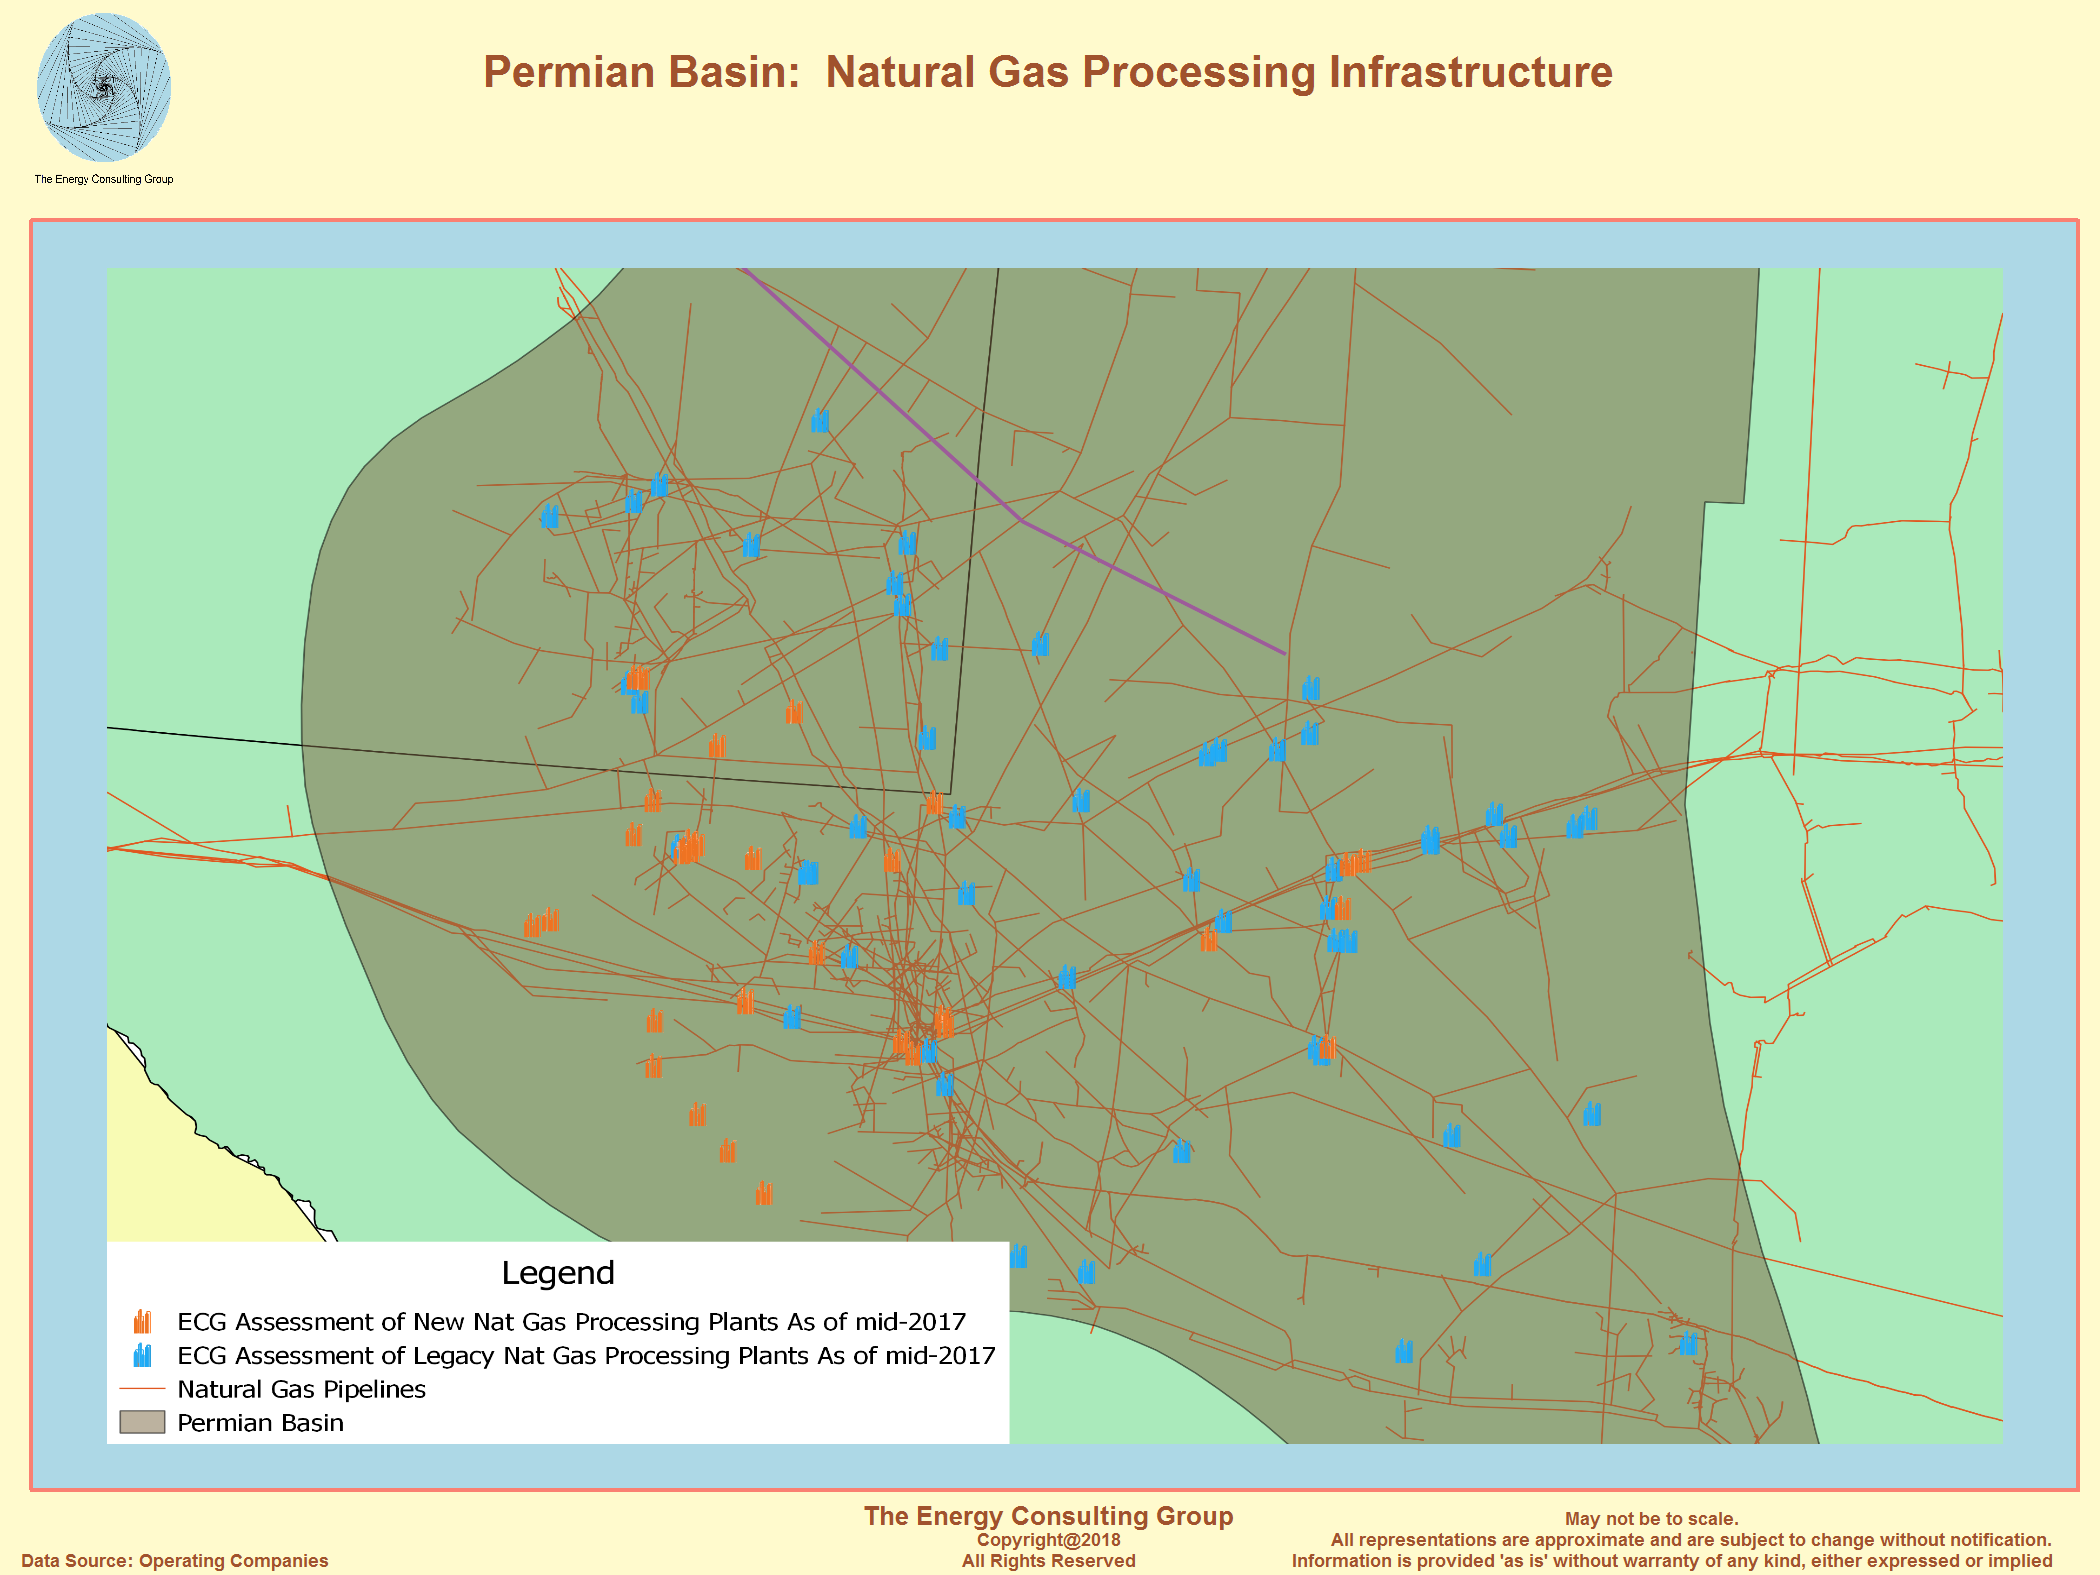 Click For Larger Image |
The rapid, voluminous growth of both oil and gas output has led to a major infrastructure buildout to gather, process and transport the commodities to markets. The markets are primarily on the Gulf coast and increasingly beyond in Europe and Asia. To the left is a map showing the various pipelines that have either been recently put in service, are being constructed, or are being proposed.
The two sets of defining technologies most responsible for returning fortune to the Basin are horizontal drilling/multistage fracing and CO2 EOR. The application of these two technological advances has not only halted the long term decline in oil production, but led to the dramatic oil production increase apparent in the previous chart.
Delaware Basin: USGS Light, Tight Oil
Resource Potential Click For Larger Image |
Midland Basin: USGS Light, Tight Oil
Resource Potential Click For Larger Image |
If the Permian Basin were a standalone county,
it's nonconventional oil resources would place it eighth in the world in
terms of its oil potntial. Click For Larger Image |
If the Permian Basin were a standalone county,
it's nonconventional gas resources would place it sixth in the world in
terms of its gas potential. Click For Larger Image |
Delaware Basin: Potential Well Stack Around State Line Click For Larger Image |
Click here for full size version of the above 3D graphic. |
As mentioned previously, the Wolfcamp is currently the main nonconventionals target in the Permian. To provide a sense as to the nature of the formation, we developed a 3D map of the Wolfcamp structure, shown here.
Permian Basin:3D Wolfcamp Structure Map Relative to Reported Rig
Activity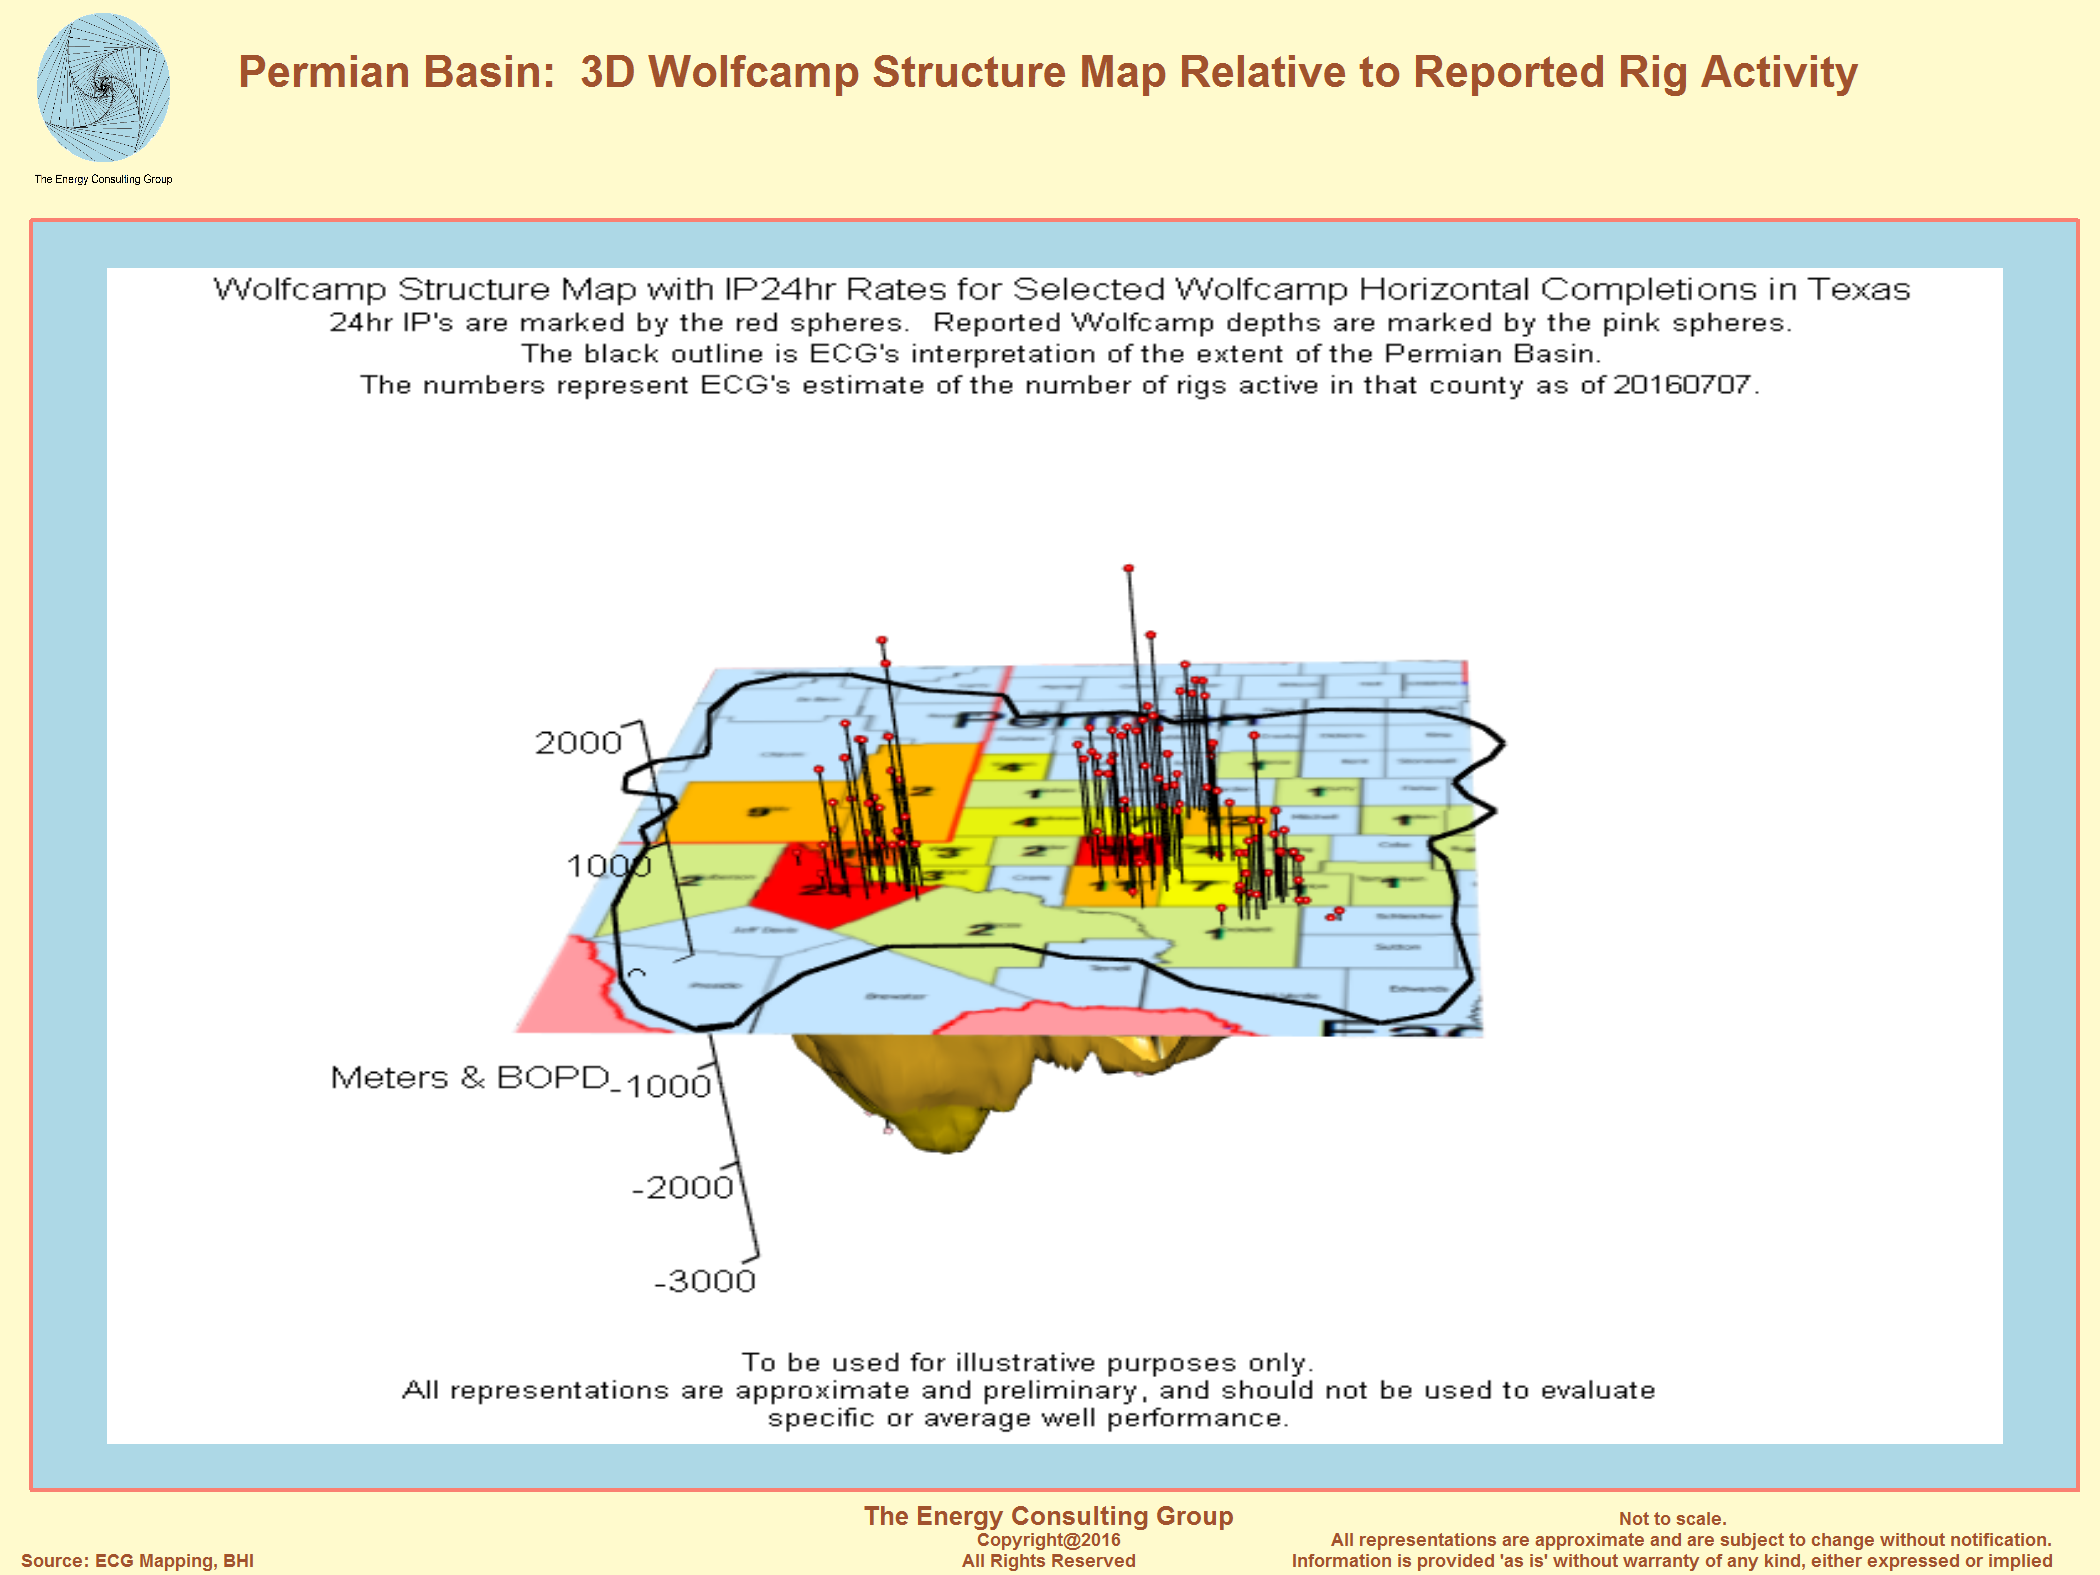 |
Click here for full size version of the above 3D graphic |
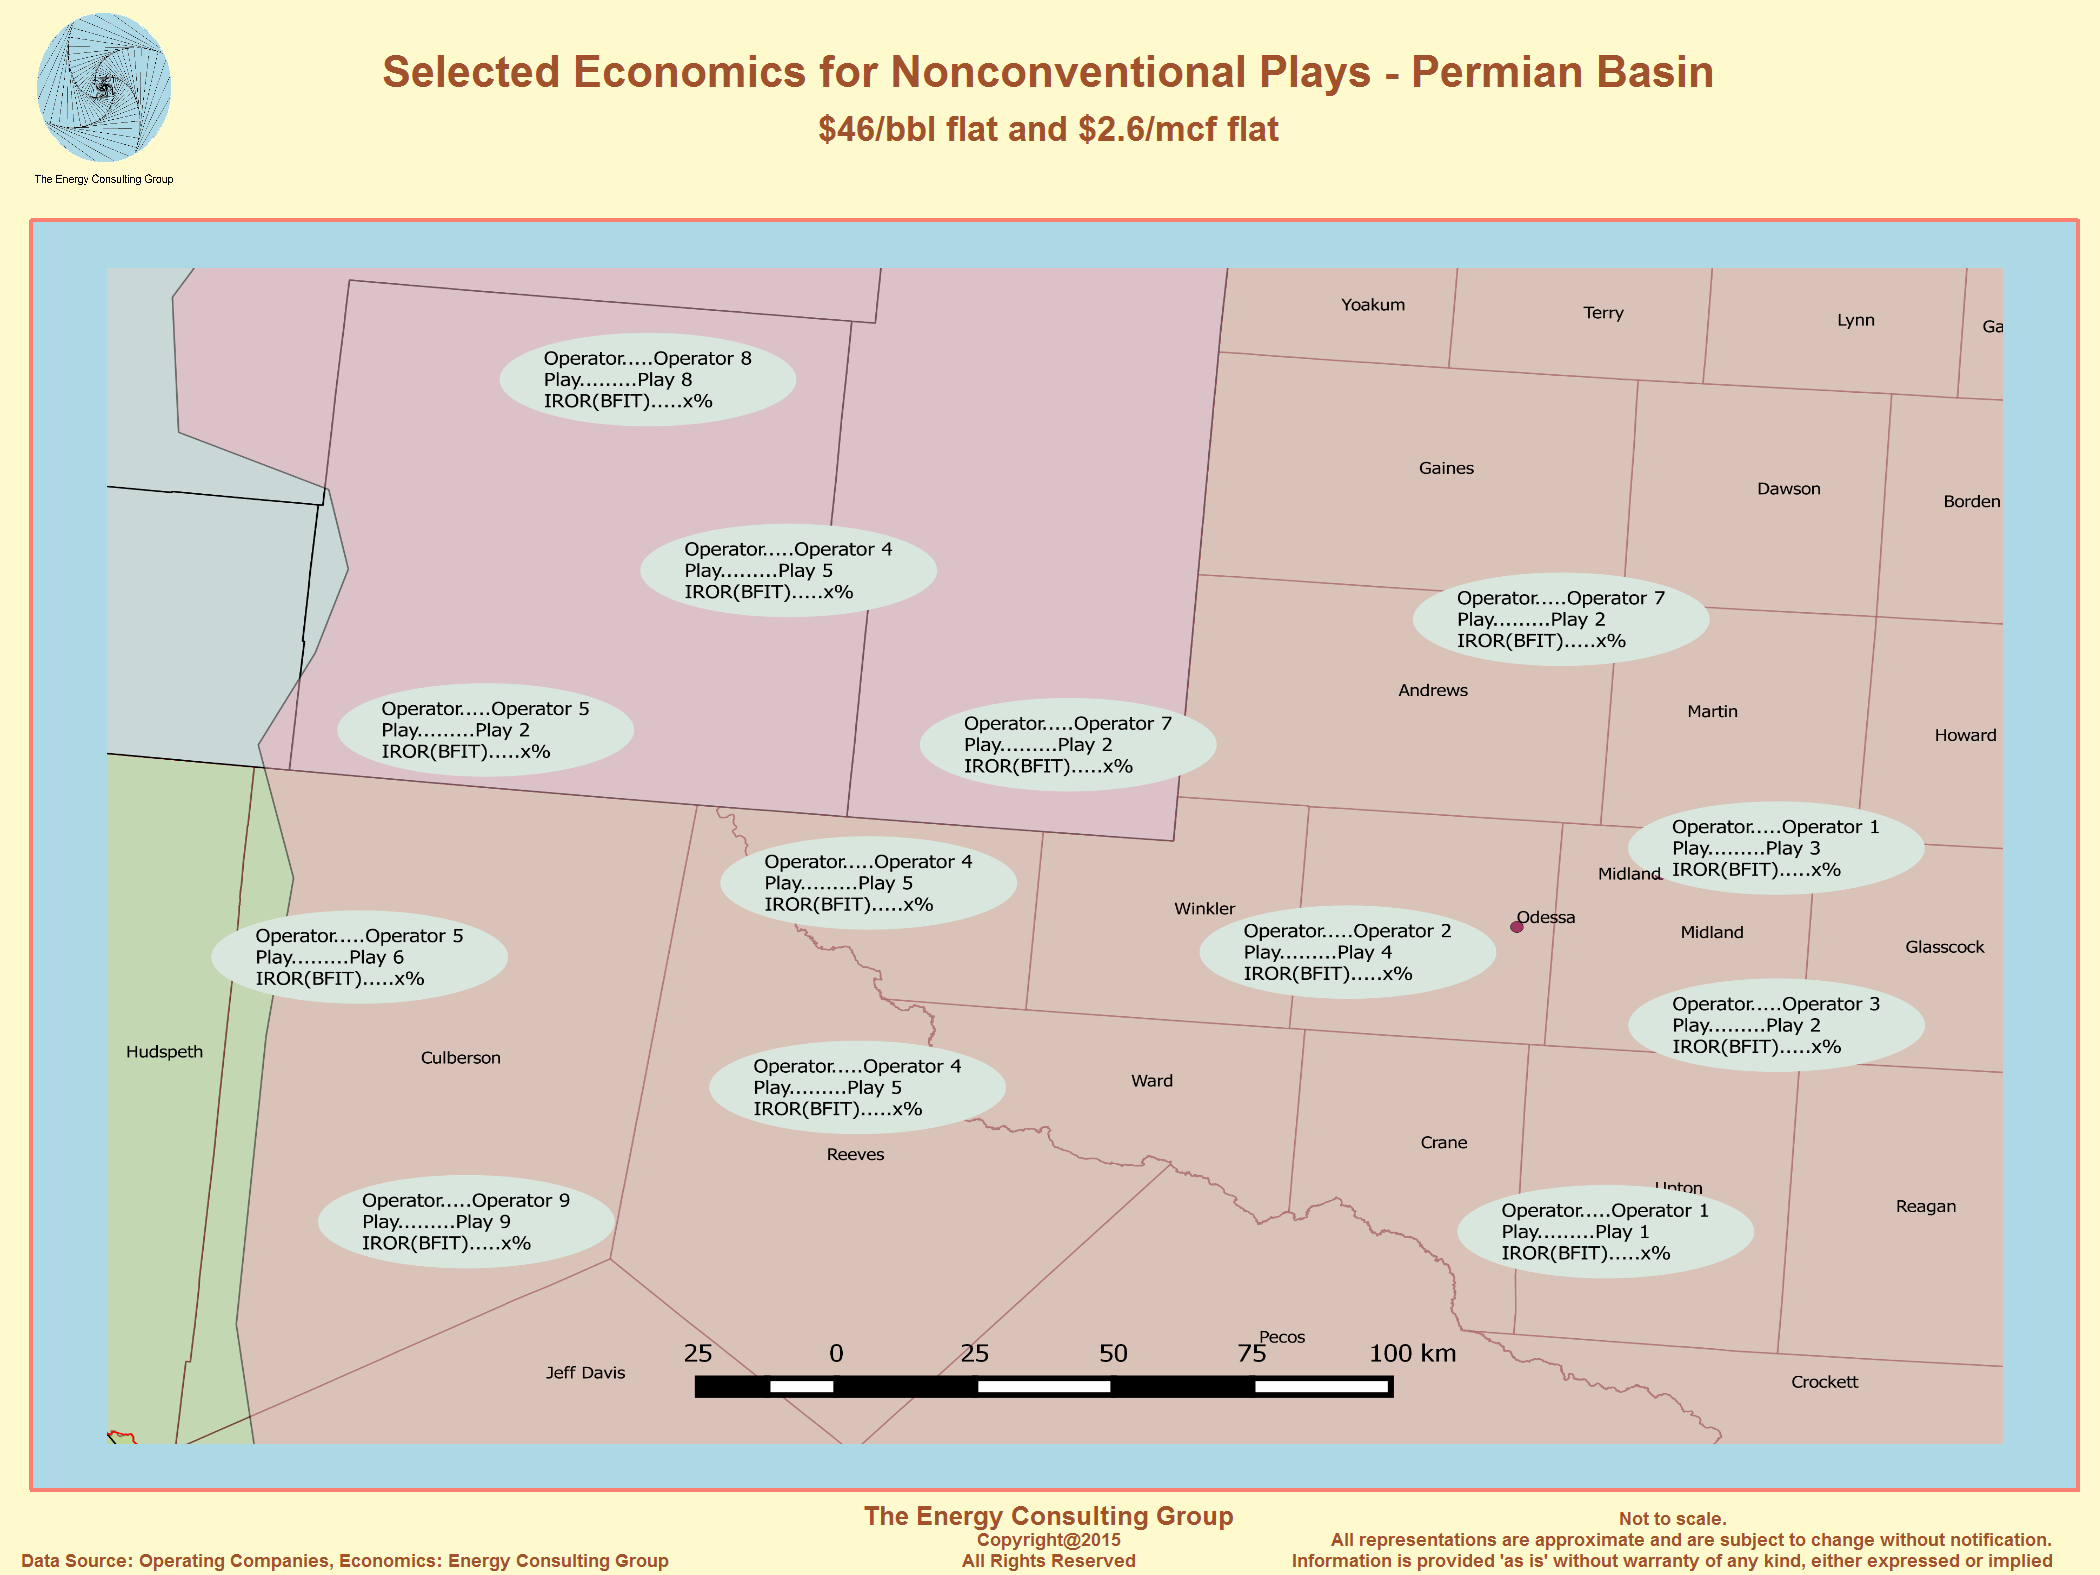 To
the left is an example of our economic comparison map. The well level
economics reflect well performance (IP's, decline curves and EUR) as
communicated by individual companies for different plays, which we analyzed
using EVAL, our proprietary economic analysis program. We have over 500 such
assessements for the Permian oil nonconventionals, starting in 2010, which provides detailed insights on not only the
economic performance of the nonconventional plays in the Permian Basin, but
also allow us to investigate questions regarding rig and well productivity
growth, impact of changes in technology, how much oil the basin is likely to
produce at different oil prices, and which firms are best positioned to exploint
the nonconventionals. And, yes, we do realize that many of the answers in
the map have been removed. If interested in the map with all the blanks
filled in please contact us at insight@energy-cg.com.
To
the left is an example of our economic comparison map. The well level
economics reflect well performance (IP's, decline curves and EUR) as
communicated by individual companies for different plays, which we analyzed
using EVAL, our proprietary economic analysis program. We have over 500 such
assessements for the Permian oil nonconventionals, starting in 2010, which provides detailed insights on not only the
economic performance of the nonconventional plays in the Permian Basin, but
also allow us to investigate questions regarding rig and well productivity
growth, impact of changes in technology, how much oil the basin is likely to
produce at different oil prices, and which firms are best positioned to exploint
the nonconventionals. And, yes, we do realize that many of the answers in
the map have been removed. If interested in the map with all the blanks
filled in please contact us at insight@energy-cg.com.CO2 EOR: Permian Basin Overview
Selected USA CO2 EOR Regions Click For Larger Image |
Permian
CO2 EOR Overview >Click For Larger Image |
CO2 EOR Oil Production for the Permian Basin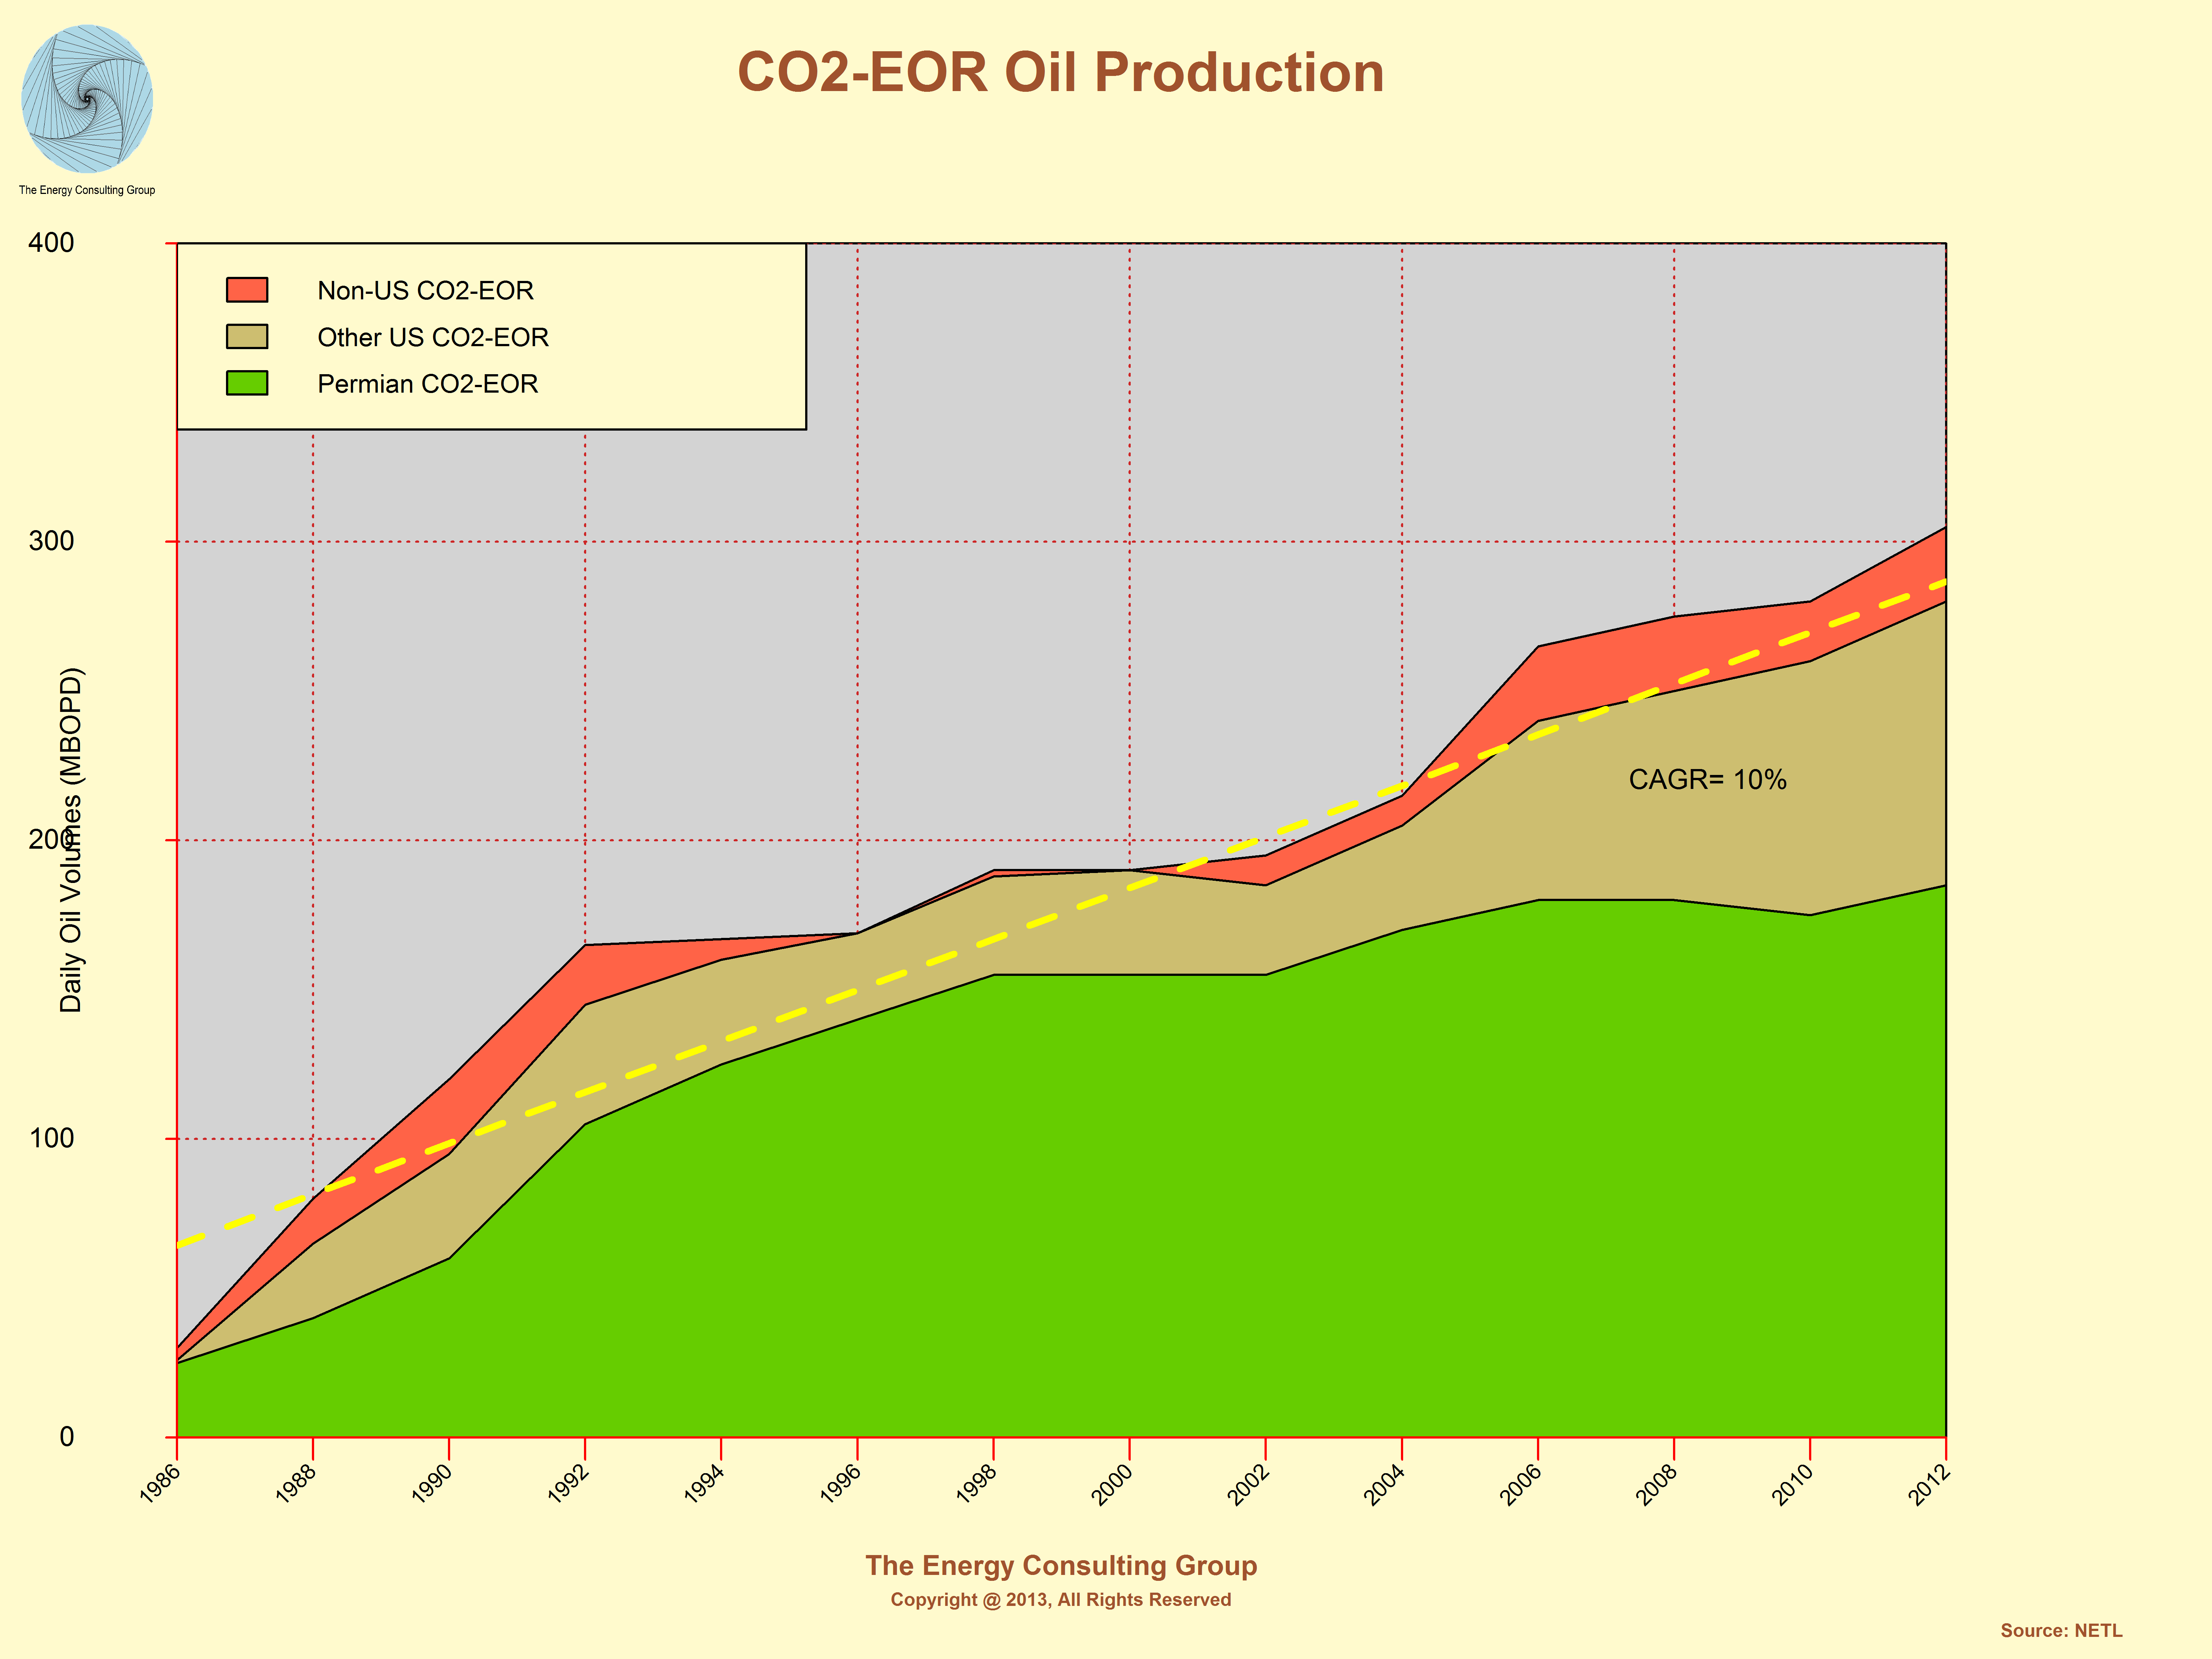 Click For Larger Image |
Permian Basin Drilling Activity Overview
Approx. Reported Permian Basin Horizontal Rig
Activity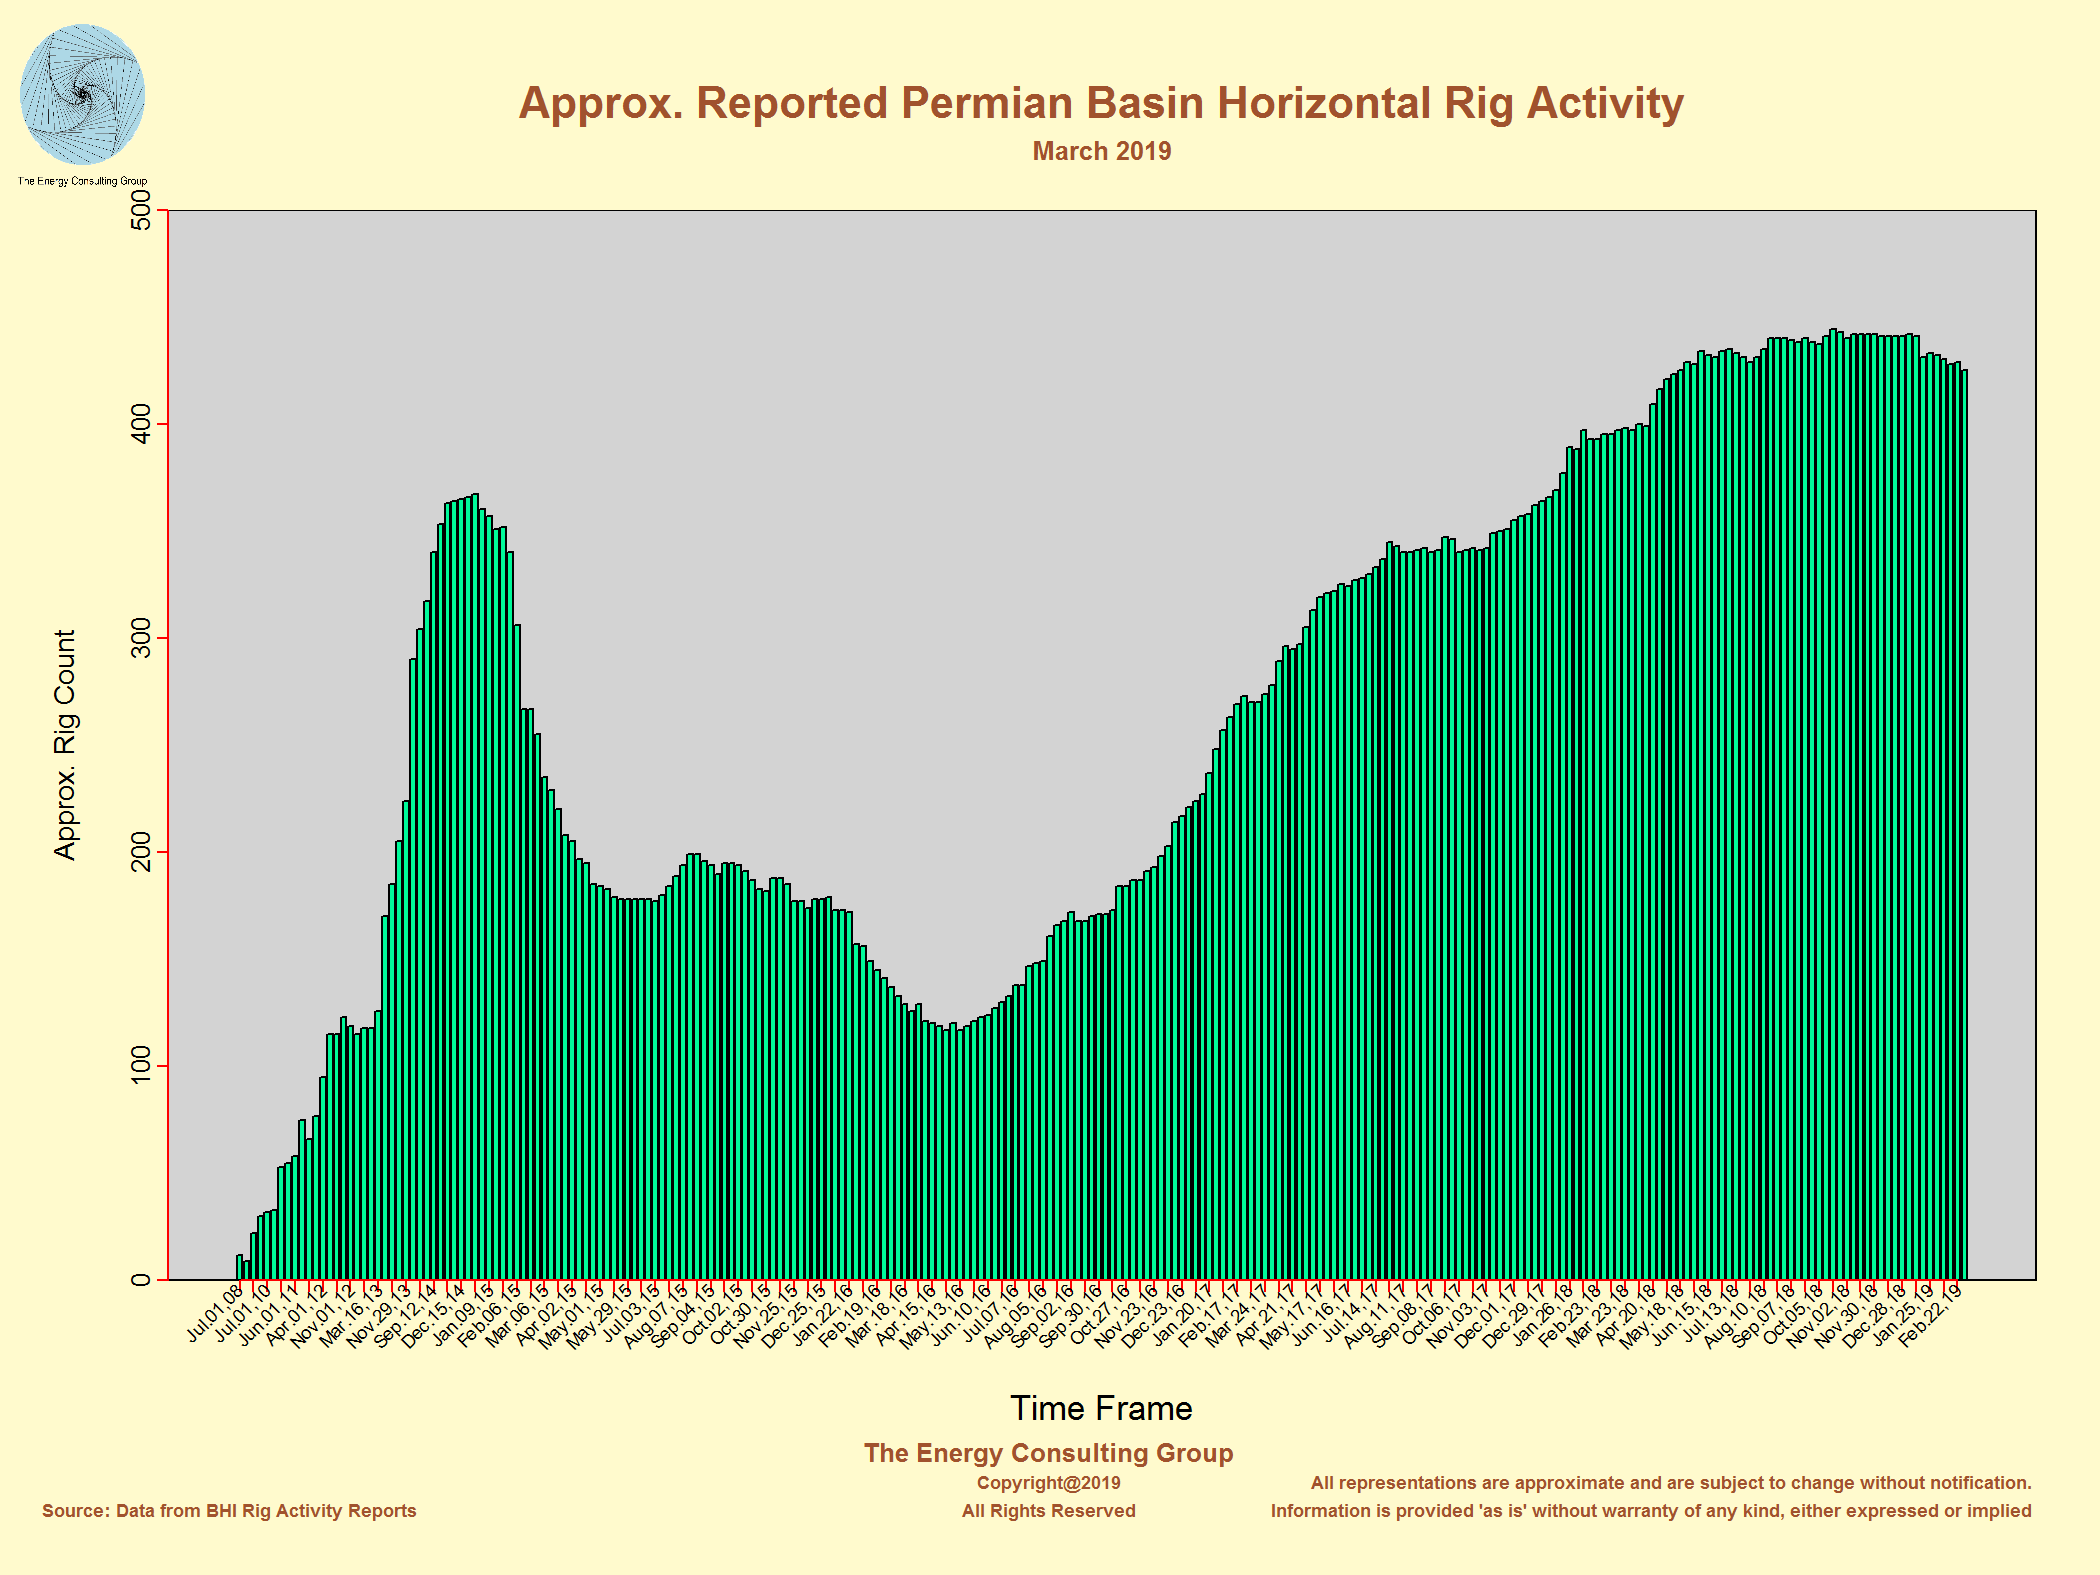 Click For Larger Image |
Approimate Horizontal Rig Count for Several Significant Tight Oil Play
Areas Click For Larger Image |
Drilling Rig Activity In the Permian in March 2019 Click For Larger Image |
US Onshore Drilling Activity Heat Map (March 2019)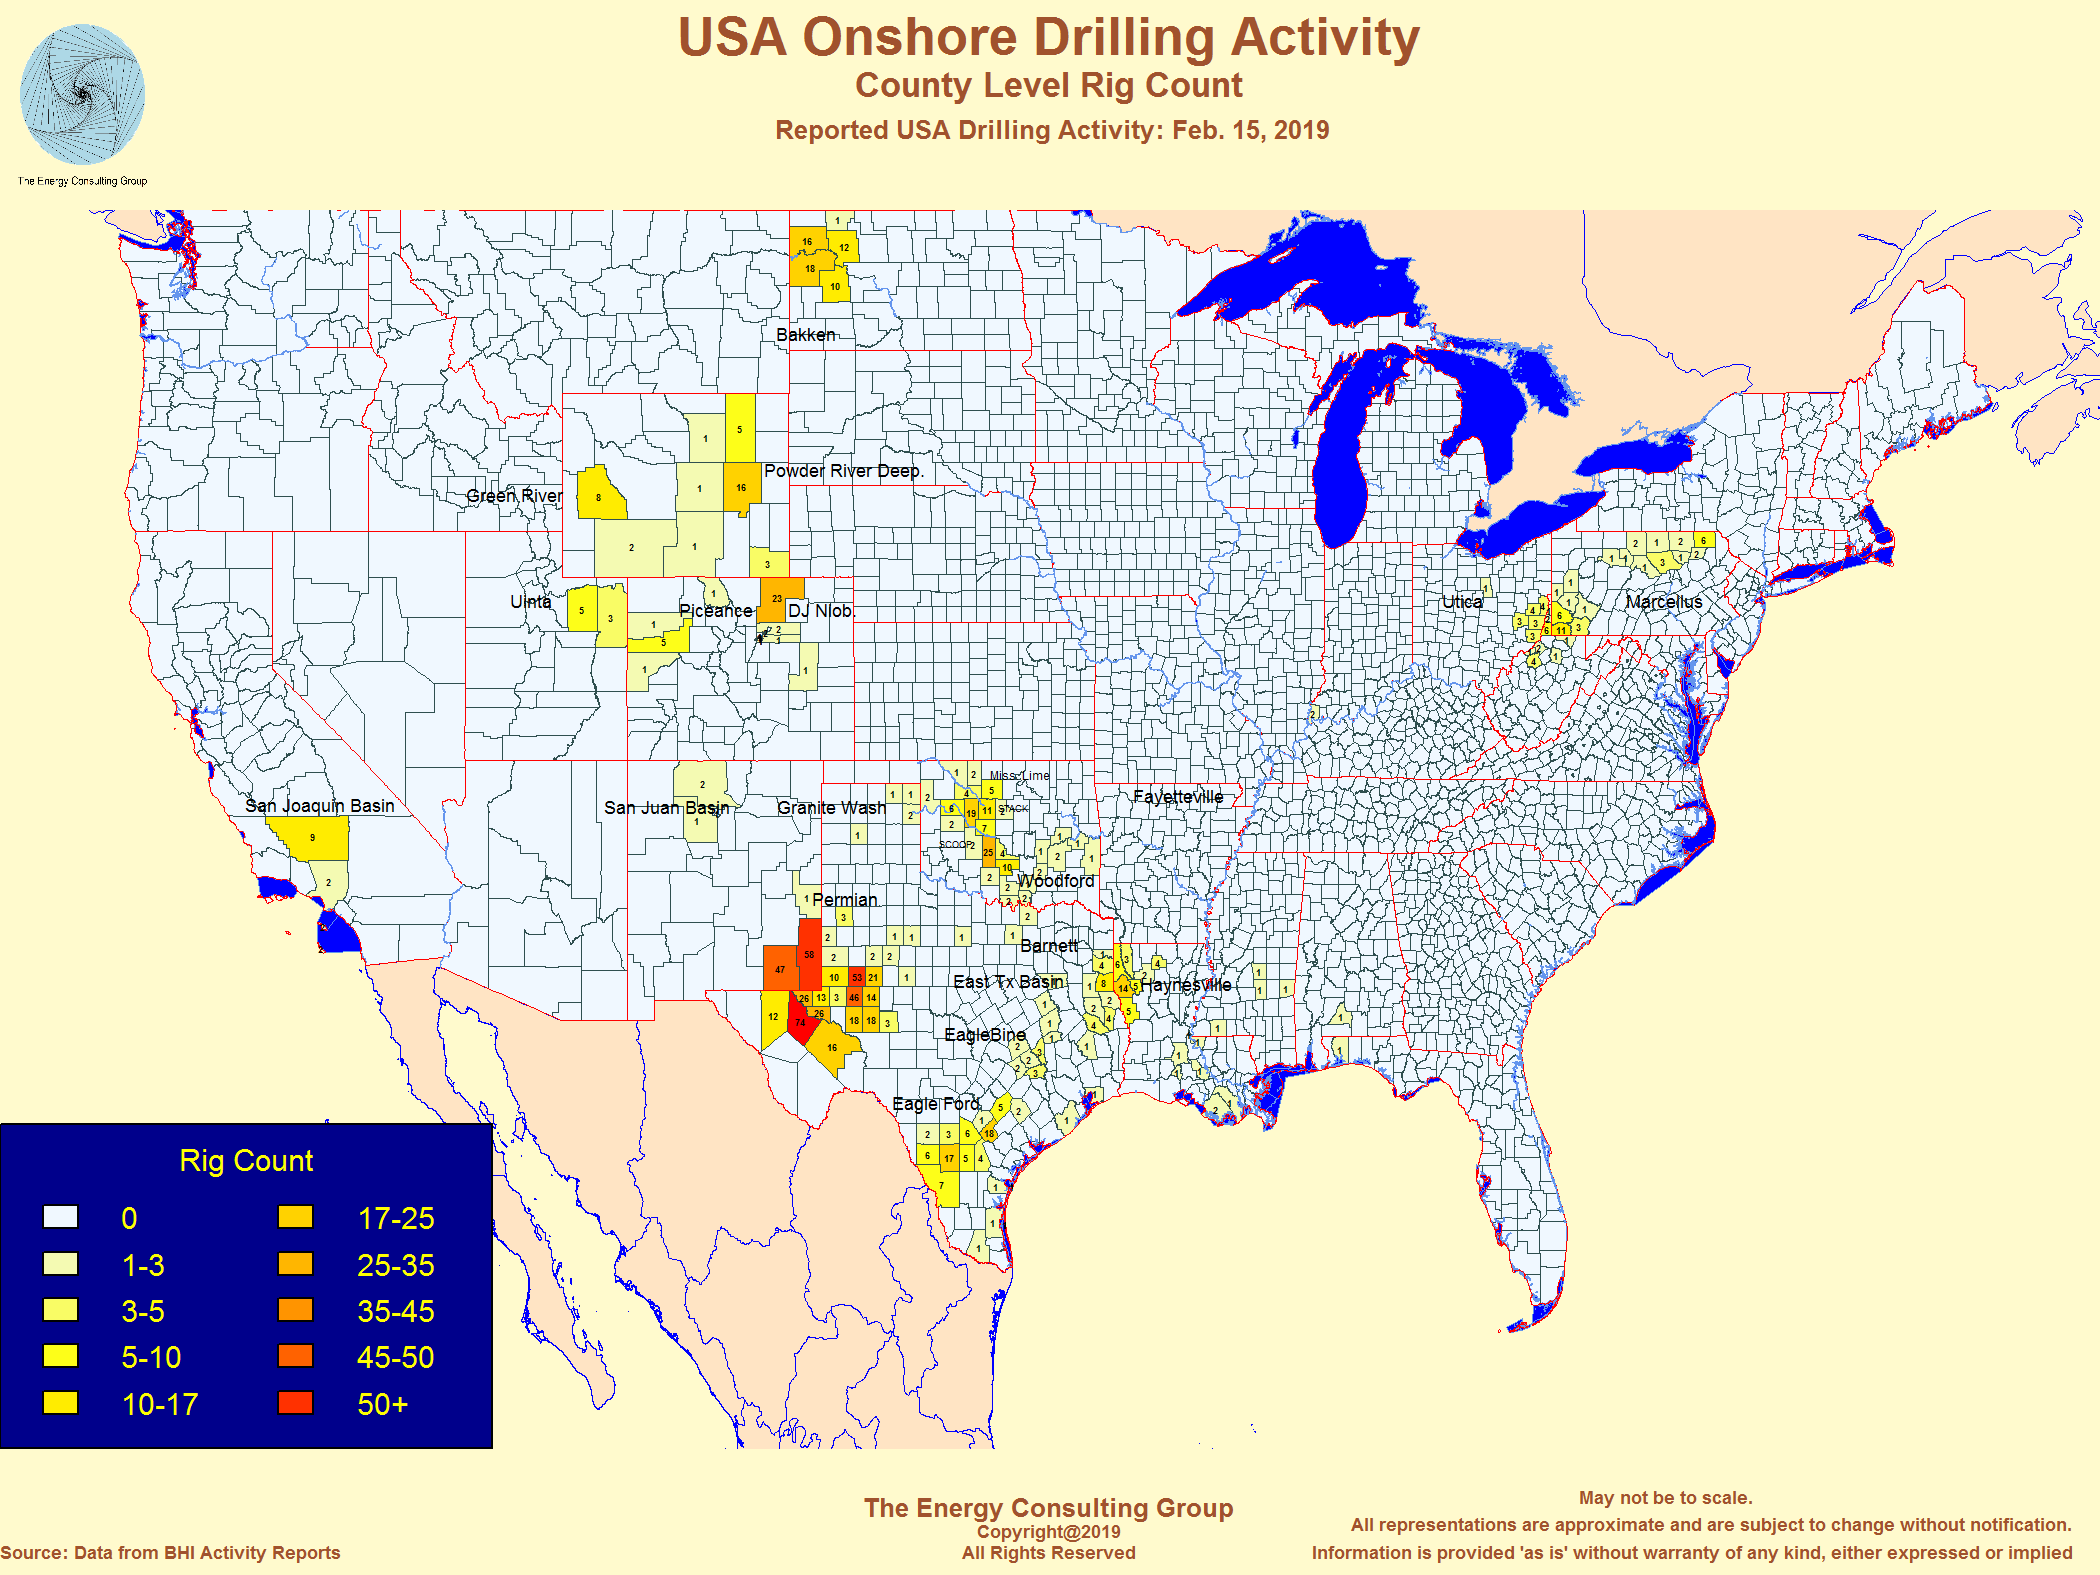 Click For Larger Image |
 Click For Larger Image |
Acreage Positions As Reported By Operating Companies (The Energy Consulting Group makes no representation as to accuracy)
Diamondback: Reported Permian Acreage Position as of
early-2019 Click For Larger Image |
Occidental: Reported Permian Acreage Position as of early 2017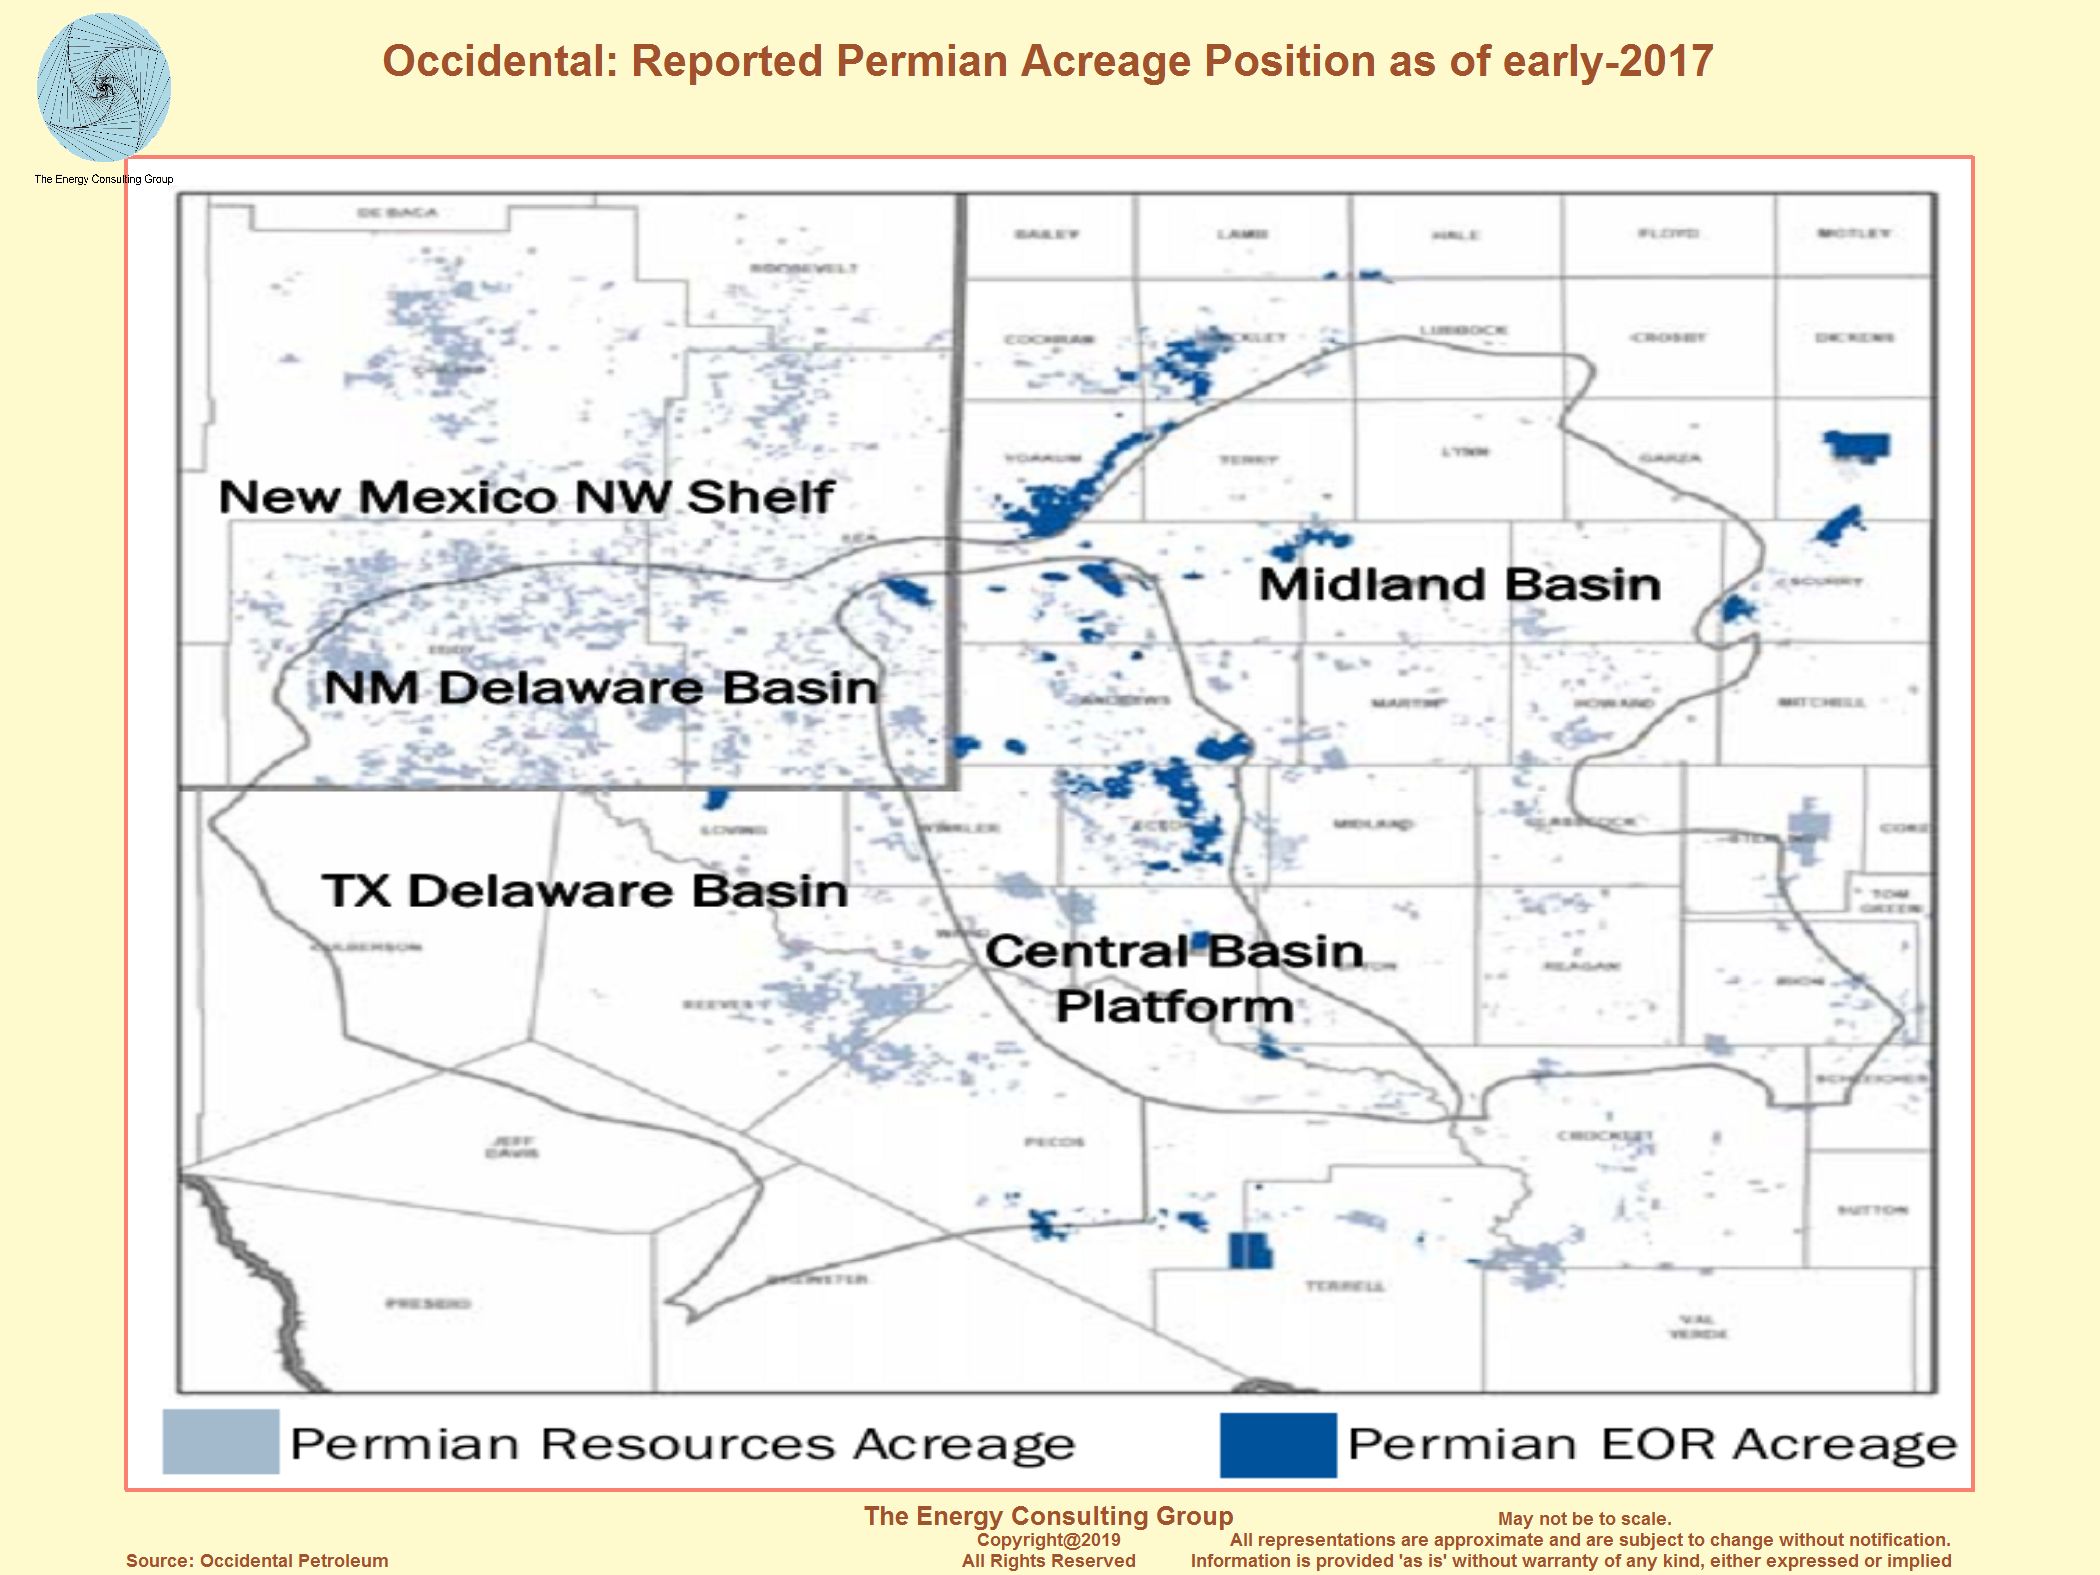 Click For Larger Image |
Apache: Reported Permian Acreage Position as of late 2016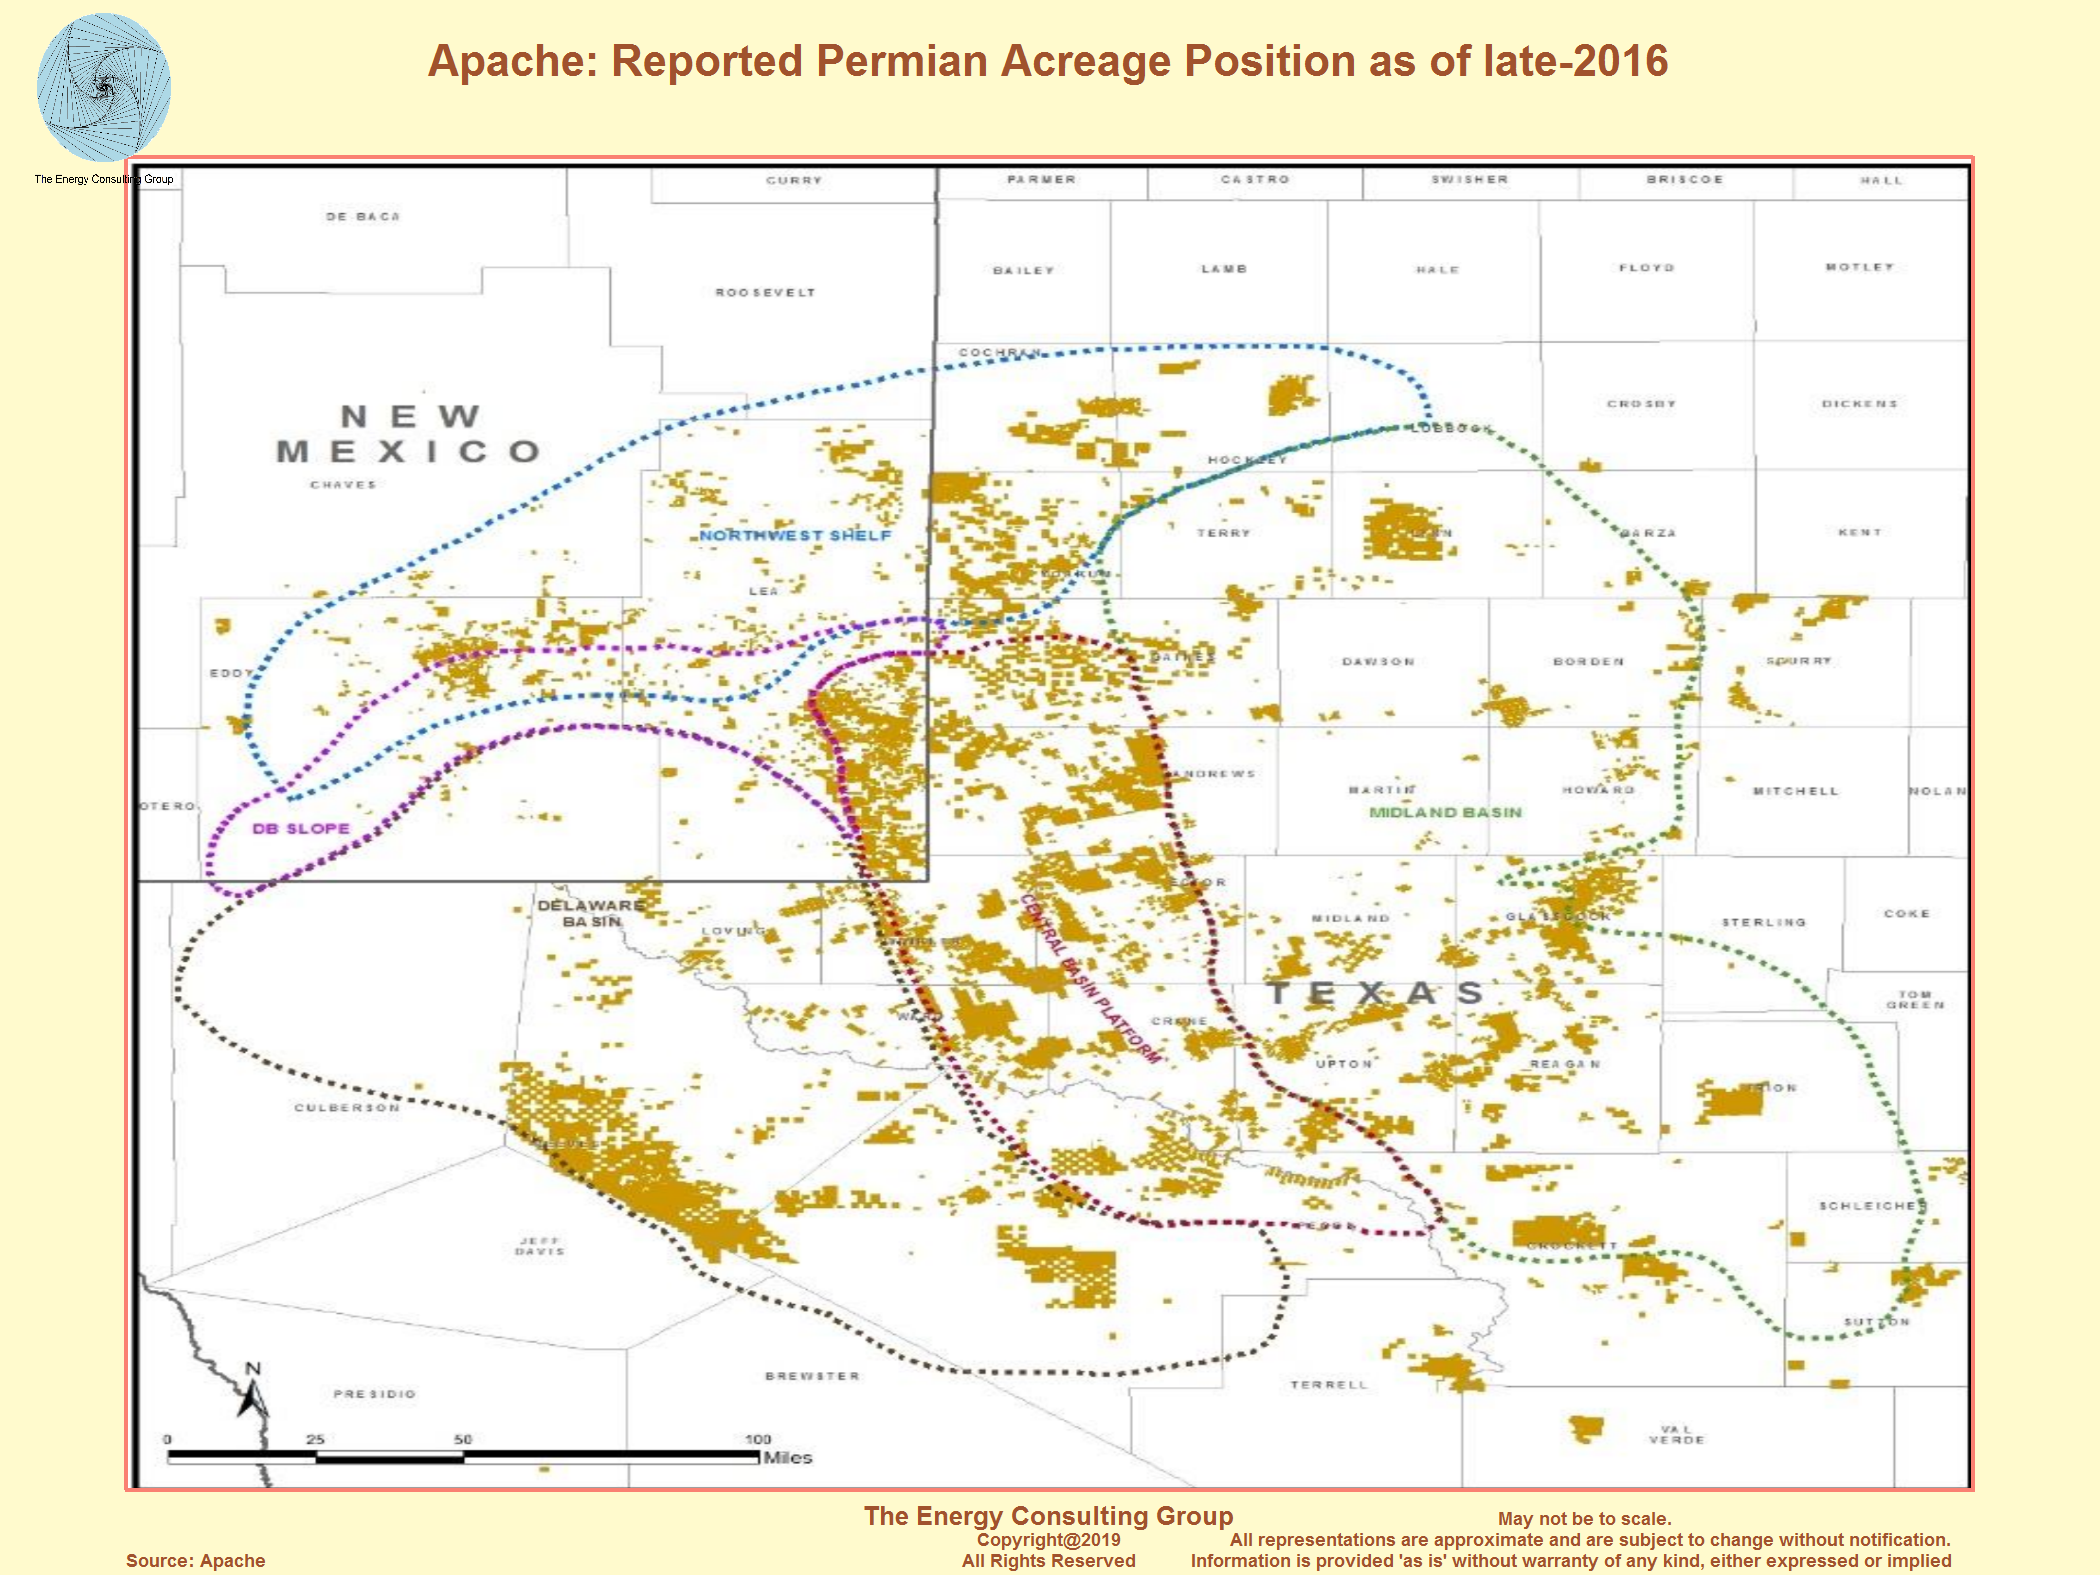 Click For Larger Image |
Chevron: Reported Permian Acreage Position as of March 2019 Click For Larger Image |
Example of a Large,
Nonconventional Development Project in the Permian Basin
The wells in this example were drilled into the Spraberry formation in Martin
Co,, TX, which is at the northern end of the Midland Basin, nonconventional
development region.
Permian Basin: Nonconventional Oil Footprint, Martin Co, TX 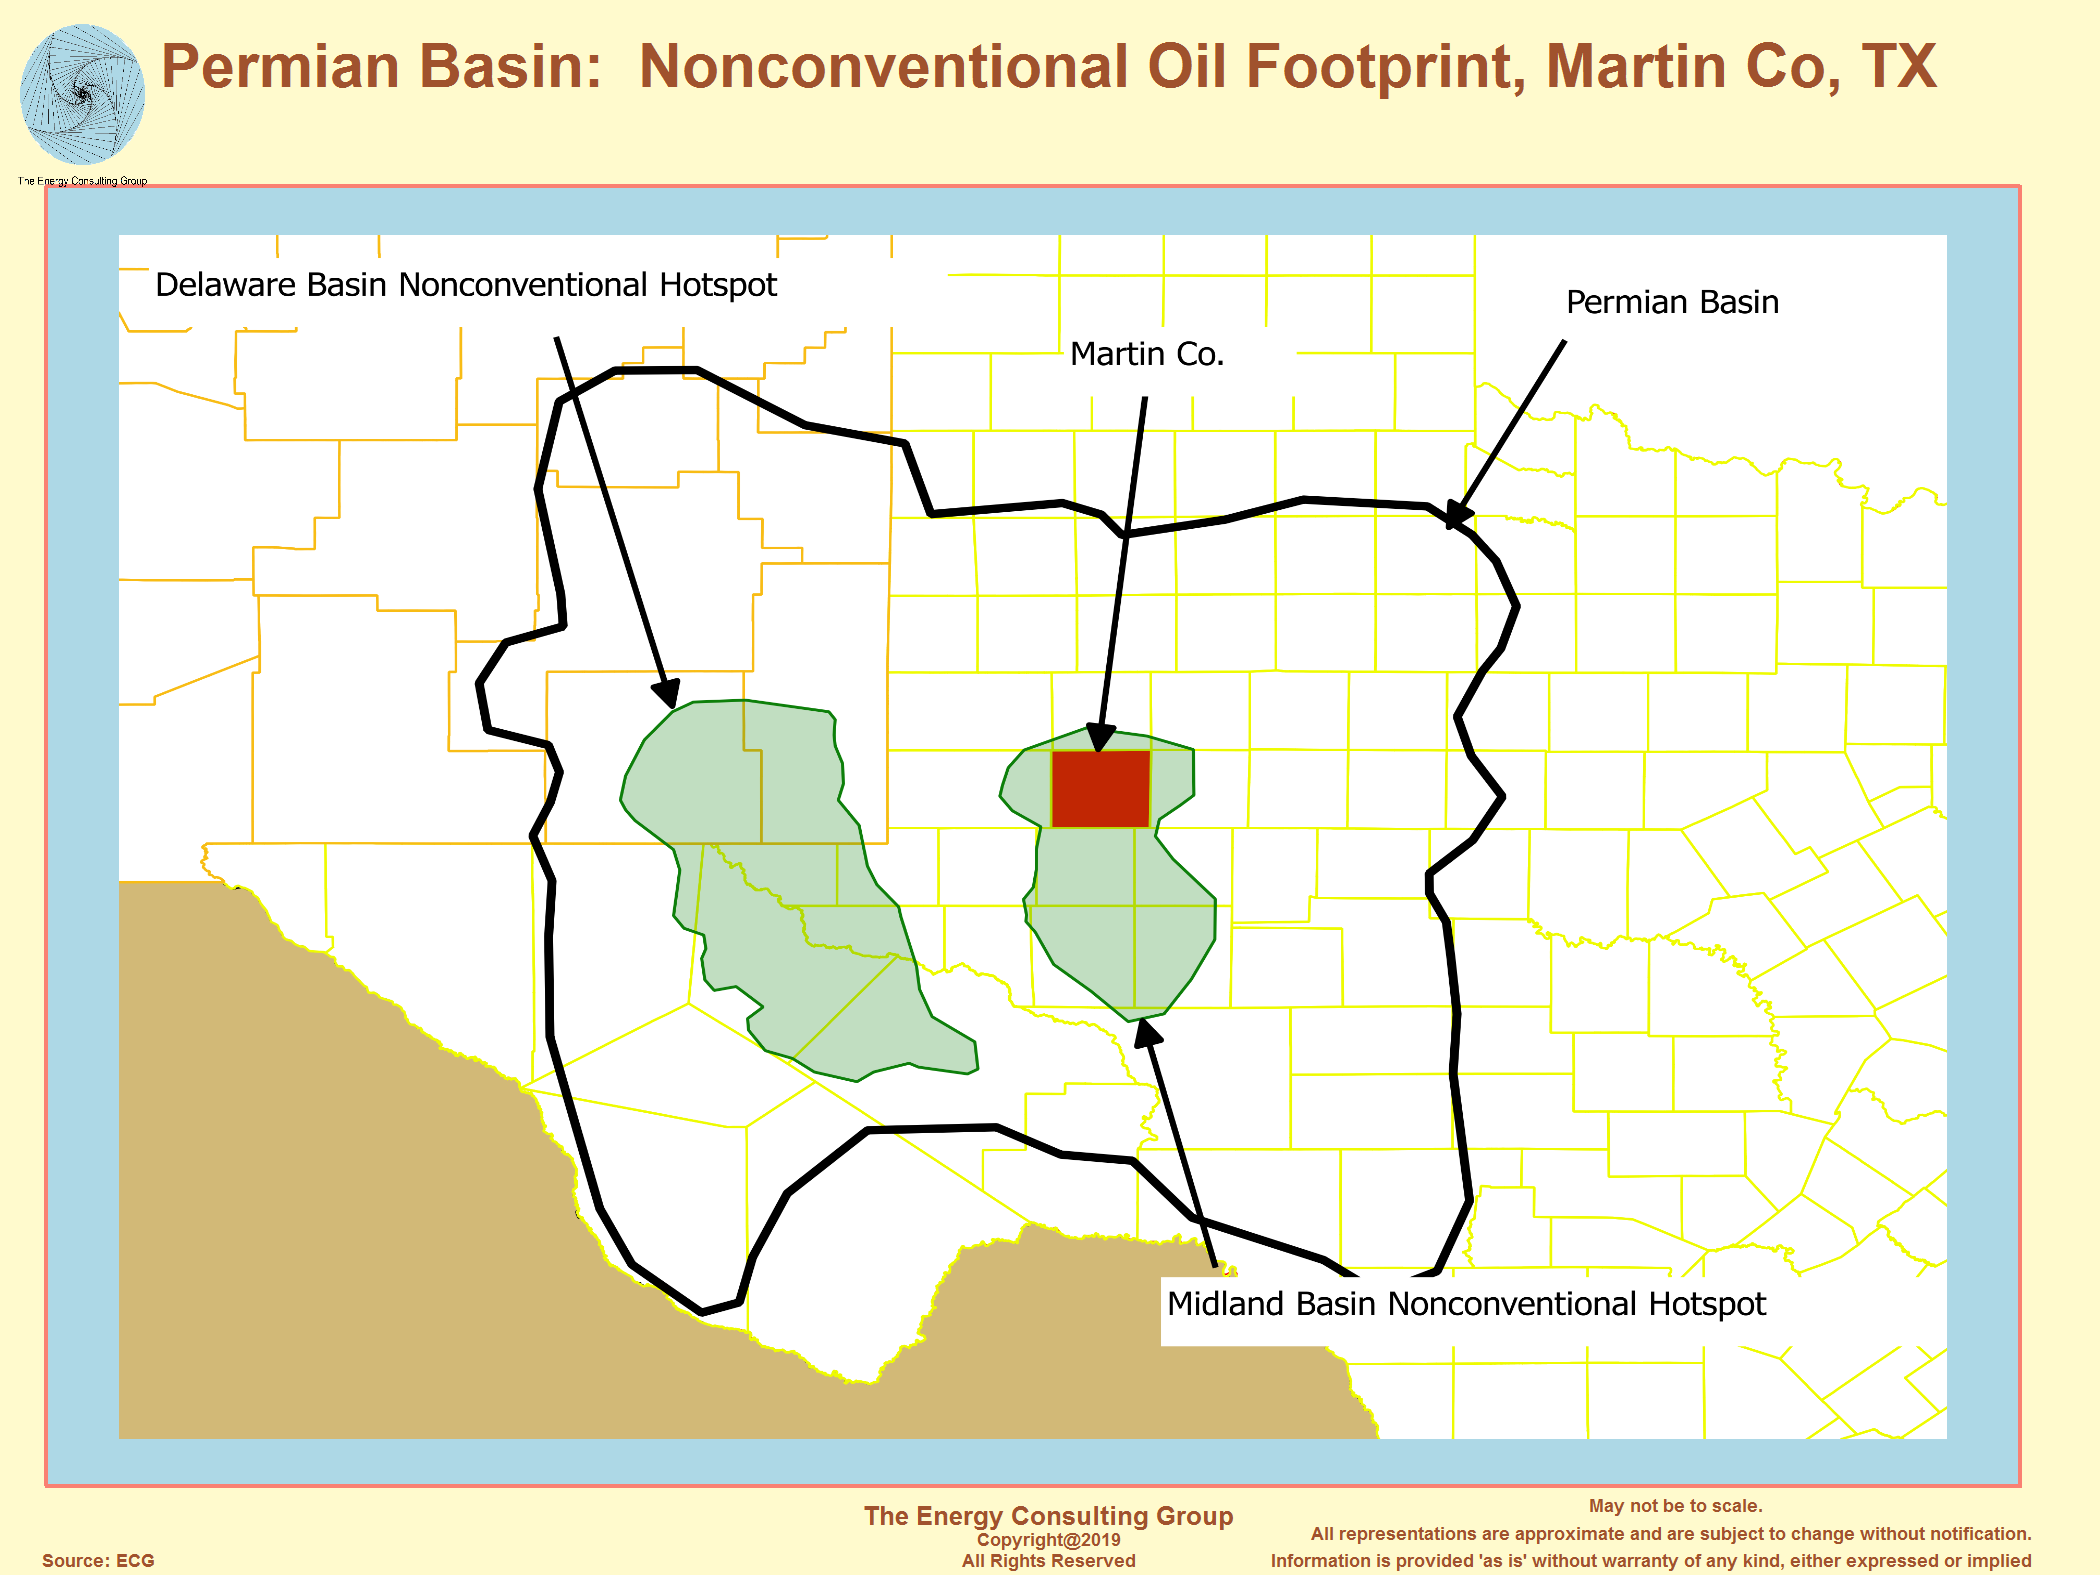 Click For Larger Image |
Illustrative Permian
Example: Oil and Gas Production Performance For One 24 Well Project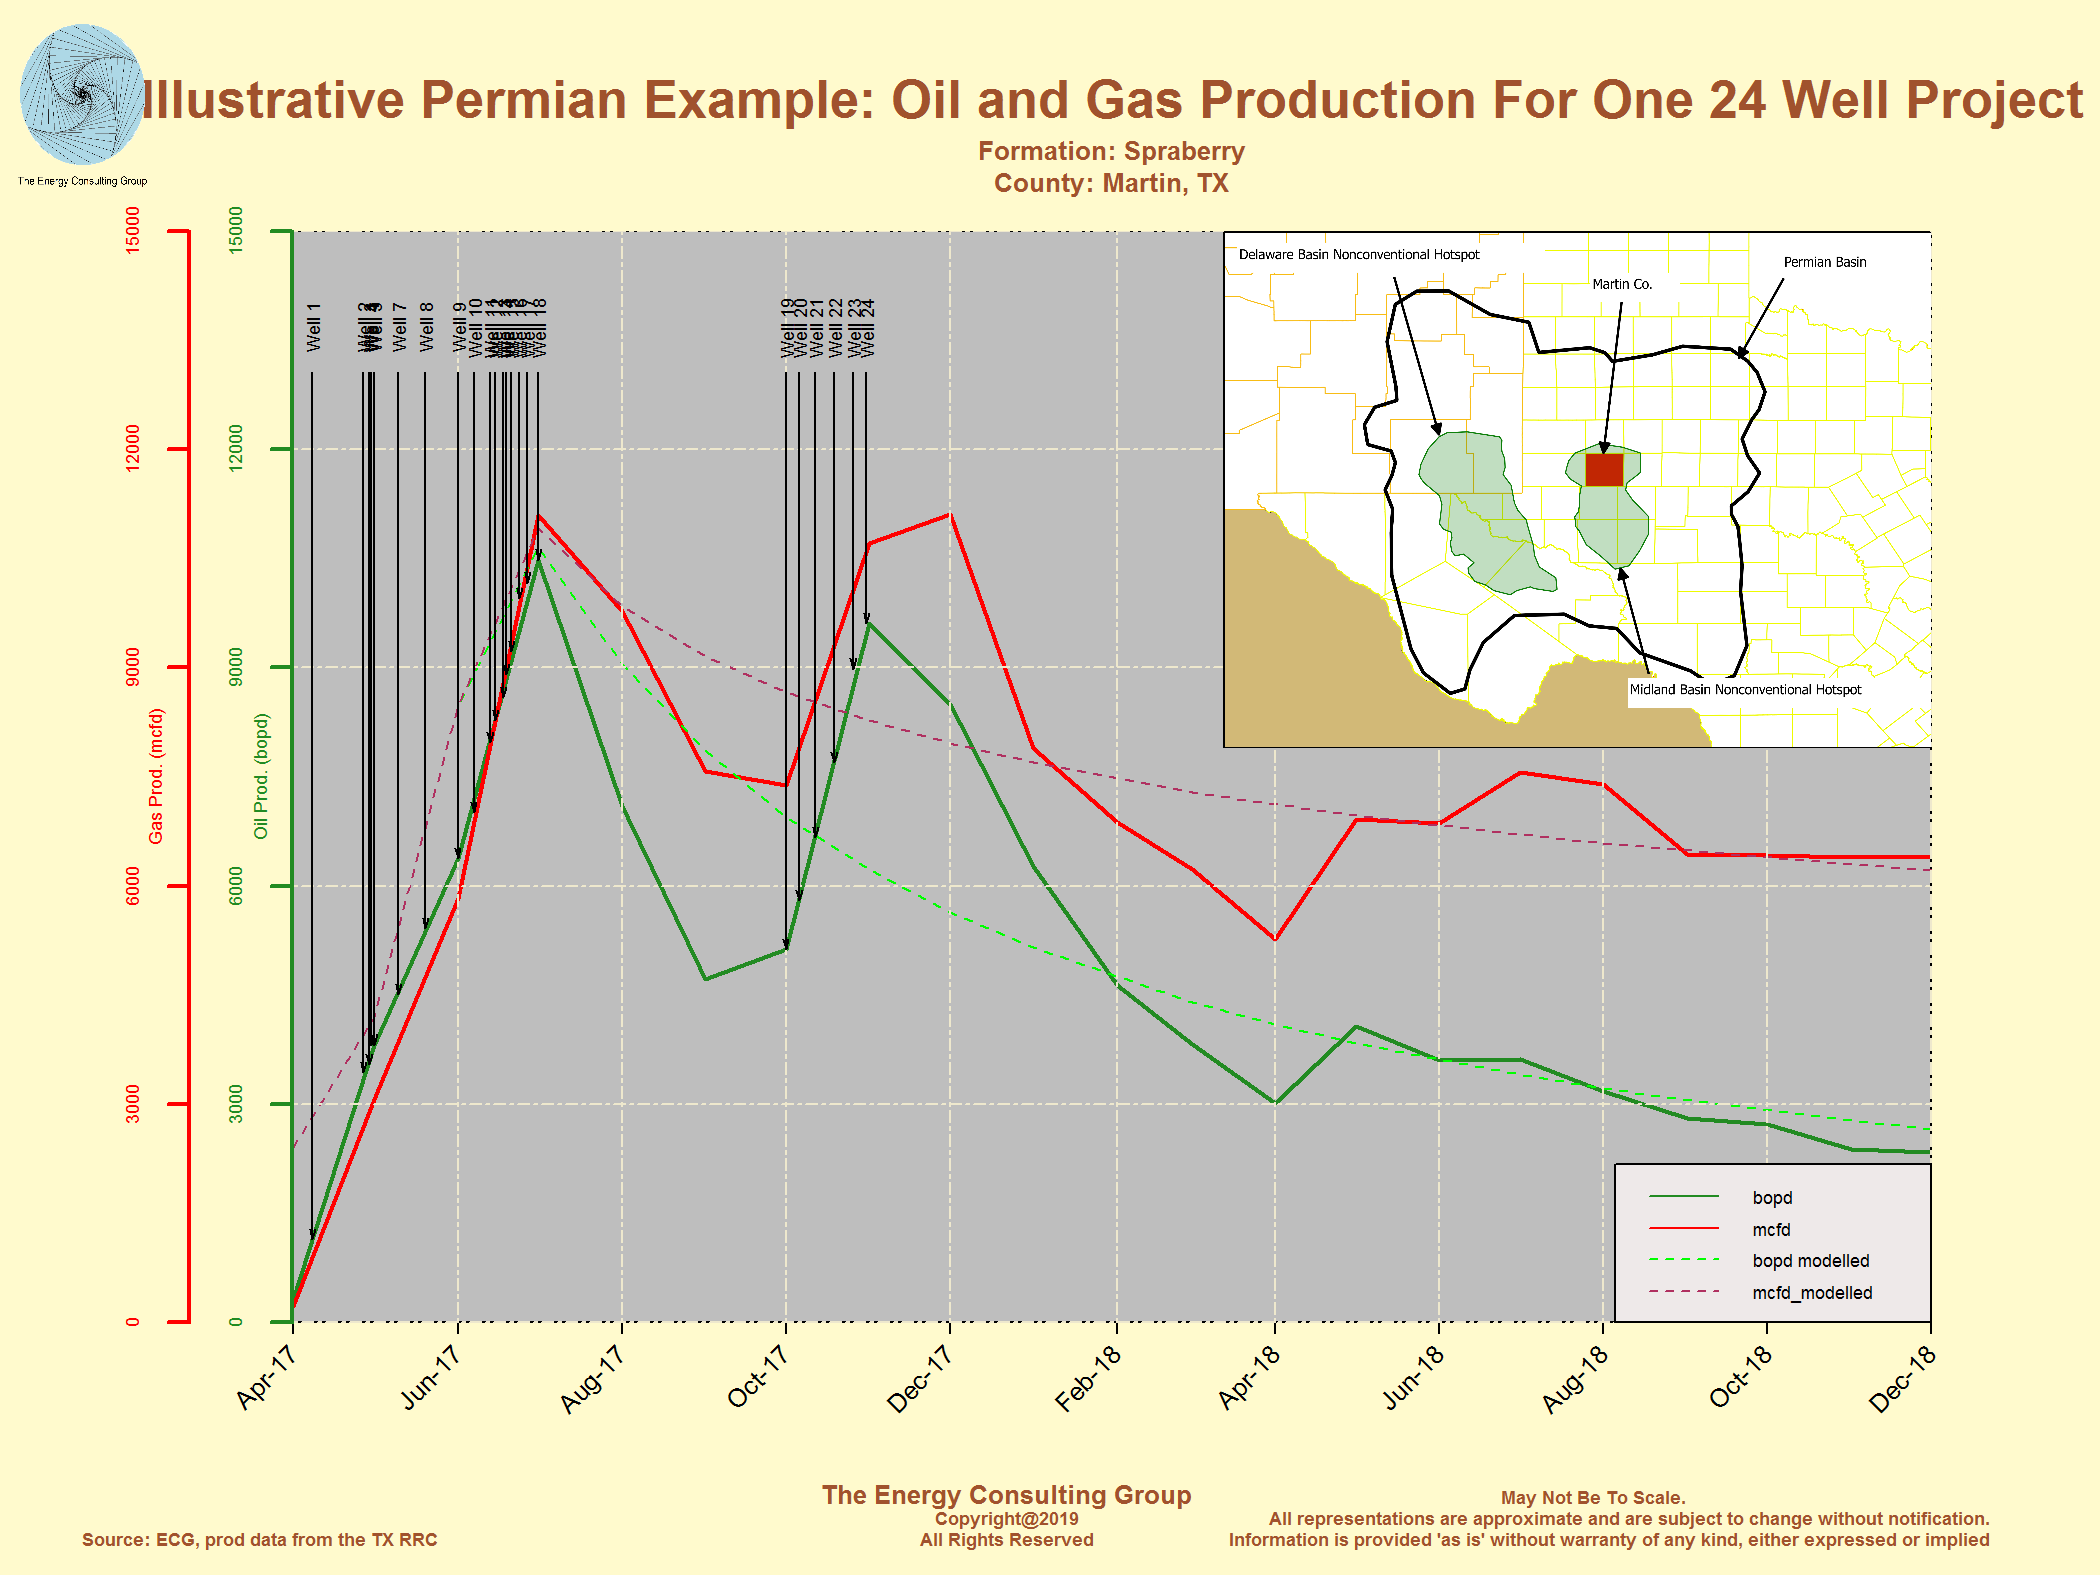 Click For Larger Image |
Permian Basin: Reported Casing Design for a Horizontal, Multistage
Fracked Well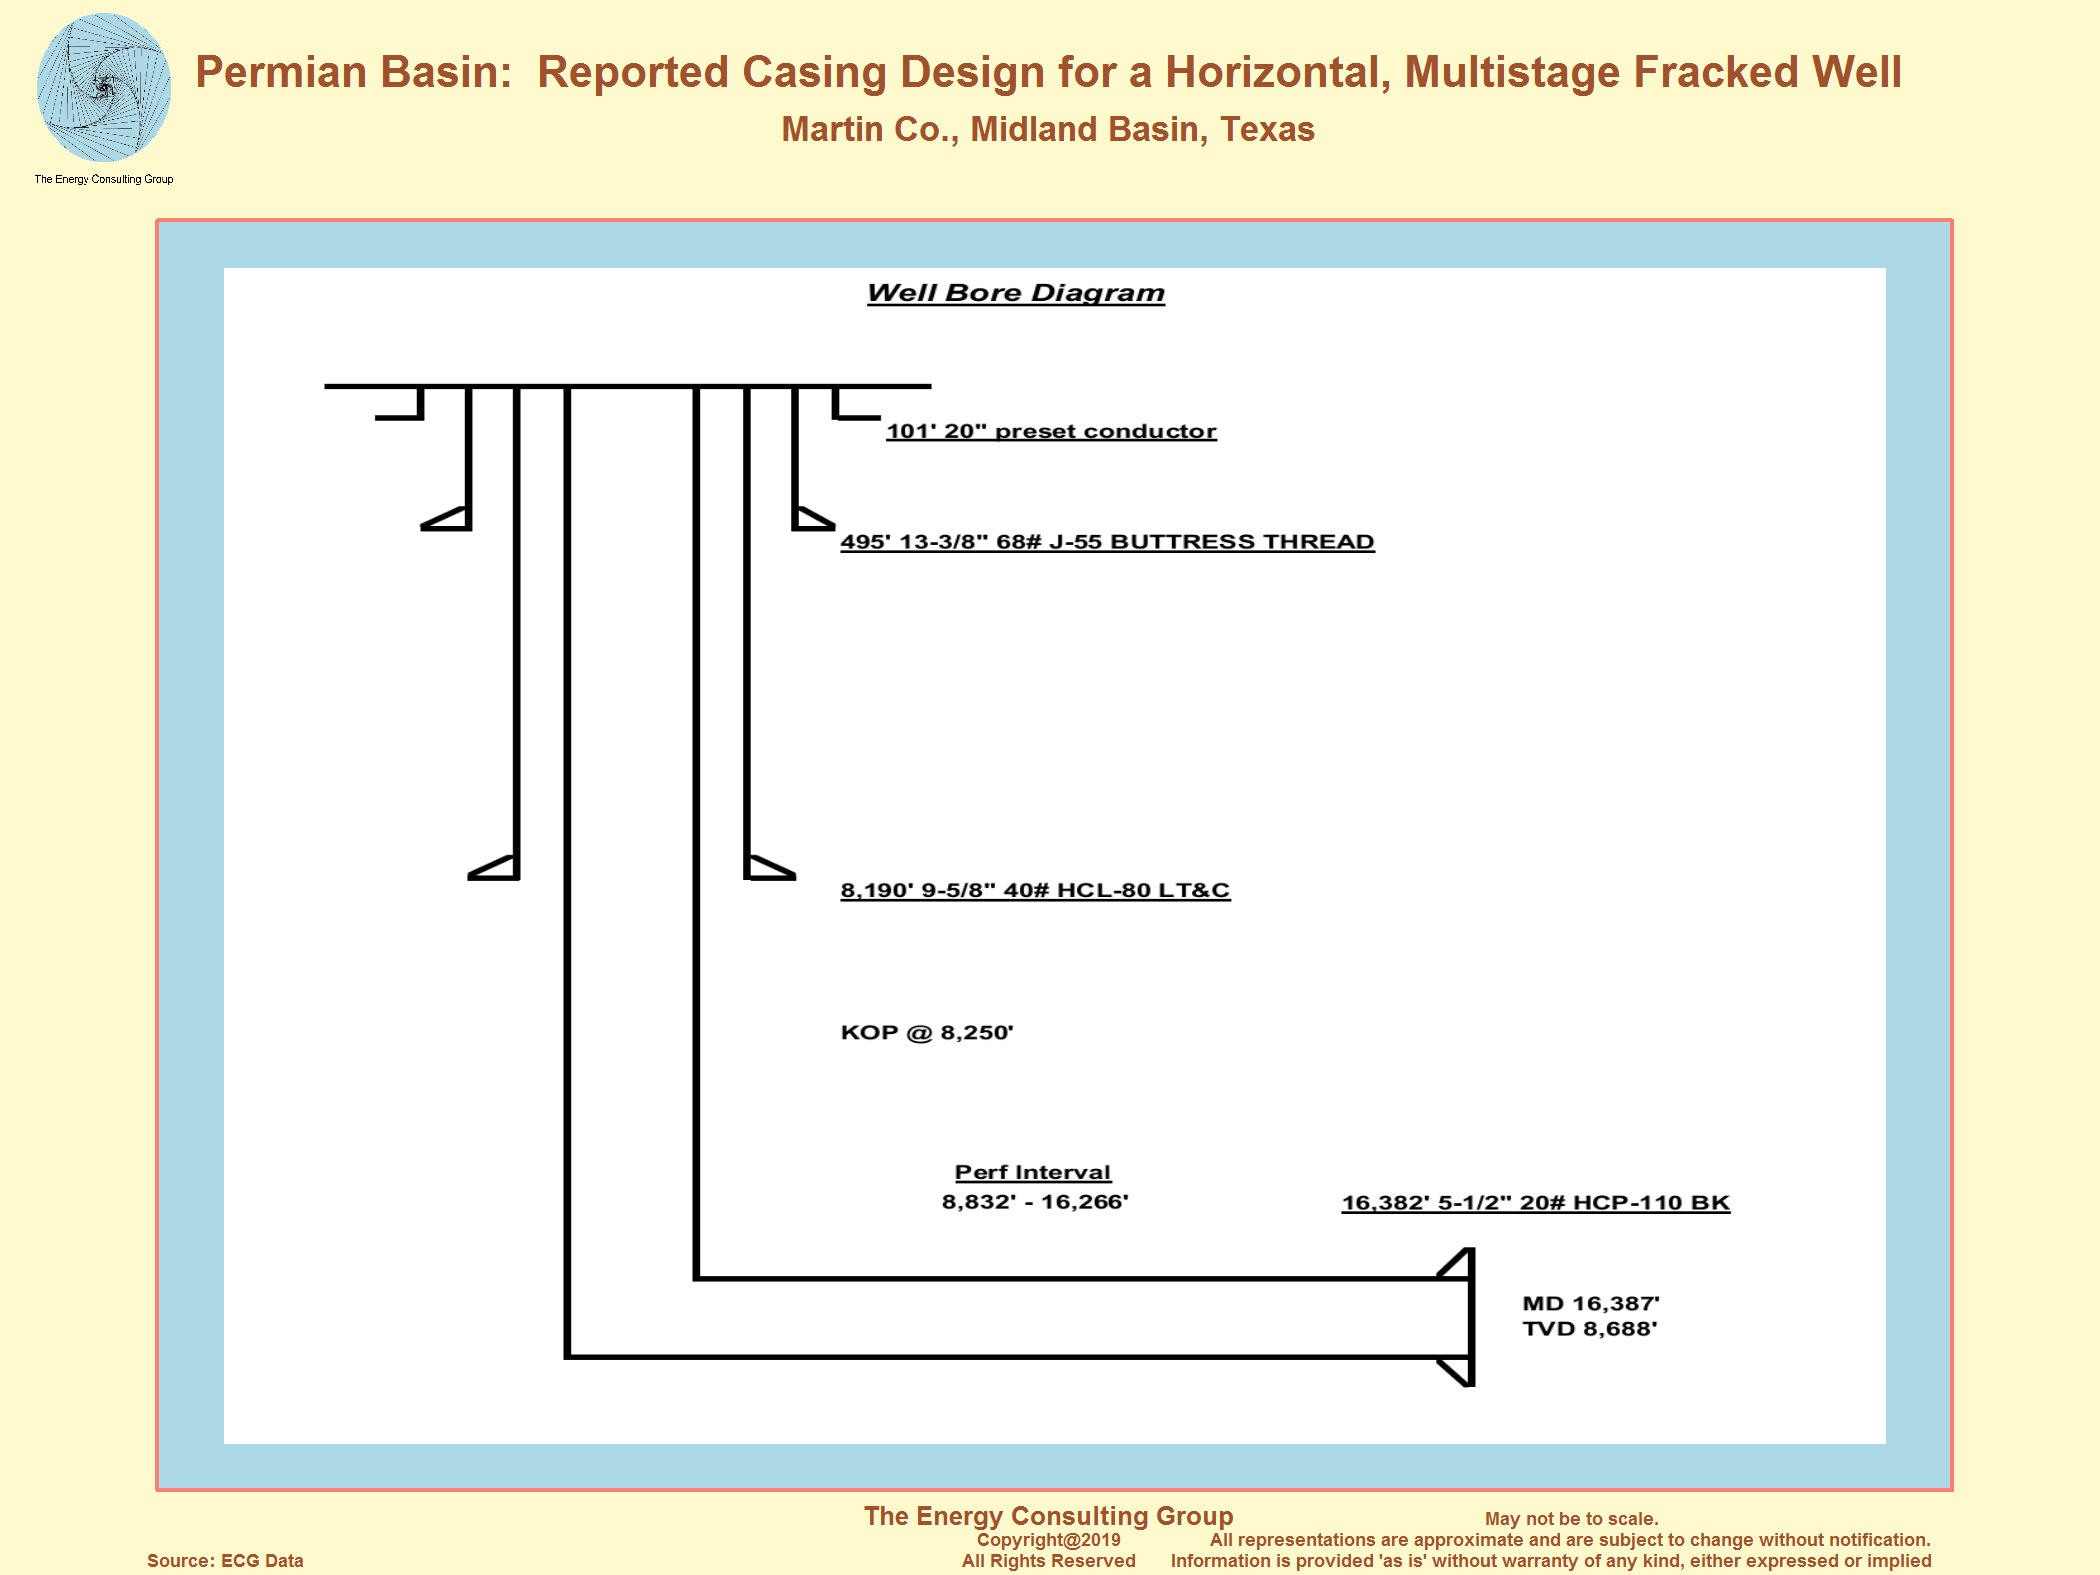 Click For Larger Image |
Permian Basin Reported Directional Survey for a
Horizontal, Multistage Fracked Well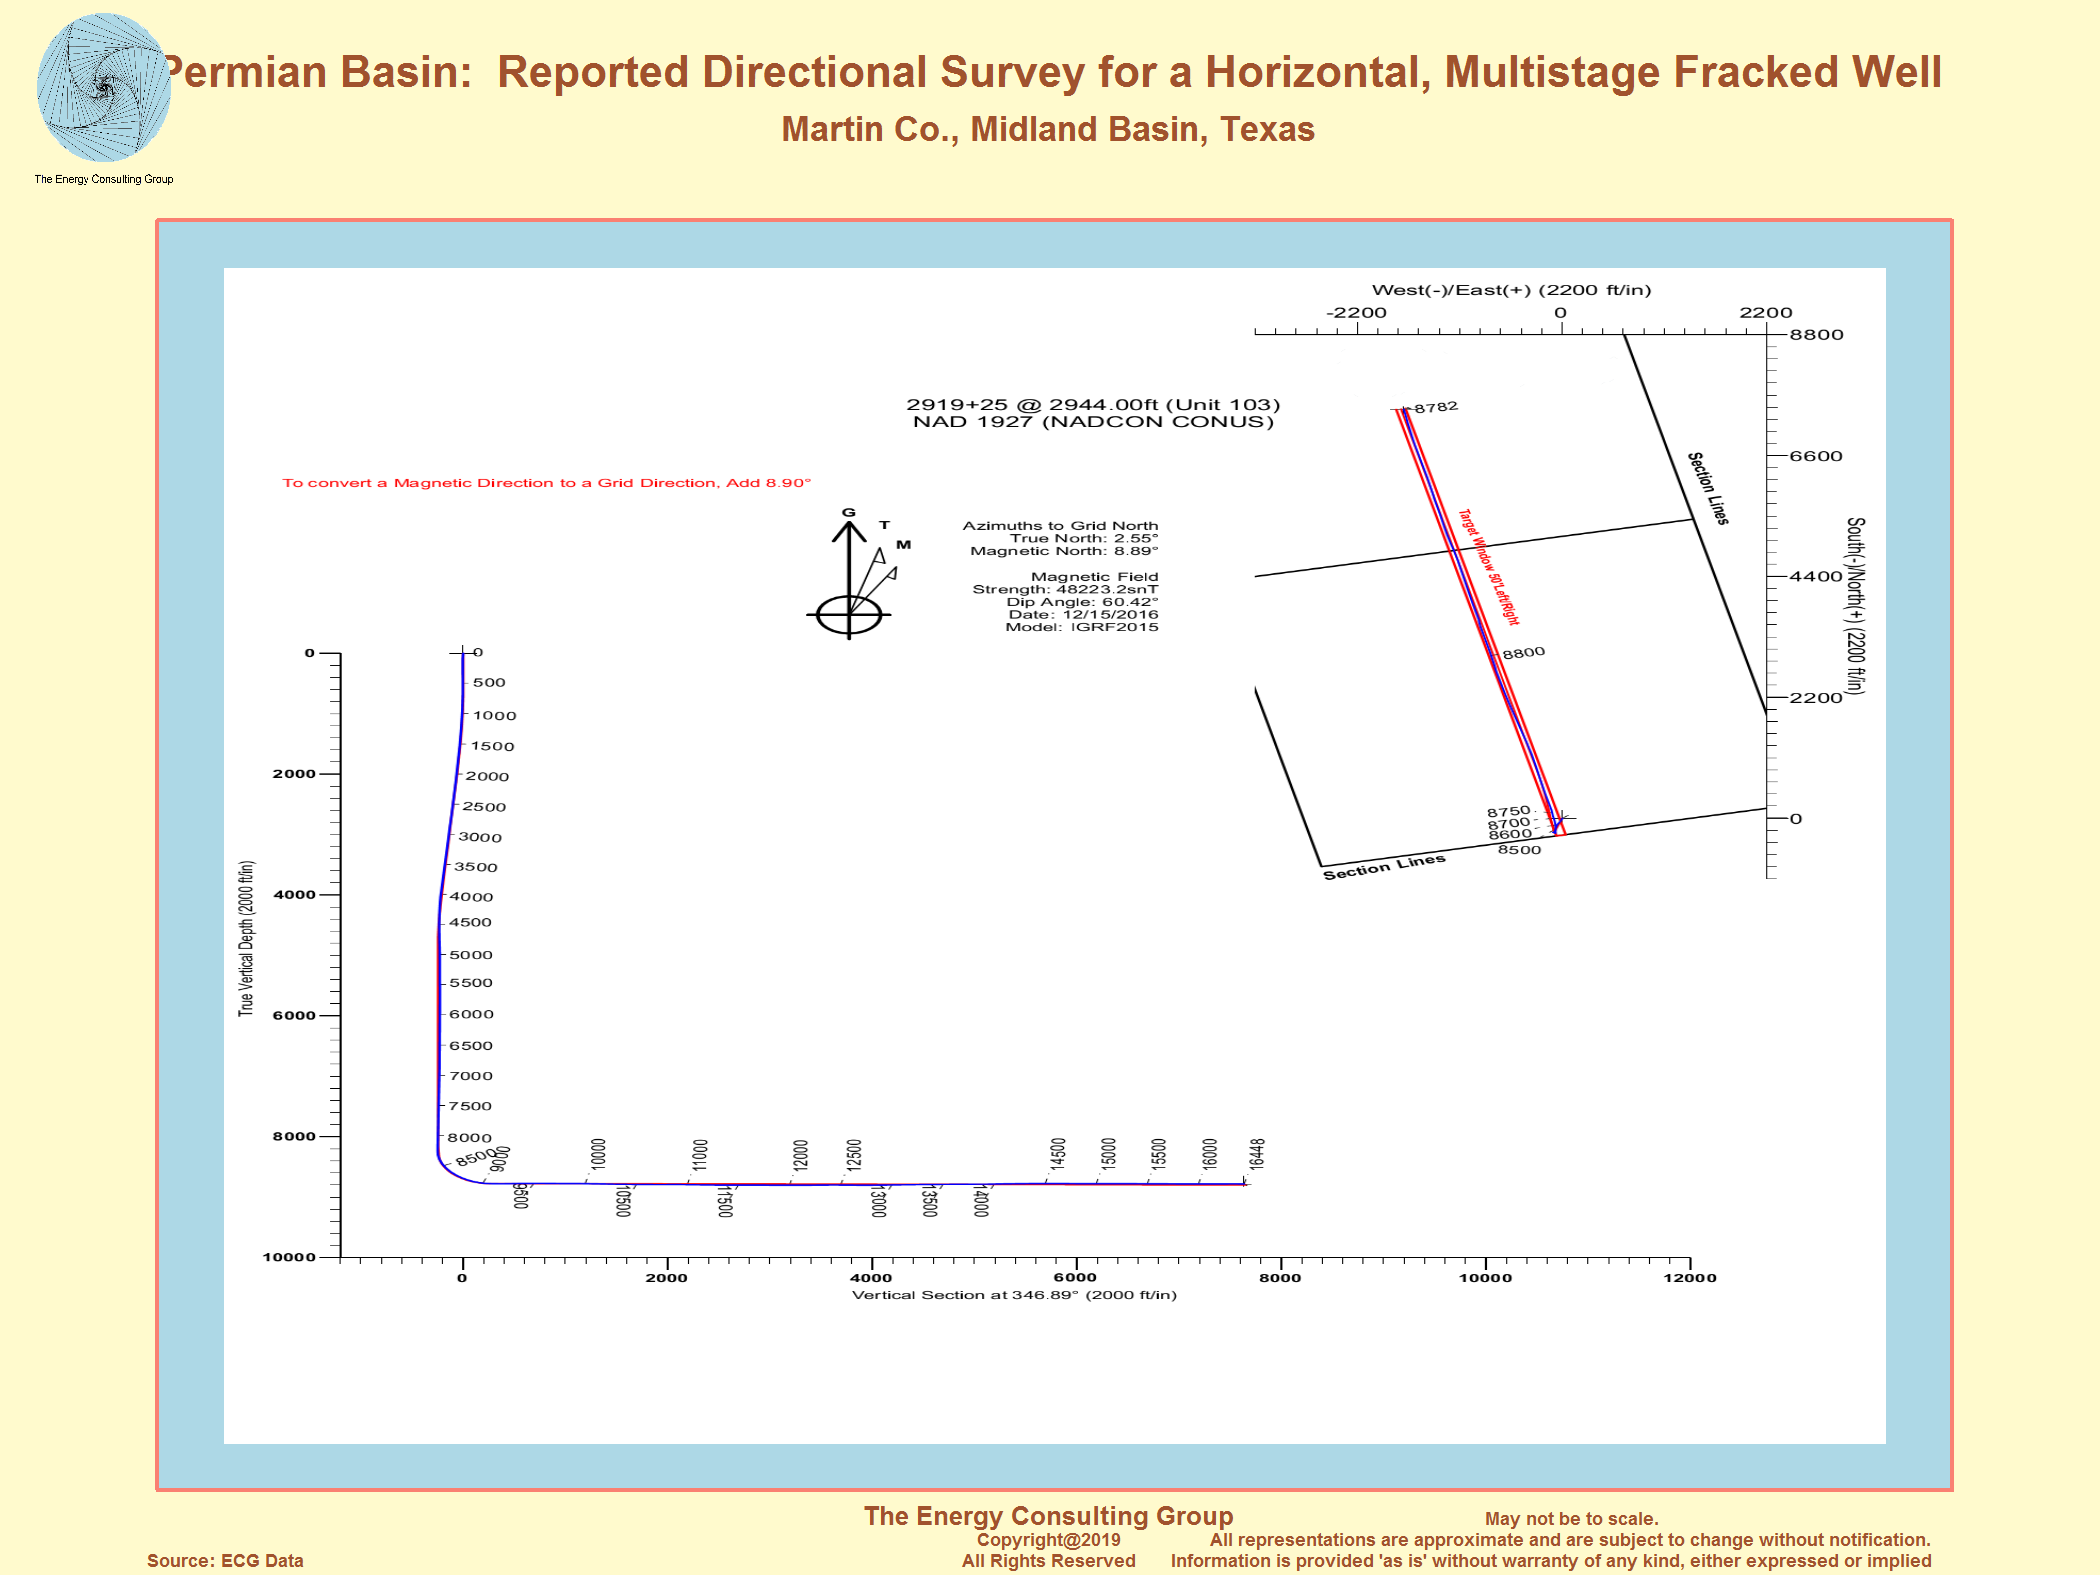 Click For Larger Image |
Permian Basin: Excerpt
From Frack Log For 50 Frack Stage Horizontal Well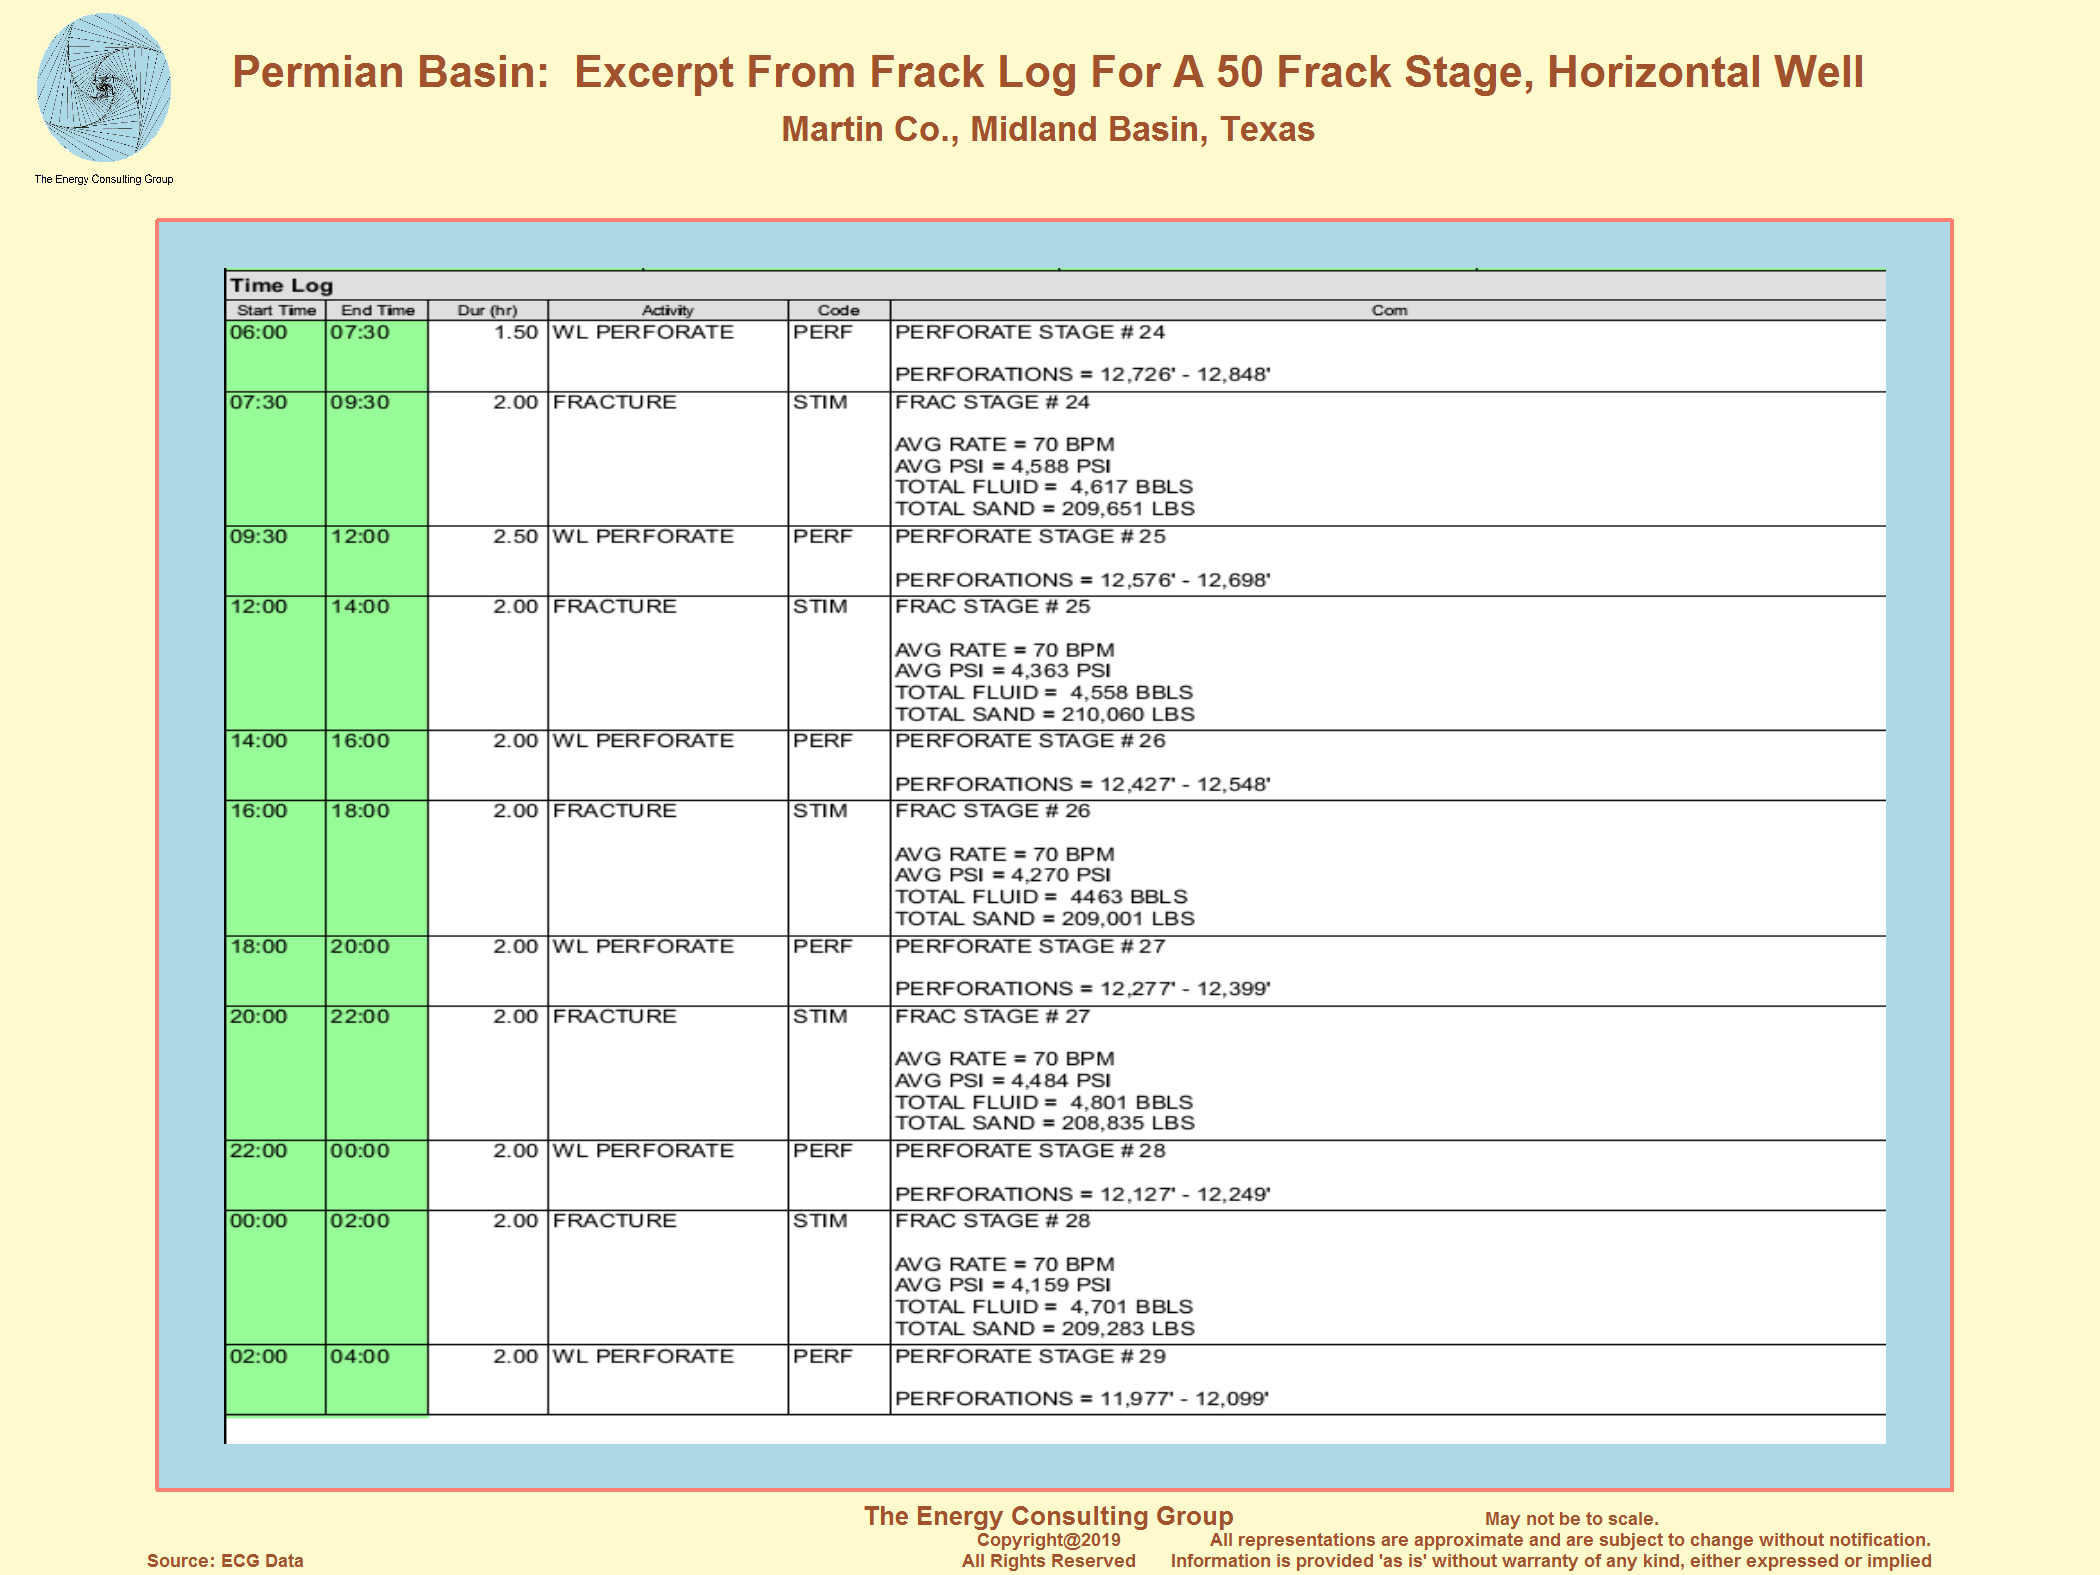 Click For Larger Image |
Energy Consulting Group data includes the operational, and performance history for literally thousands of wells across the Permian Basin. As illustrated by this example, this data includes casing designs, well tests, directional surveys, drilling/completion costs (AFE and actual), production performance, and detailed frack data (number of stages, perforation depths, frac volumes, pressures, etc.) The full frack log from which we pulled the summary to the left is at this link. |
Permian Basin: Nonconventional Oil Footprint, Loving Co, TX |
Go to The Energy Consulting Group home page for more oil and gas related information.