The Energy Consulting Group
Management consultants for upstream oil and gas producers and service companies
|
E&P News and Information Scandinavian International and National International Energy
Agency Department of Trade and Norwegian
Petroleum Ministry of Industry
and E&P Project Information |
|---|
| Saudi Arabia: Ghawar Link to Energy Consulting Group webpage with analysis/pictures/videos/maps characterizing the drone attacks on Abqaiq and Khurais in Saudi Arabia. Ghawar is the largest conventional oil field (see map below) in the world, and core to the oil production strategy of Saudi Arabia, but it is also well past its peak production phase. Based on our simulation model of Ghawar, and a close comparison with nearby analogous fields, it is our assessment that Ghawar is close to going on decline, if not already there. Update: the recent bond prospectus prepared by Saudi Aramco confirms the above assessment. From the Saudi Aramco Bond Prospectus "The northern-most portion of the Ghawar field lies approximately 100 kilometres west of Dhahran. The field comprises six main areas (Fazran, Ain Dar, Shedgum, Uthaminyah, Hawiyah and Haradh) and extends southward over more than 200 kilometres as one long continuous anticline. It is approximately 36 kilometres across at its widest point (where the Ain Dar and Shedgum areas run in parallel and are 26 kilometres and 10 kilometres wide, respectively). The Company believes that the Ghawar field is the largest oil field in the world in terms of conventional proved reserves, totalling 58.32 billion barrels of oil equivalent as at 31 December 2018, including 48.25 billion barrels of liquids reserves. It has accounted for more than half of the total cumulative crude oil production in the Kingdom but still maintained a MSC* of 3.800 million barrels of crude oil per day as at 31 December 2018." * MSC refers to the average maximum number of barrels per day of crude oil that can be produced for one year during any future planning period, after taking into account all planned capital expenditures and maintenance, repair and operating costs, and after being given three months to make operational adjustments.
Part of what is missing from this discussion is how much of the
remaining estimated recovery will require some type of EOR? The
reason we ask this question is that based on our analysis and on numbers
provided by Aramco in the bond prospectus, we estimate
the EUR for oil from Ghawar will be approximately 128 billion barrels.
Our estimate for OOIP is approximately 170 billion barrels, indicating
an ultimate recovery approaching 75%, which seems unrealistic in a
reasonable time frame unless
there are extensive and expensive EOR operations contemplated for Ghawar
in the not too distant future. Also, when we compare Ghawar to
directly analogous fields, the potential for achieving such recovery
levels seems unlikely without the aforementioned EOR operations. If interested in our projection of the future production performance of Ghawar, as well as discussing our simulation model and the production performance from nearby, analog fields, please contact us at insight@energy-cg.com. Energy Consulting Group Home Page |
Overview Map of the Saudi Arabian Oil and Gas Industry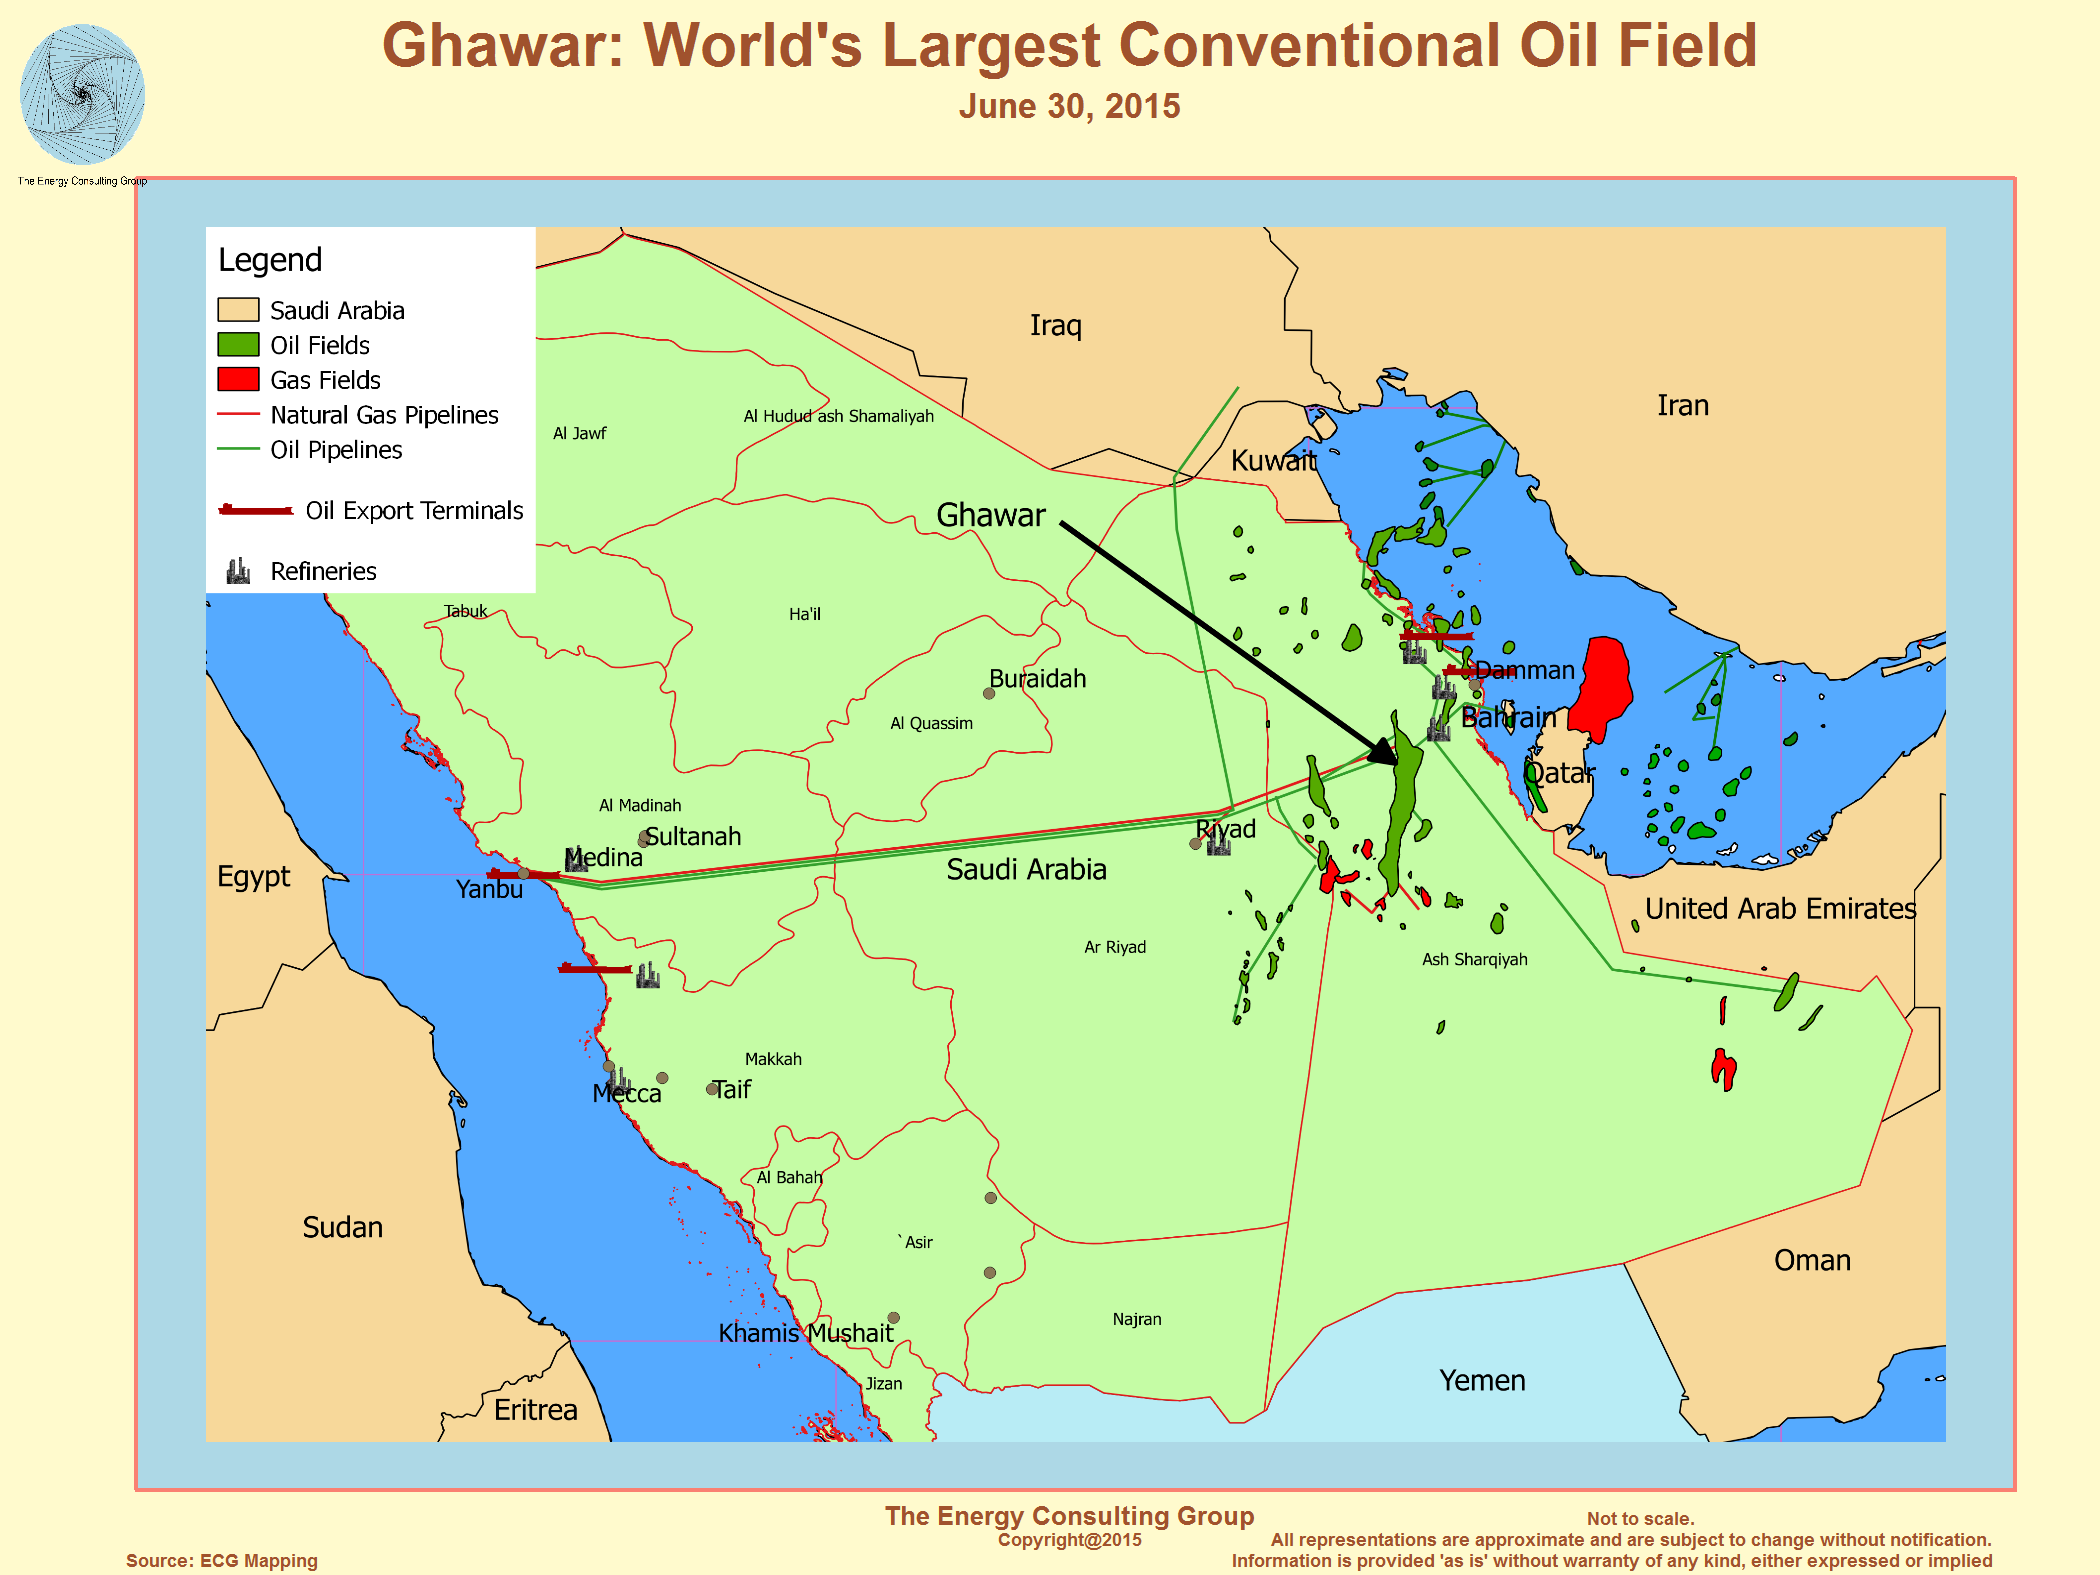 Click on image for higher resolution image. |
More Detailed View of the Location of the Ghawar Field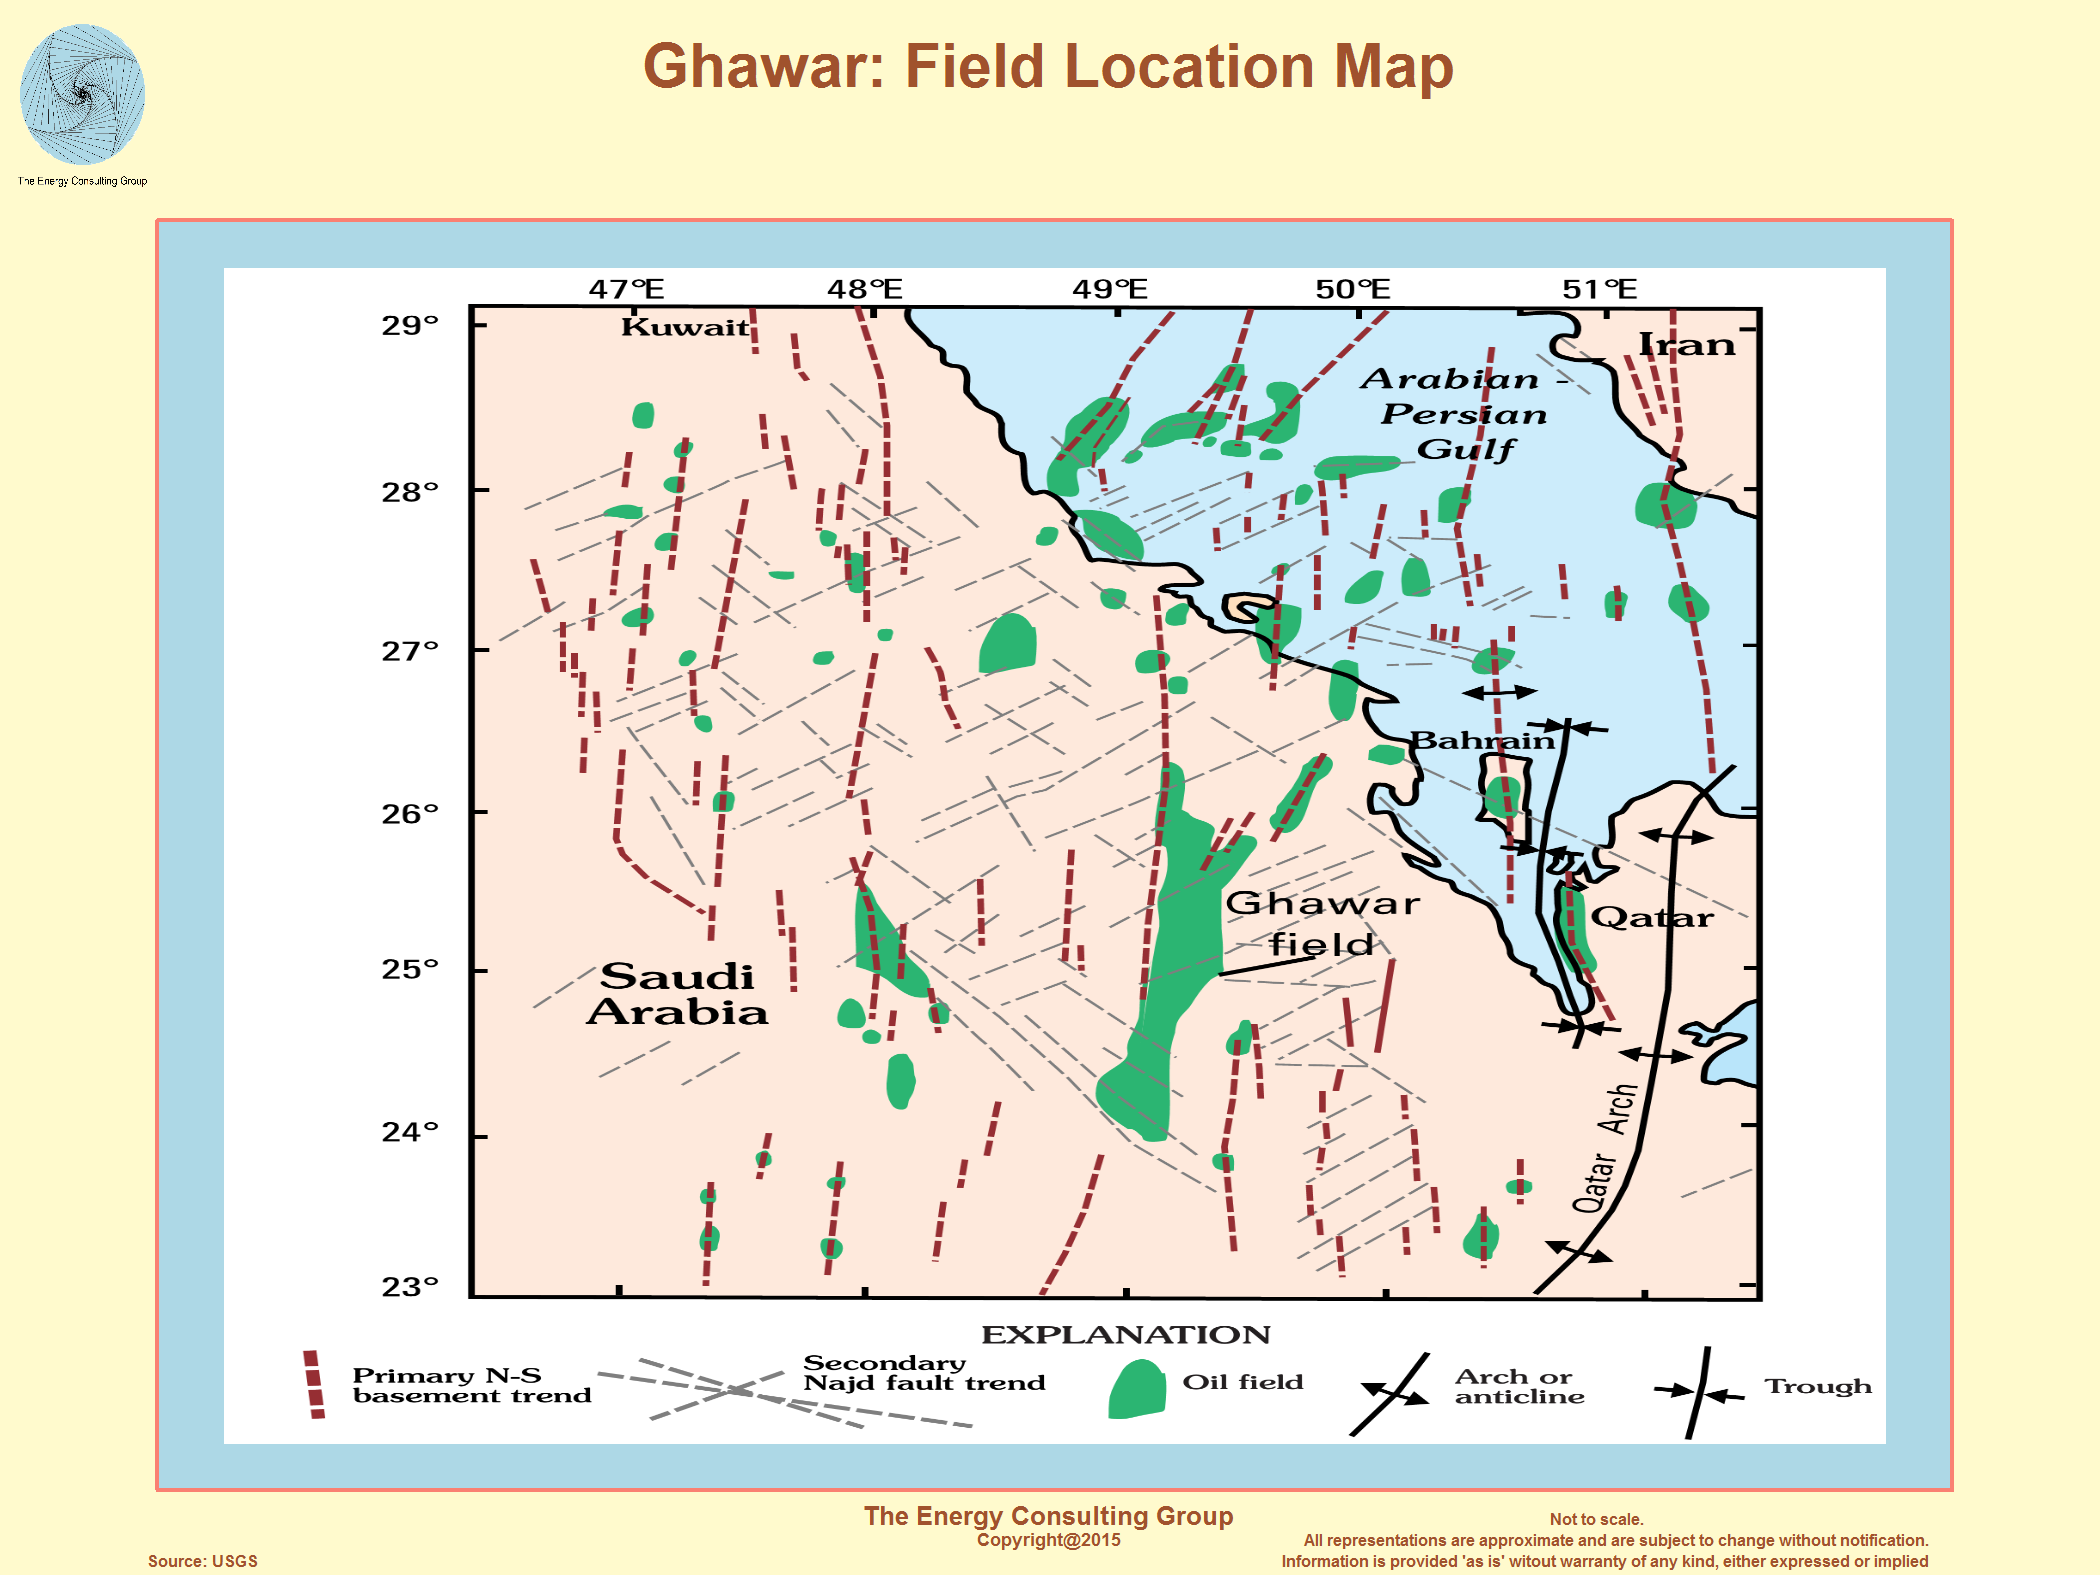 Click on image for higher resolution image. |
|
Ghawar Structure Map on the Top of the Jurrasic Arab D
formation, the Main Producing Formation At Ghawar Click on image for higher resolution image. |
Estimate of Ghawar's Average Daily Production By Year 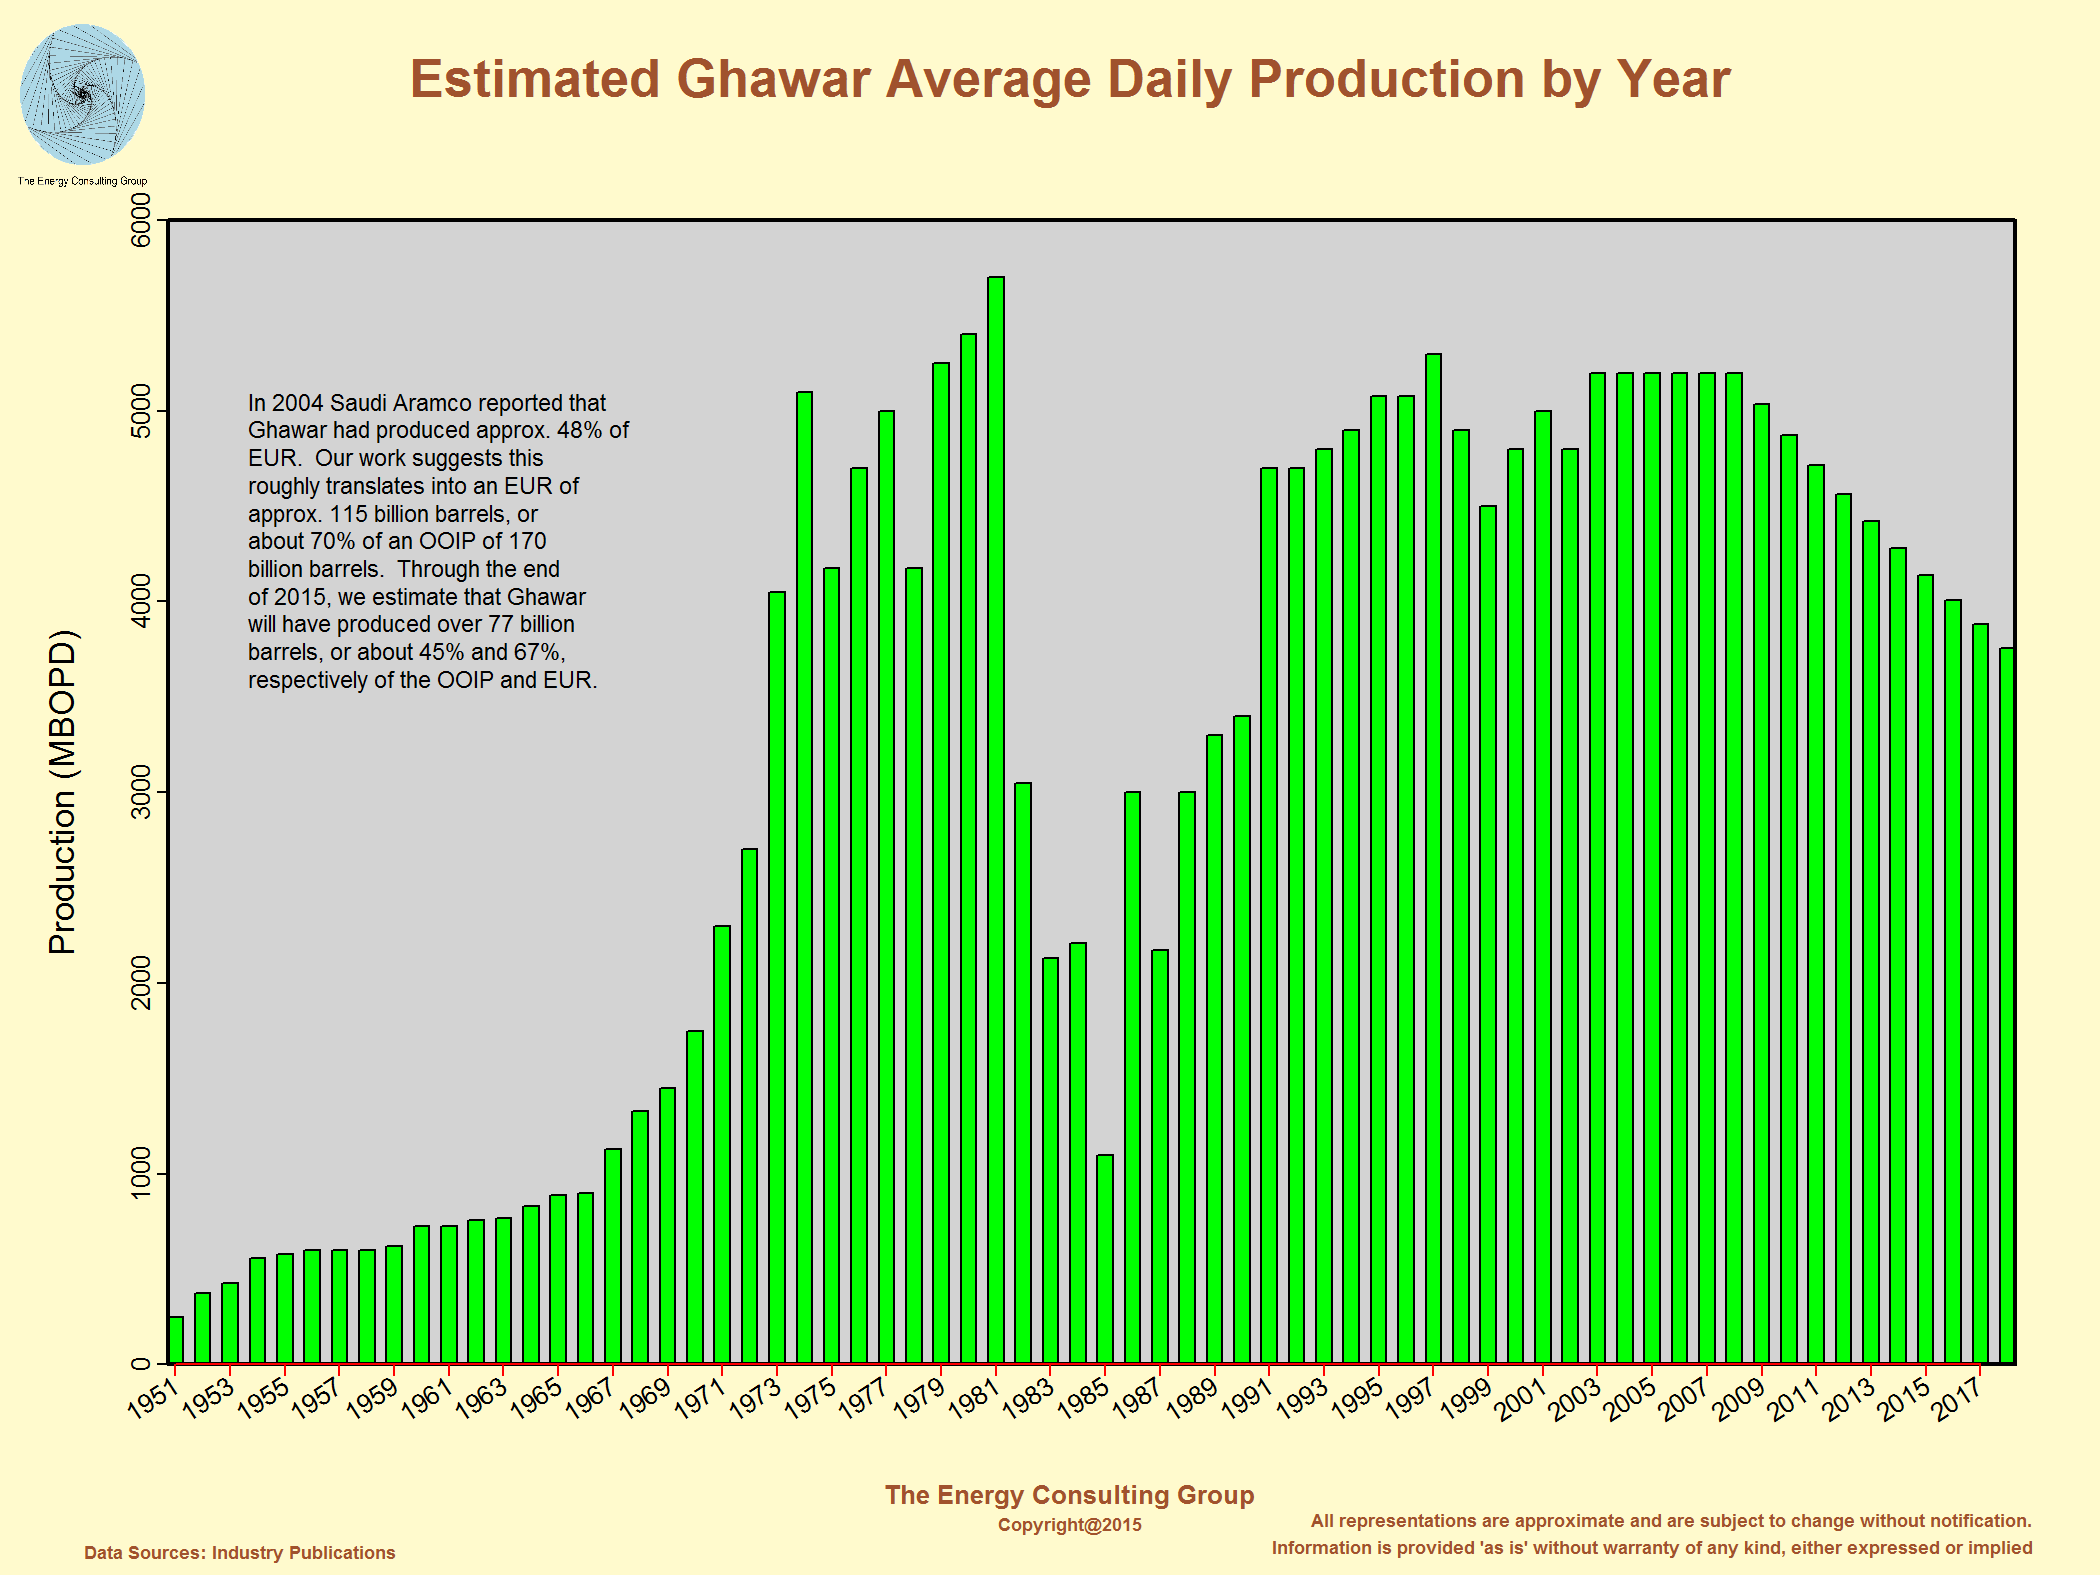 Click on image for higher resolution image. |
Regional Cross Section, including the Jurrasic Interval in which
the Arab D sits Click on image for higher resolution image. |
Well distribution for Ghawar, circa 2000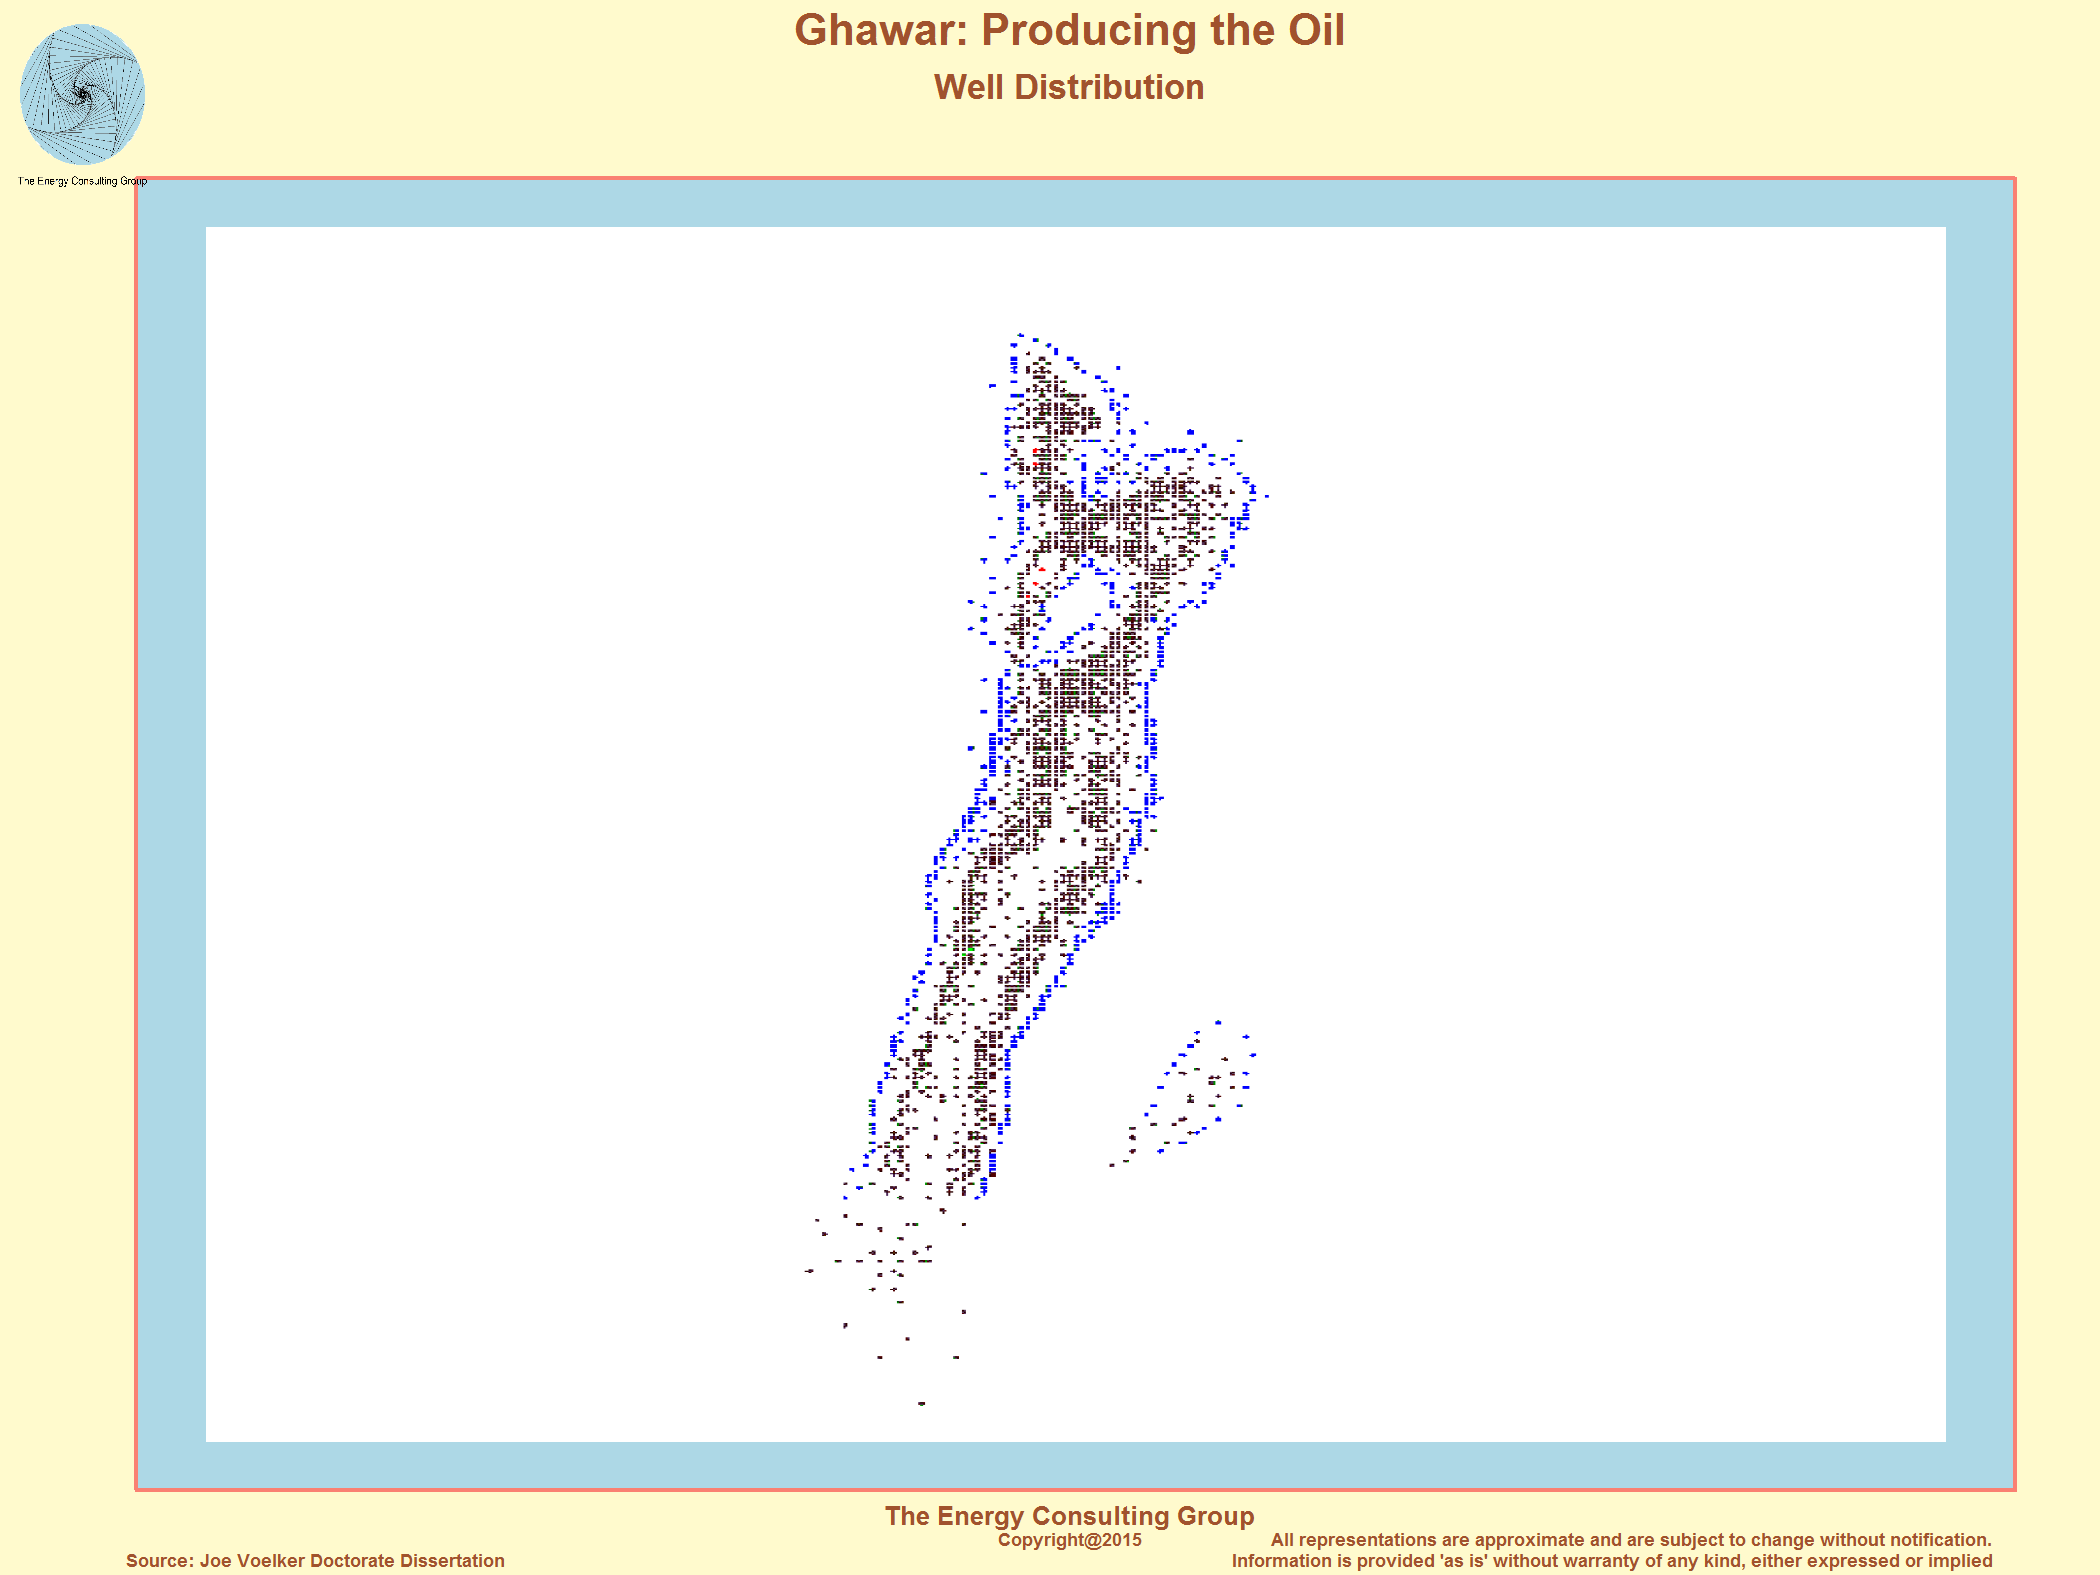 Click on image for higher resolution image. |
Jurrasic Arab D Formation Description and Characteristics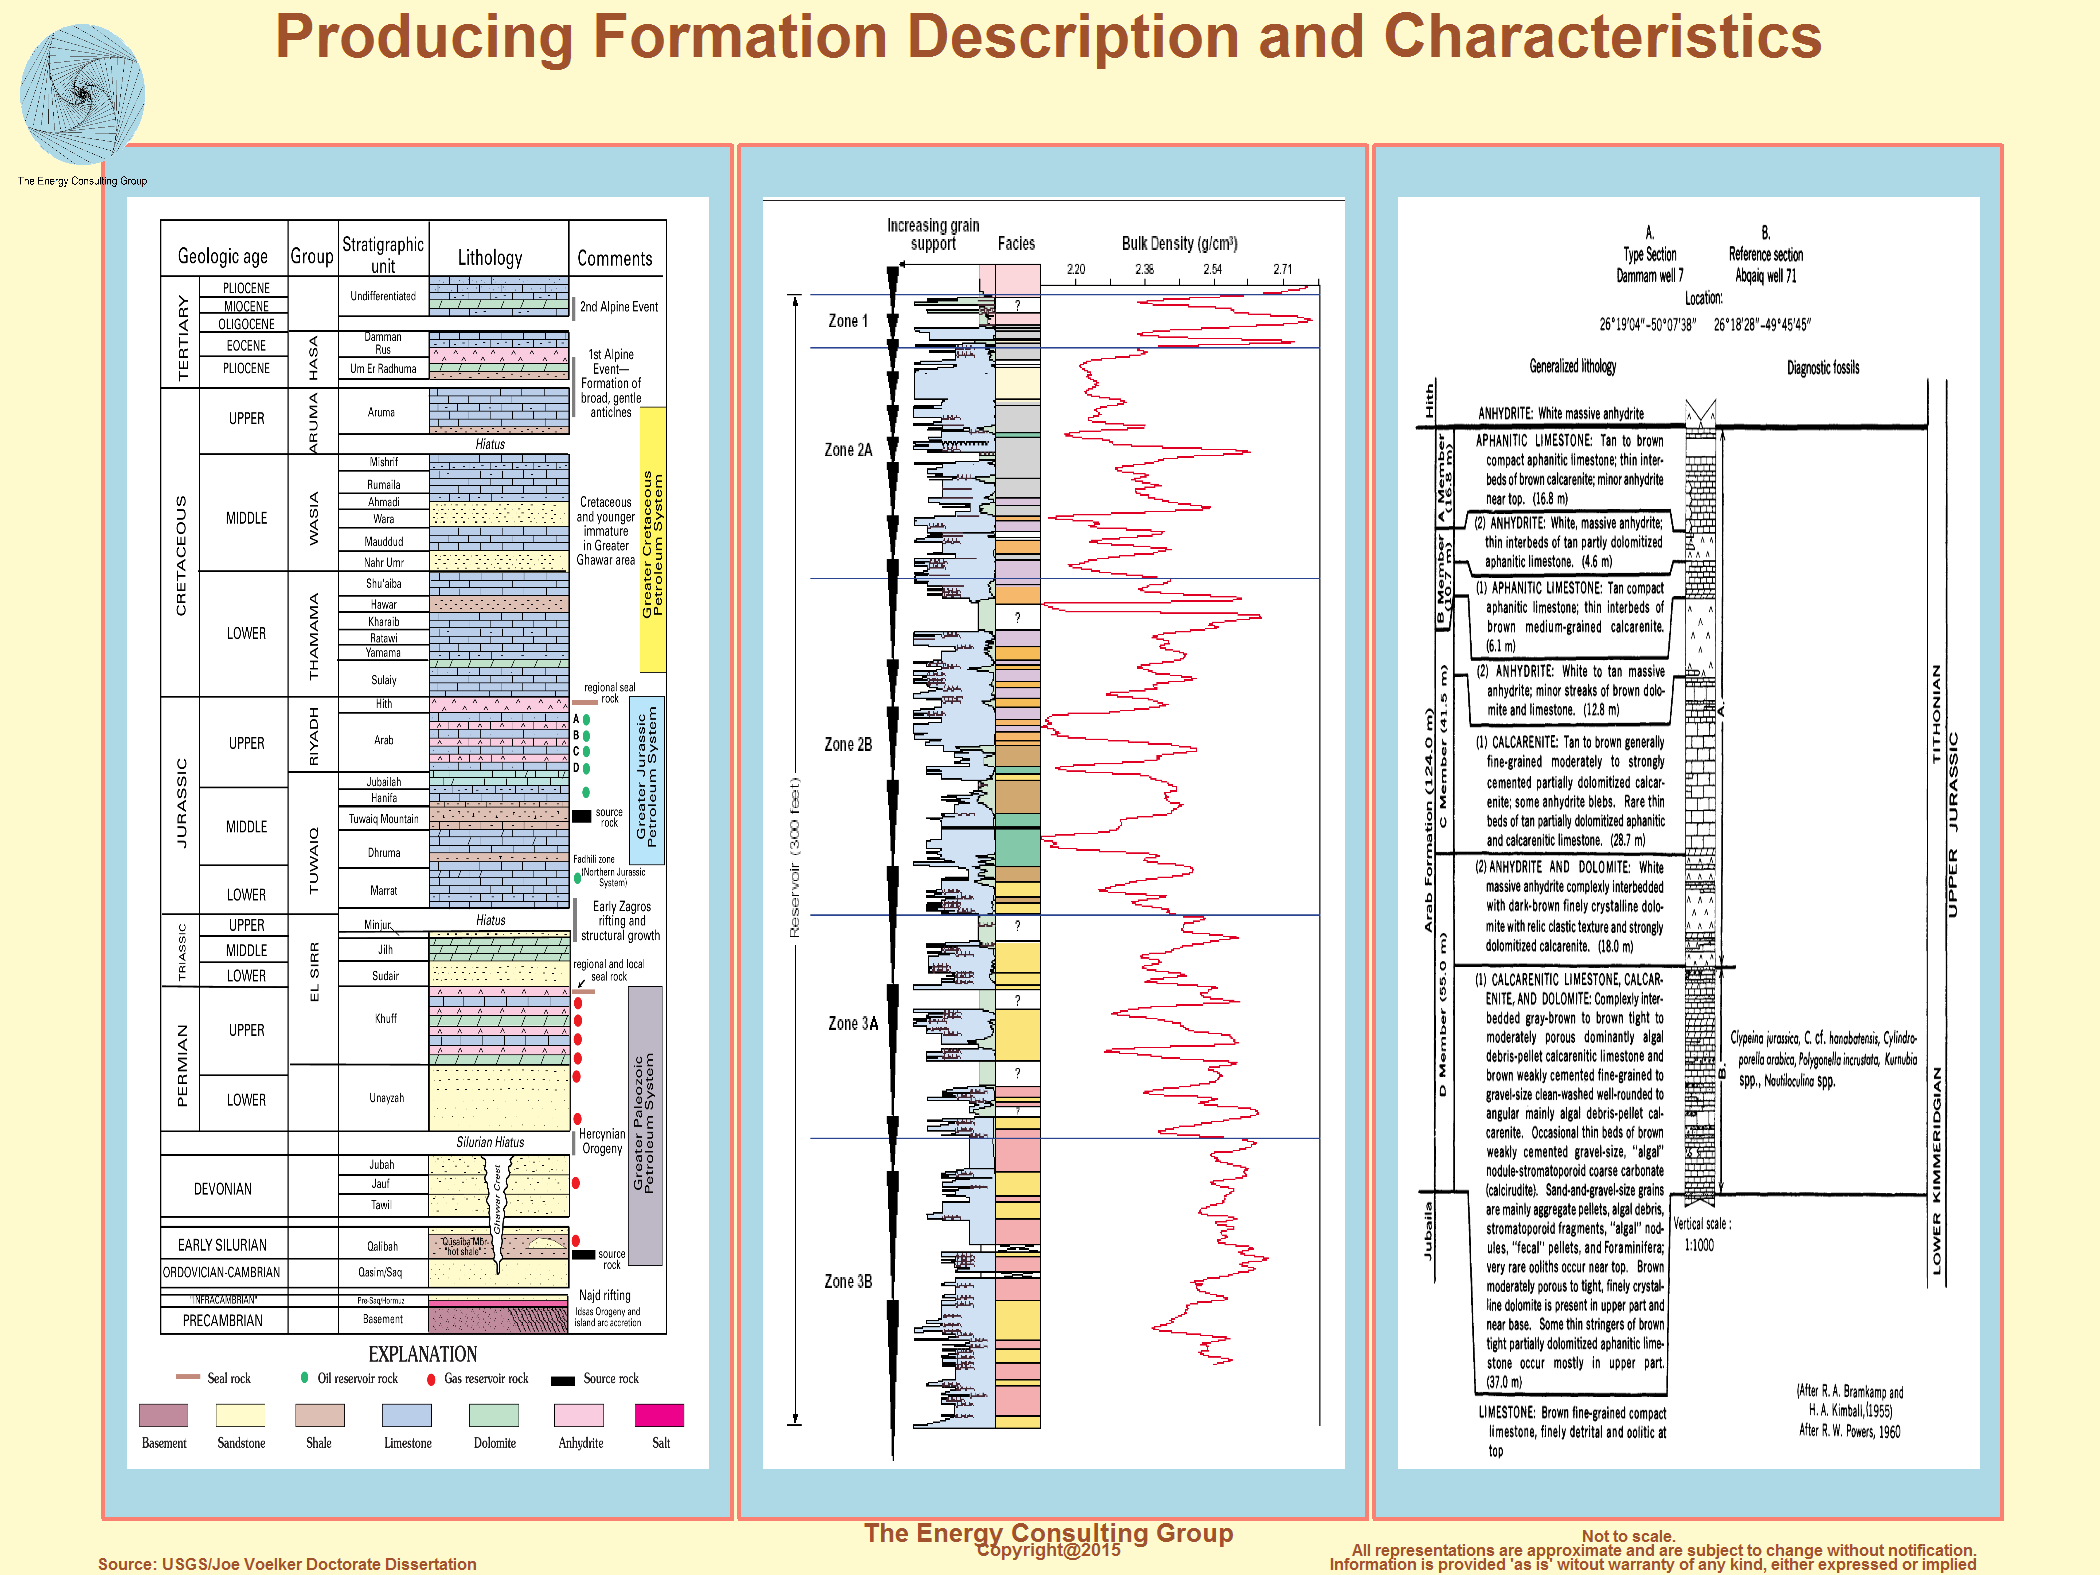 Click on image for higher resolution image. |
Jurassic Arab D Type Log Click on image for higher resolution image. |
Average Reservoir Characteristics for the Main Reservoir
At Ghawar at the Site of the Different Discovery Wells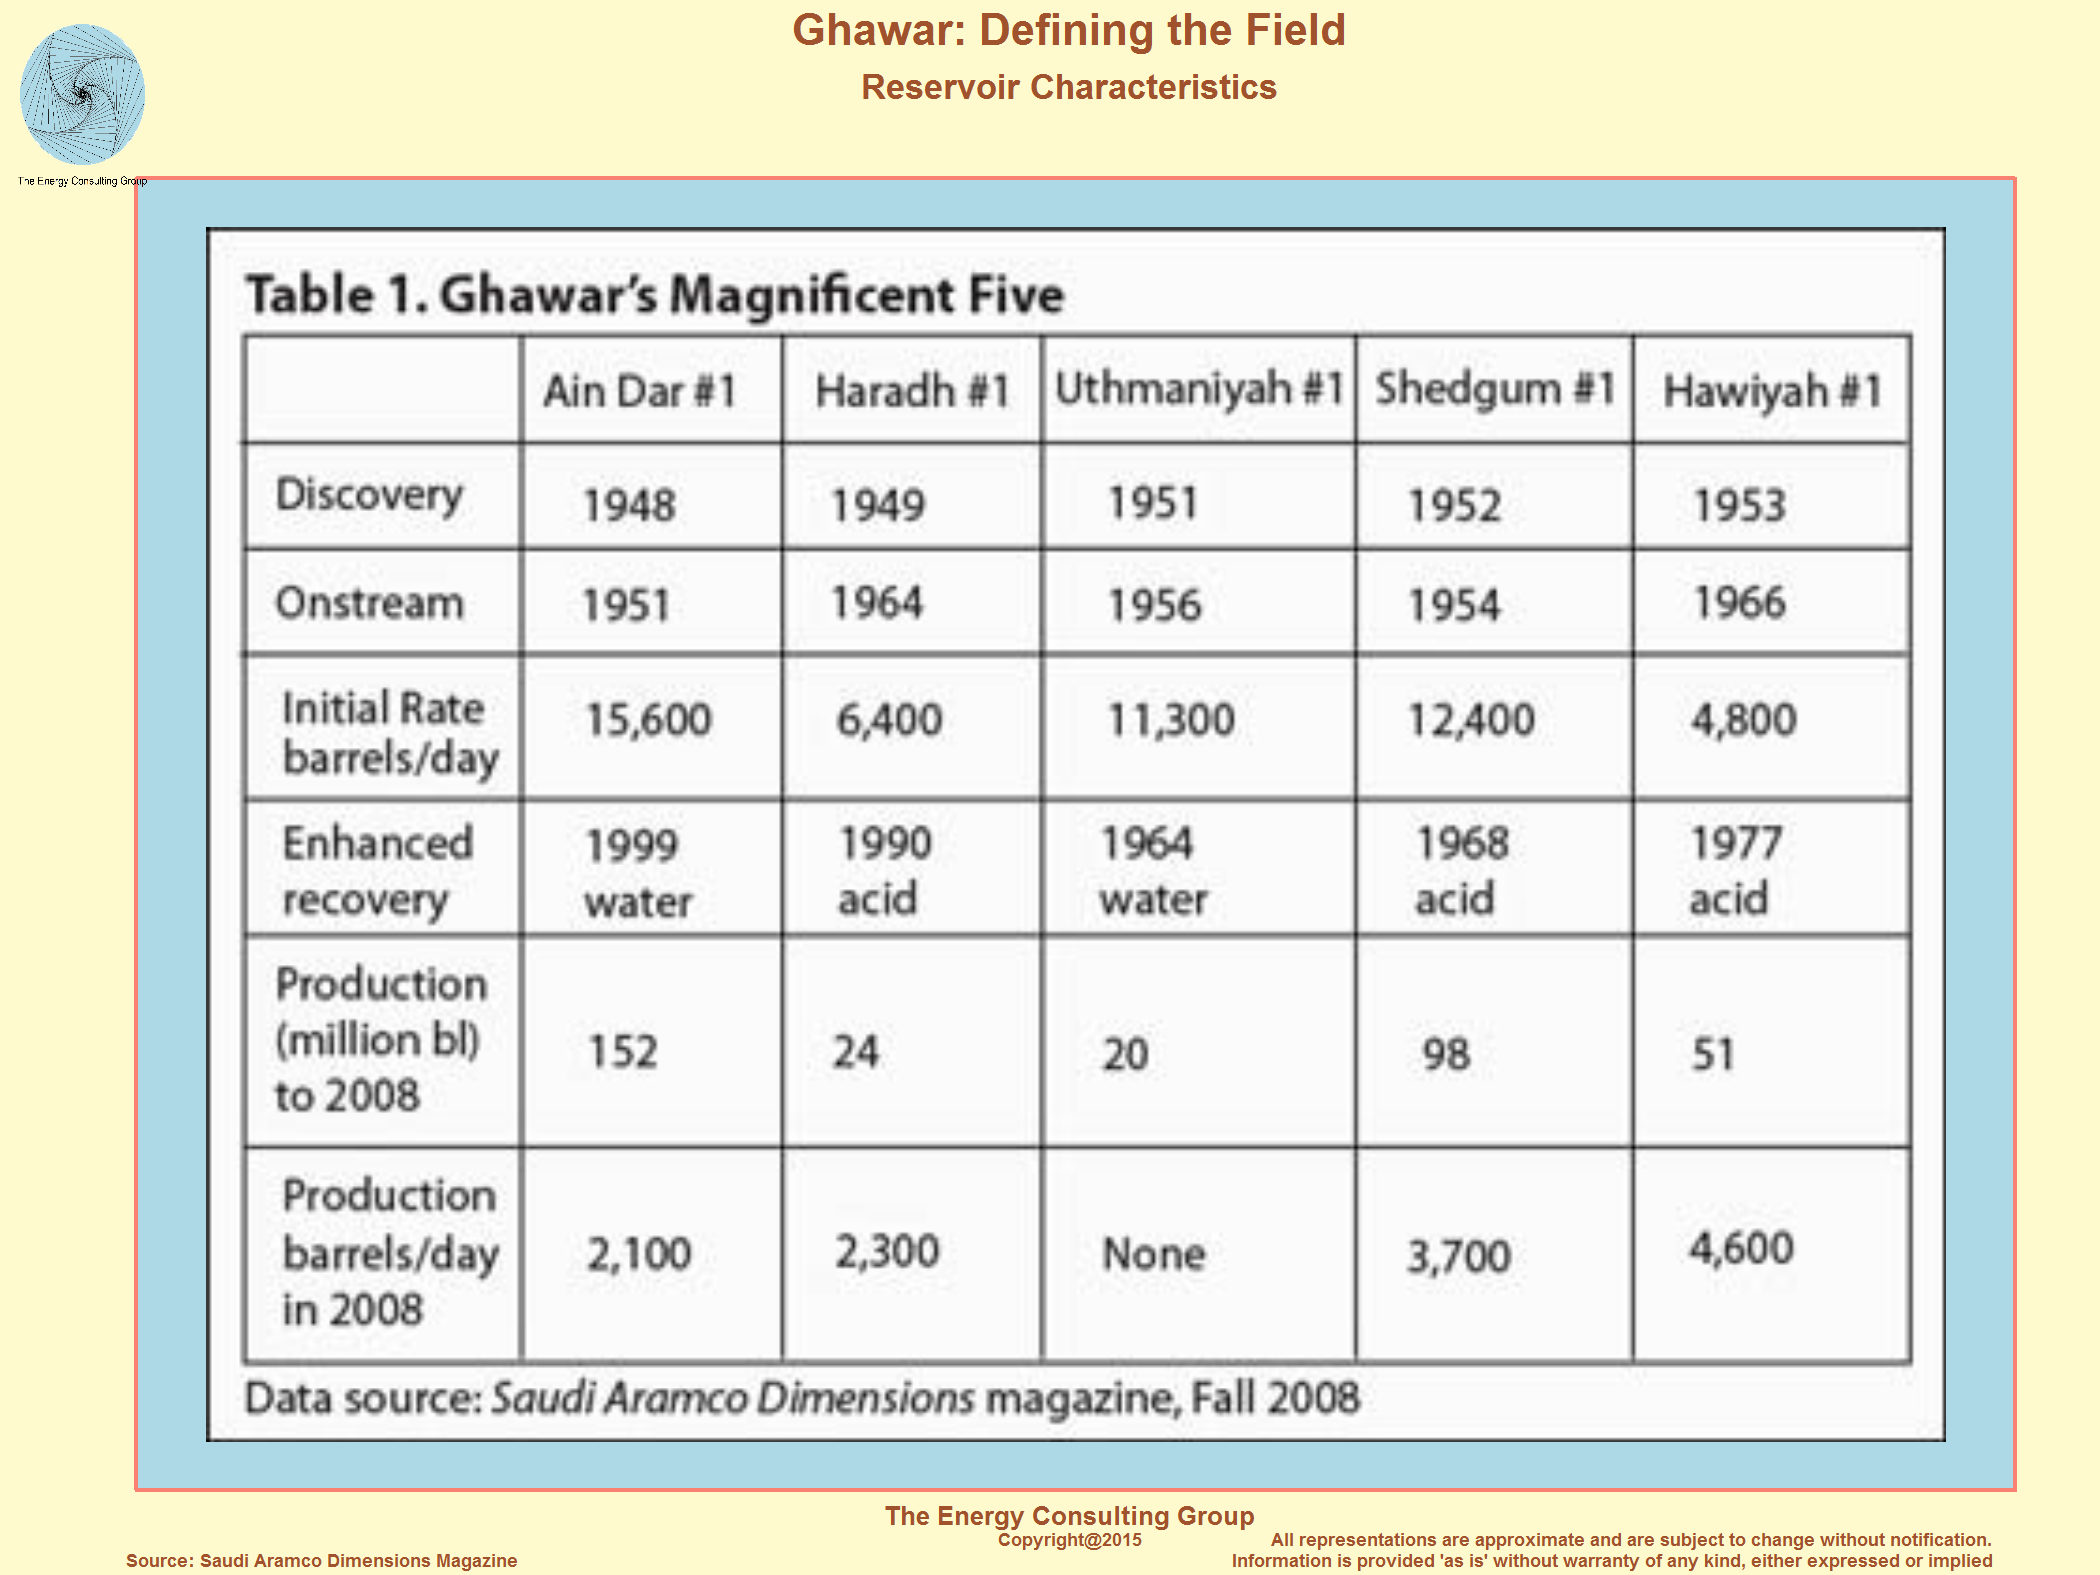 Click on image for higher resolution image. |
Ghawar Water Cut 1993-2003 Please contact us for updated numbers.  Click on image for higher resolution image. |
Saudi Aramco's view of the Ghawar's reserve potential and its
state of depletion via an assessment of the Ain Dar/Shedgum
areas of Ghawar Click on image for higher resolution image. |
|
| The following panel contains an illustrative, interactive 3D subsurface structure map of Ghawar. It is intended to help provide geographic context for the Ghawar discussion. To use the map, rotate it using the left mouse button, zoom using the mouse wheel, and control the viewing perspective using the right mouse button. |
Link to full screen version the rotatable, zoomable 3D oil and gas map of Ghawar.
The Energy Consulting Group home page