The Energy Consulting Group
Management consultants for upstream oil and gas producers and service companies
|
Illustrative Example of the ECG US Natual Gas Supply Curve (Note: This is provided for illustrative purposes only, and as such incorporates notional data. Please contact us at insight@energy-cg.com to inquire about ECG's current shale gas cost analysis and gas supply curve.) 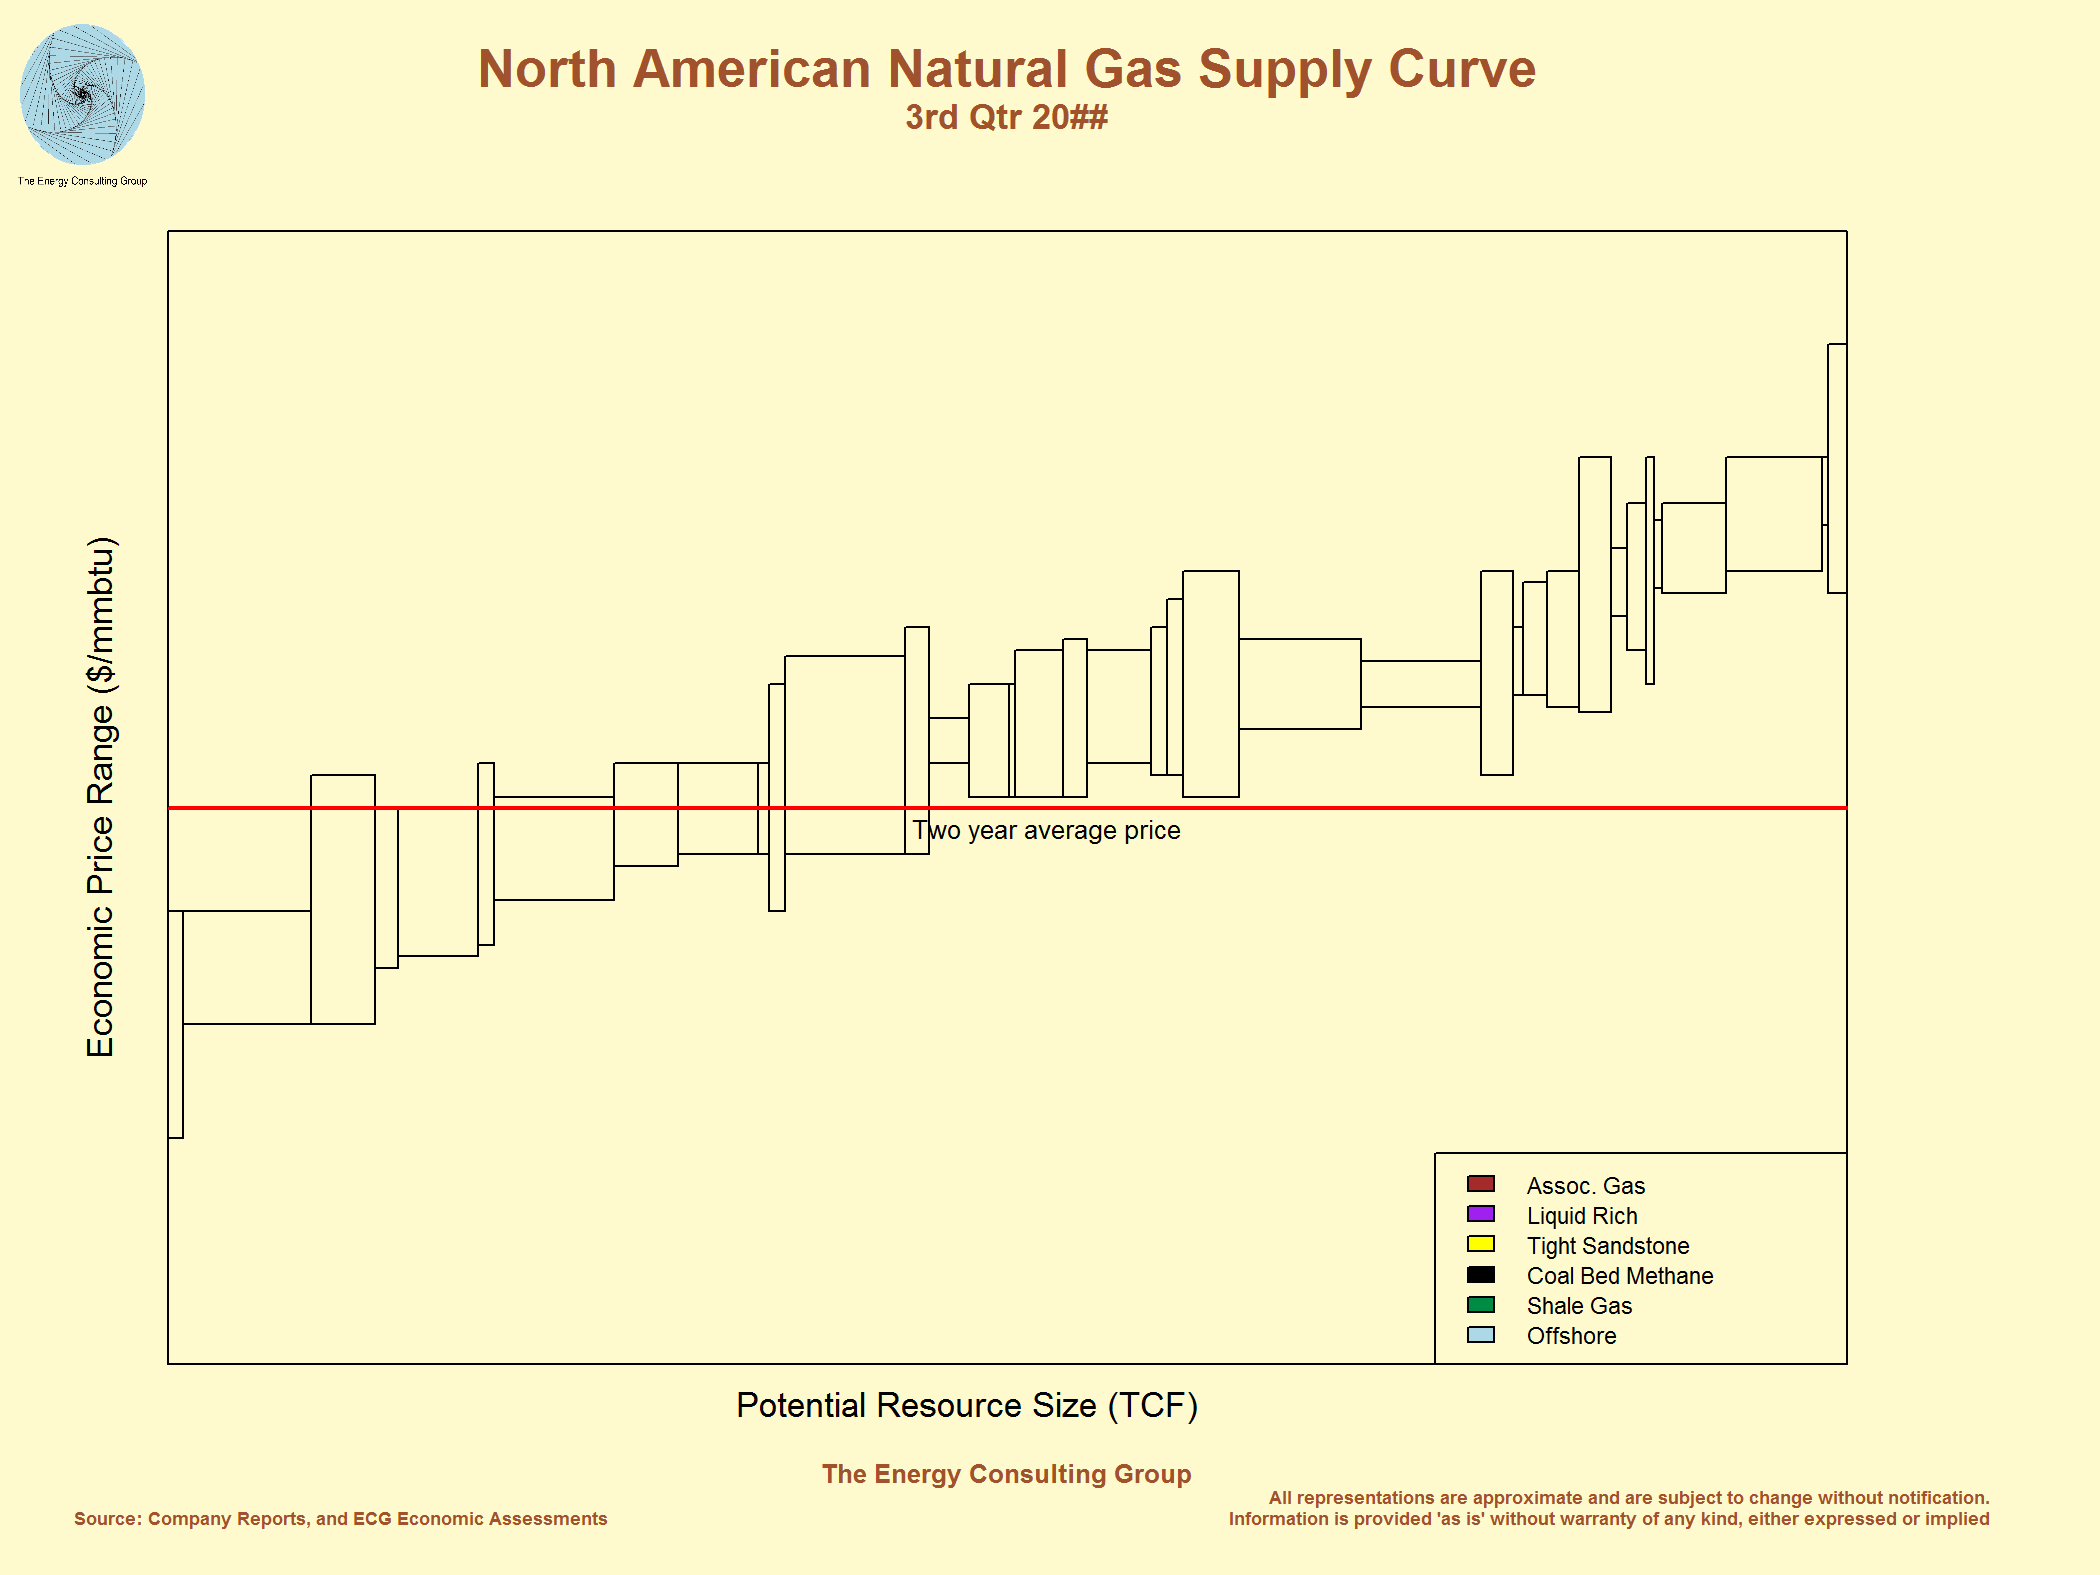 Click on the image for full size, higher resolution version. Note: each block represents our assessment of the amount of resources avaliable in specific plays that meet a particular ROR hurdle rate over the price range defined by the top and bottom of each box. Examples of specific plays are sw PA dry Marcellus, Haynesville, and the Williams Fork in western CO, plus many more. |
Illustrative Example of the ECG North American
Oil Supply Curve (Note: This is provided for illustrative purposes only, and as such incorporates notional data. Please contact us at insight@energy-cg.com to inquire about ECG's current shale oil cost analysis and oil supply curve.) 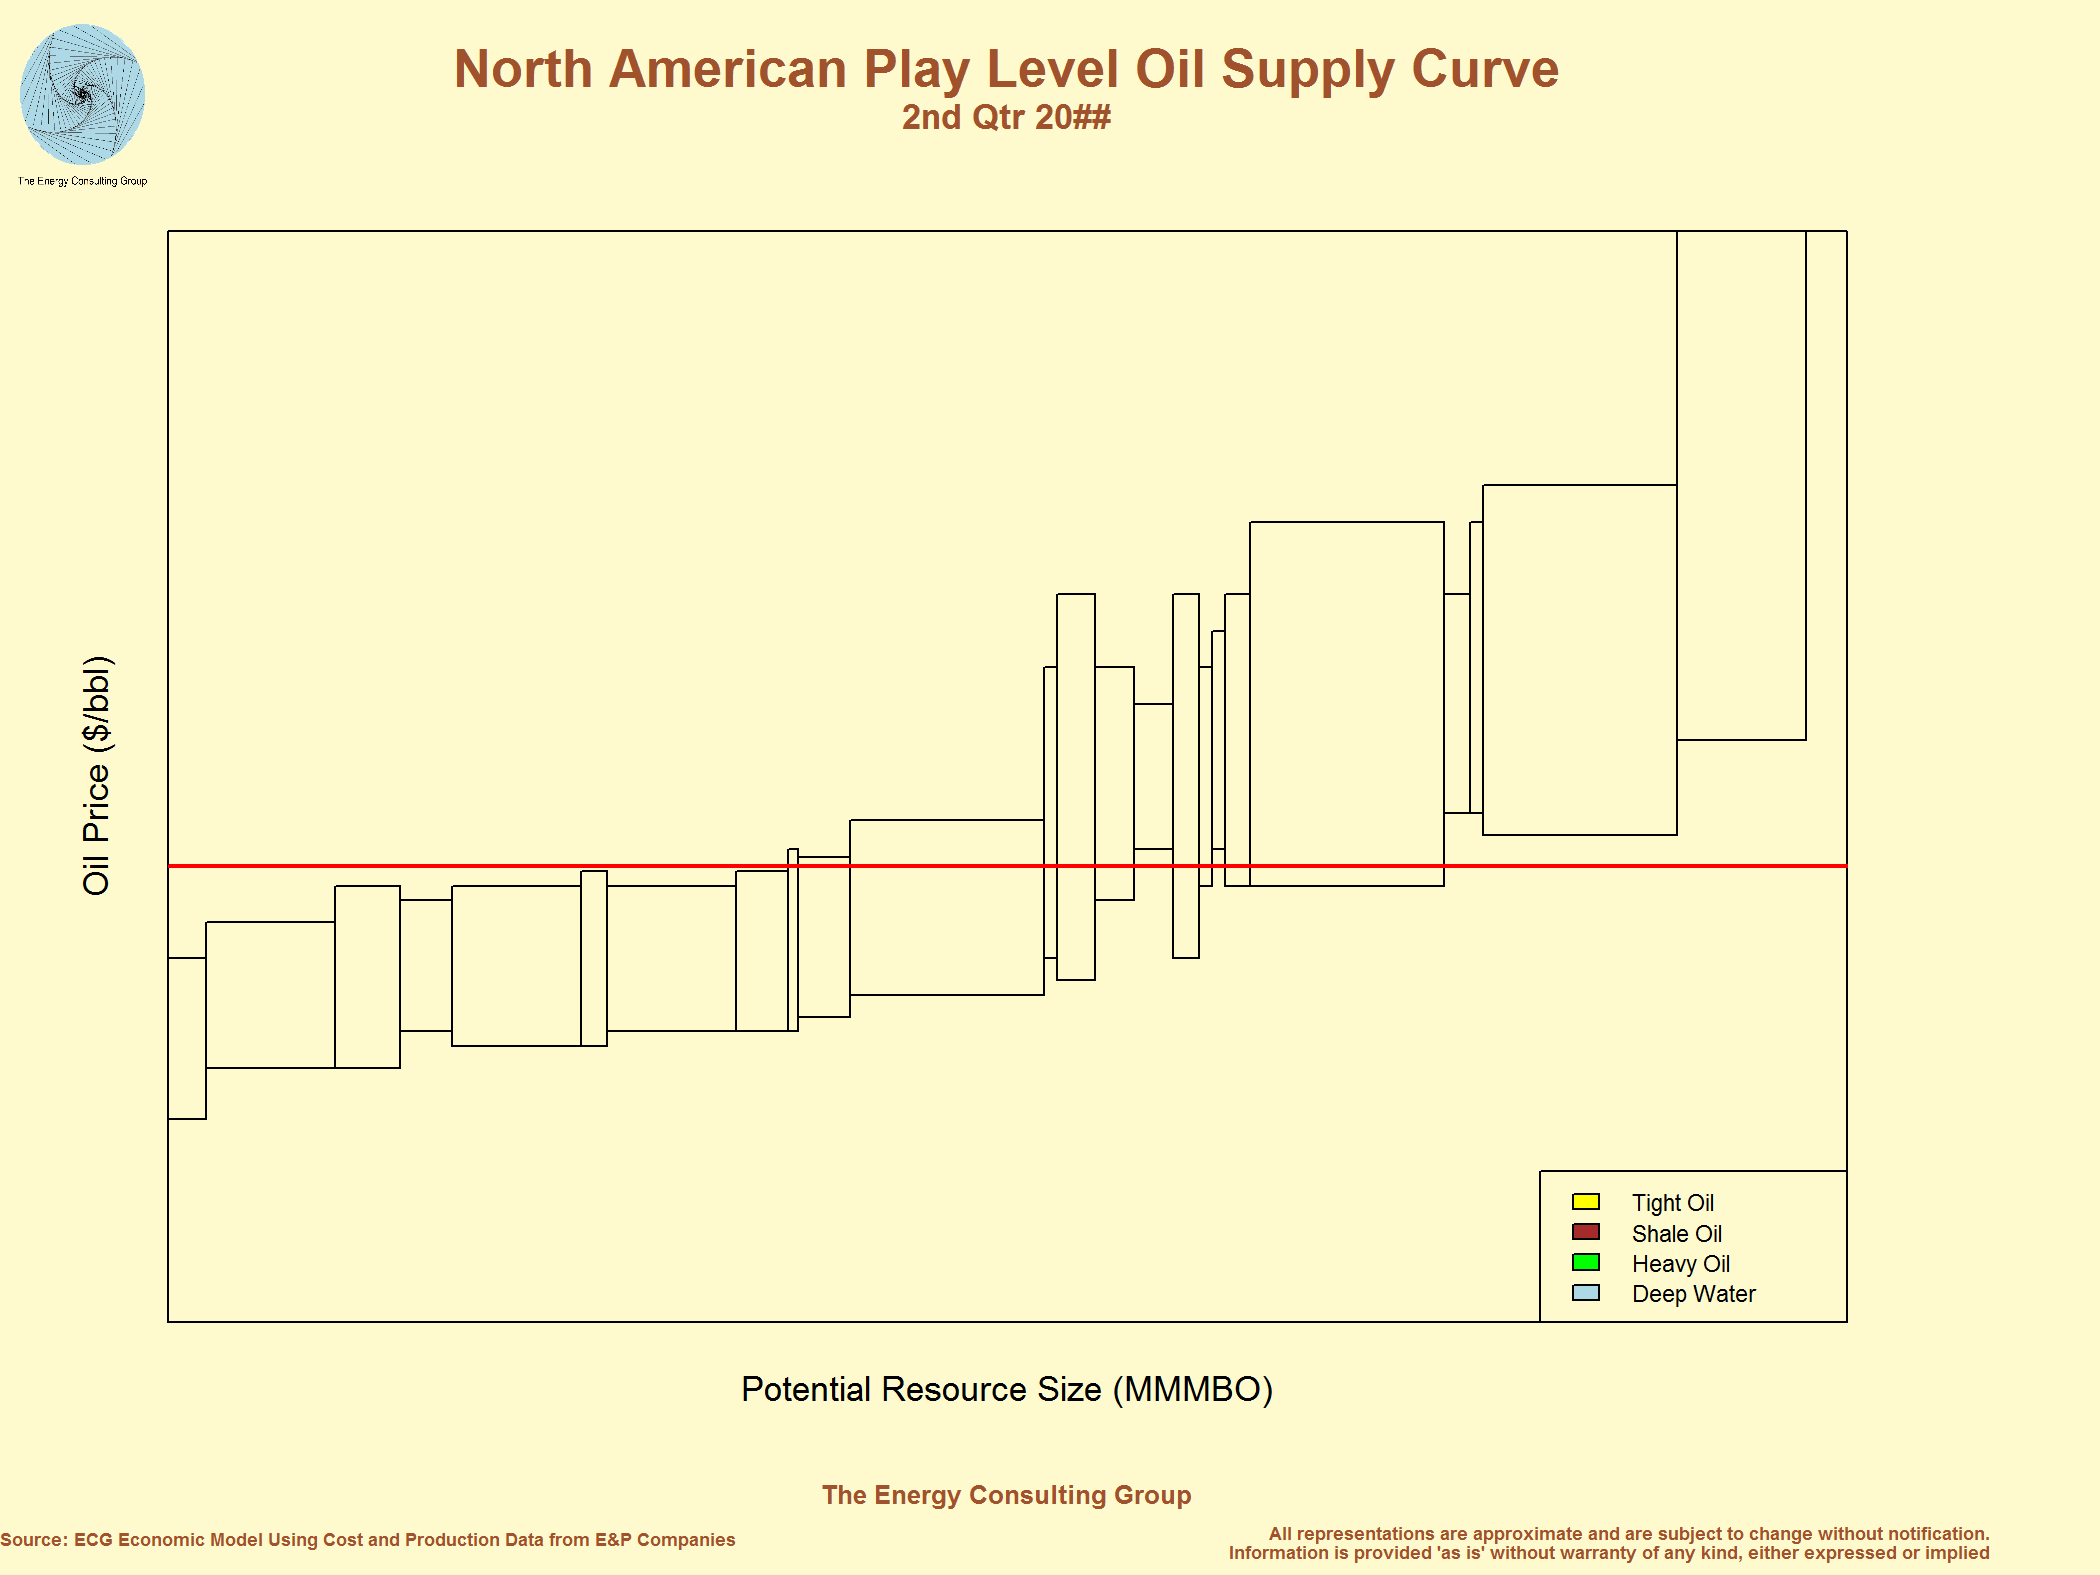 Click on the image for full size, higher resolution version. Note: each block represents our assessment of the amount of resources avaliable in specific plays that meet a particular ROR hurdle rate over the price range defined by the top and bottom of each box. Examples of specific plays are Delware Basin Wolfcamp A, North Dakota Bakken, and the emerging Powder River Basin shale plays, plus many more. |
For the past 15 years, a significant portion of our work has involved understanding the economics (rates of return, net present value, payouts, investment efficiency, etc.) of the E&P industry and then communicating that understanding to our clients to help them as they acquire and divest assets, invest in oil and gas wells and projects, and develop flexible and useful business strategies to serve the North American oil and gas sector. We have done this by using our proprietary EVAL economic analysis tool, which allows us to generate comparable economics for all asset types, including the main shale plays, deepwater, carbon capture and sequestration, coal bed methane, tight gas, new waterfloods, etc., as well as the main companies involved in exploiting those plays. We are presenting some of that work in a general form below. (Go here for a detailed discussion regarding the economics of shale plays.) Crucially, this normalization allows for direct comparison of the economics between different oil and gas investment opportunities, be they wells, projects, plays and companies, and allows us to determine the cost of supply and to develop classic oil and gas supply curves (amongst other uses), and to specify where the different plays, regions, and companies sit on those supply curves.
By way of example, in the exhibits presented at the top of this page, "North American Natural Gas Supply Curve" and "North American Play Level Oil Supply Curve", the "average" economics of over 60 different US based oil and gas plays are presented. The curves represent detailed analysis by the Energy Consulting Group of each of these plays in terms of costs and revenues. The plays covered include not only all the major shale gas and light, tight oil plays, but also a variety of "conventional" onshore, offshore and deepwater developments. Development costs (F, D, C, and E)* and operating costs are usually based on information provided by operators, but ECG also uses proprietary estimates derived from our knowledge of such costs gleaned from working projects in a particular area. In addition to standard lease operating expenses (LOE), the operating costs include transportation and processing fees.
* F-finding; D-development; C-completion; and E-equipping
Because our well cost and well performance databases stretch across multiple decades,
another application for this work is its use in understanding how the cost
curves have evolved over time, and crucially, the role and economic value
delivered by different technological developments (e.g. new drilling rig
designs, PDC bits, RSS, plug and perf (PnP) fracking vs swell packers, slick
waters vs gels, electric vs diesel vs dual fuel frac fleets, etc.). This
understanding of the technological/cost evolution of the shales is essential to
answering two of the most common questions we get asked: 1) How much
lower can the cost to develop the shales go? and 2) How much oil and gas
can be developed using the core non-conventional resource play technologies of
horizontal drilling and multistage fracing?
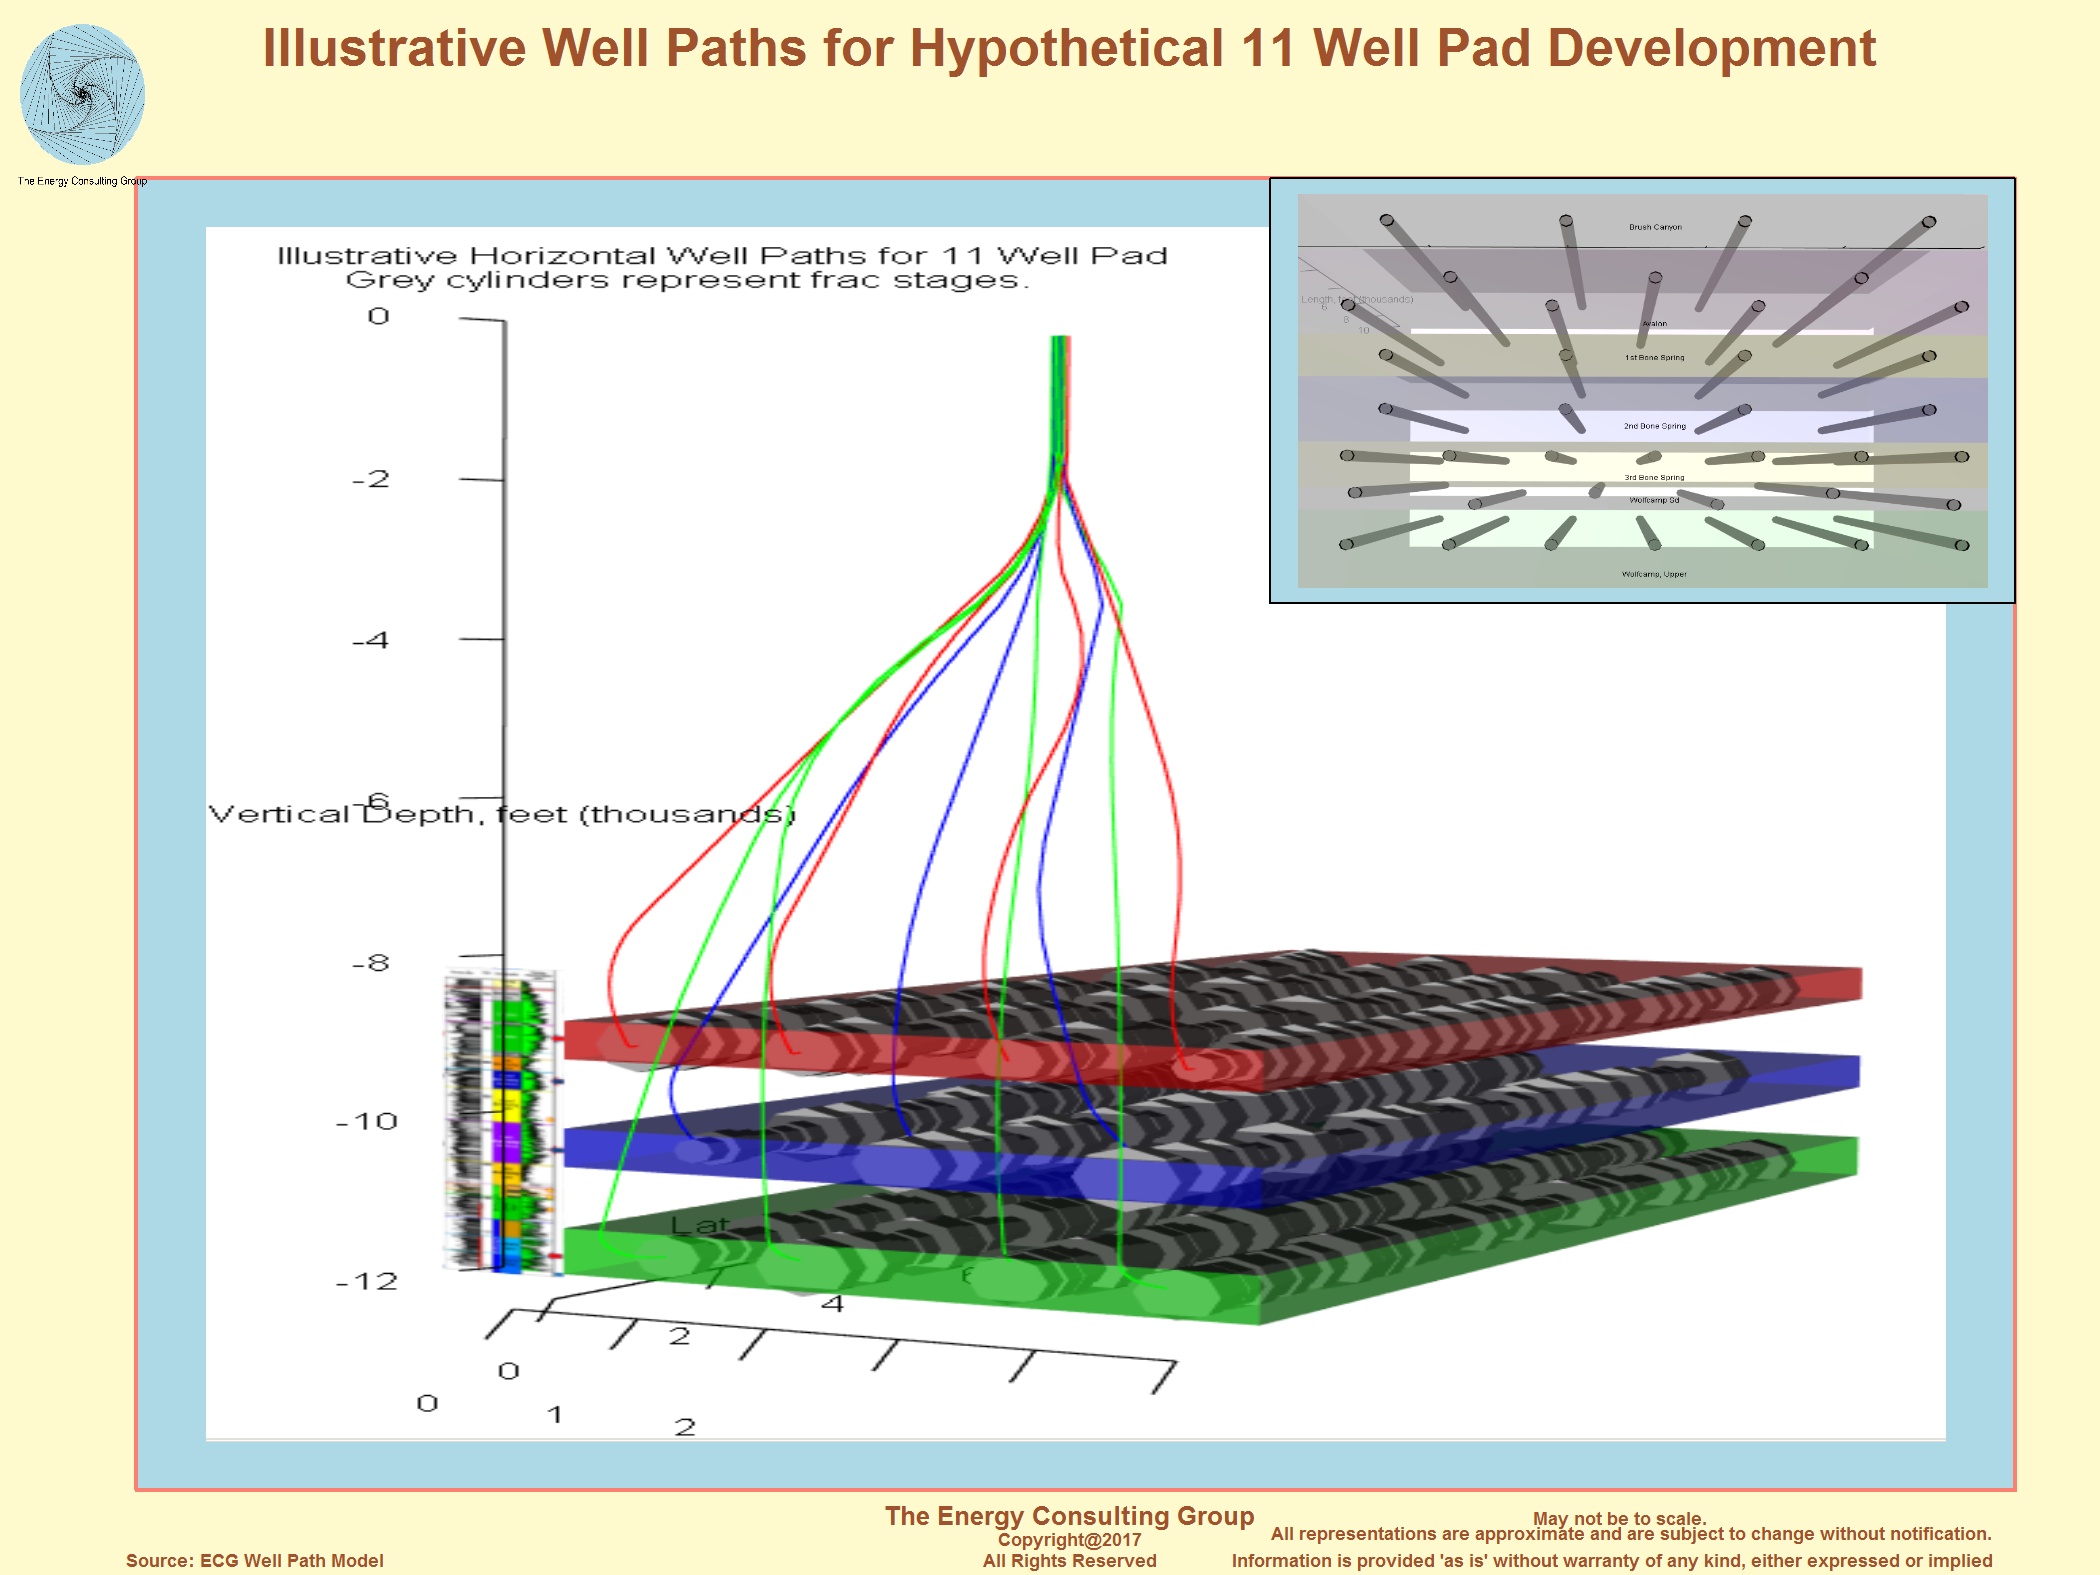
Illustrative Example: Impact of New Drilling Technology on Efficiency
of Shale Development

Click on Image To Expand
New and better technology changed how shale
wells were drilled and completed.

Click on Image To Expand

Click on Image To Expand
Click on Image To Expand
Revenue estimates are
based on a combination of potential production volumes, and oil and gas price
scenarios. Typically, we use basis adjusted, flat oil and gas price
scenarios, though, depending on need, we can use inflation adjusted numbers or
forward strips in which oil and gas prices vary monthly. The production curves for the tight oil and
shale gas plays have a general shape similar to that presented in the exhibit
below titled, "Generic Shale Play Production Profile". The dominant
characteristic is the "steep" initial decline, which, depending on the play and
completion design, can range from 50%-80% the first year. Some have questioned
the economic viability of these non-conventional plays given such declines.
However, our economic analysis across literally dozens of plays dependent upon
horizontal wells and multistage fracing clearly indicates economic viability,
indeed, strength, for many wells and plays at reasonable levels of oil and gas
pricing. The reason is simple: though declines are "high", so usually are
initial rates, which generally translates into economically
viable production
volumes in the crucial early years of the life of a well.
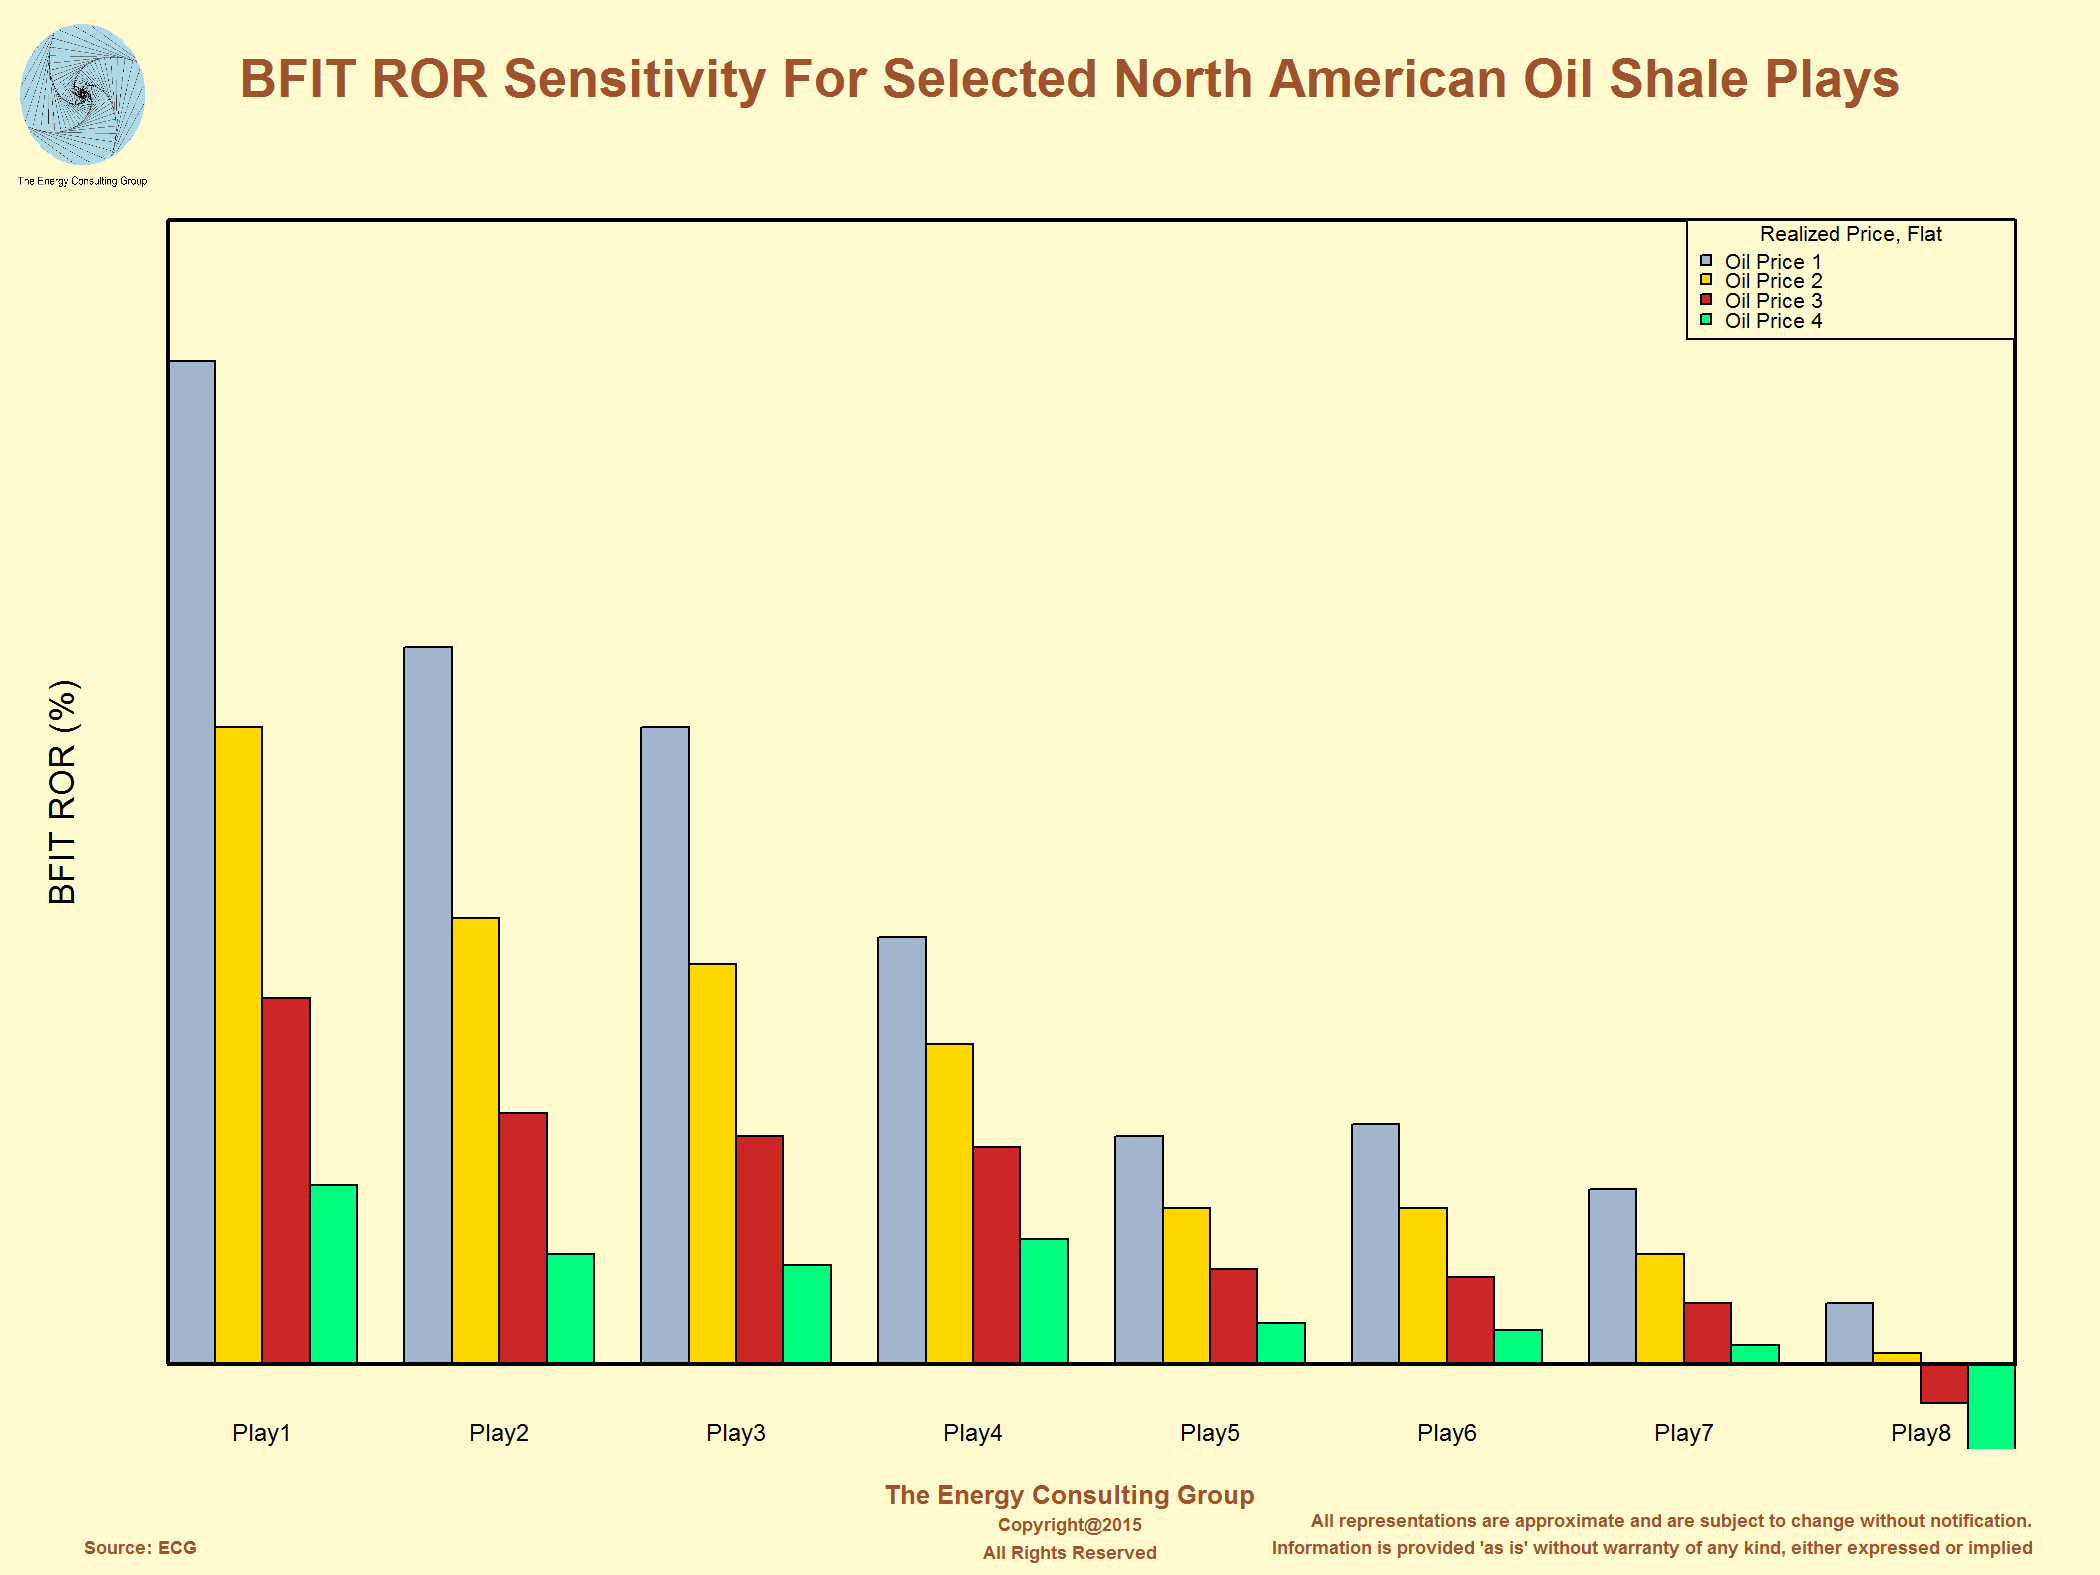
BFIT ROR Sensitivity For Selelcted North American Oil Shale Plays

Click on Image To Expand
Selected Economics for Nonconventional Plays
By Location - Permian Basin
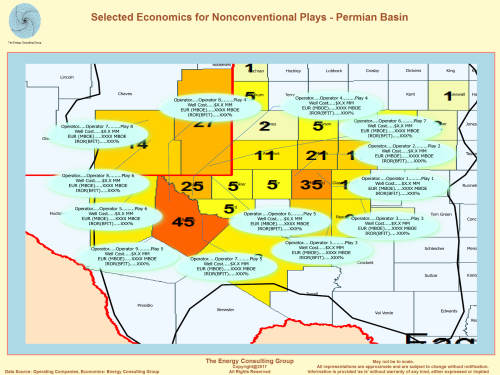
Click on Image To Expand
BFIT ROR Sensitivity For Selelcted North American Oil Shale Plays
Click on Image To Expand
Selected Economics for Nonconventional Plays By Location - Permian Basin
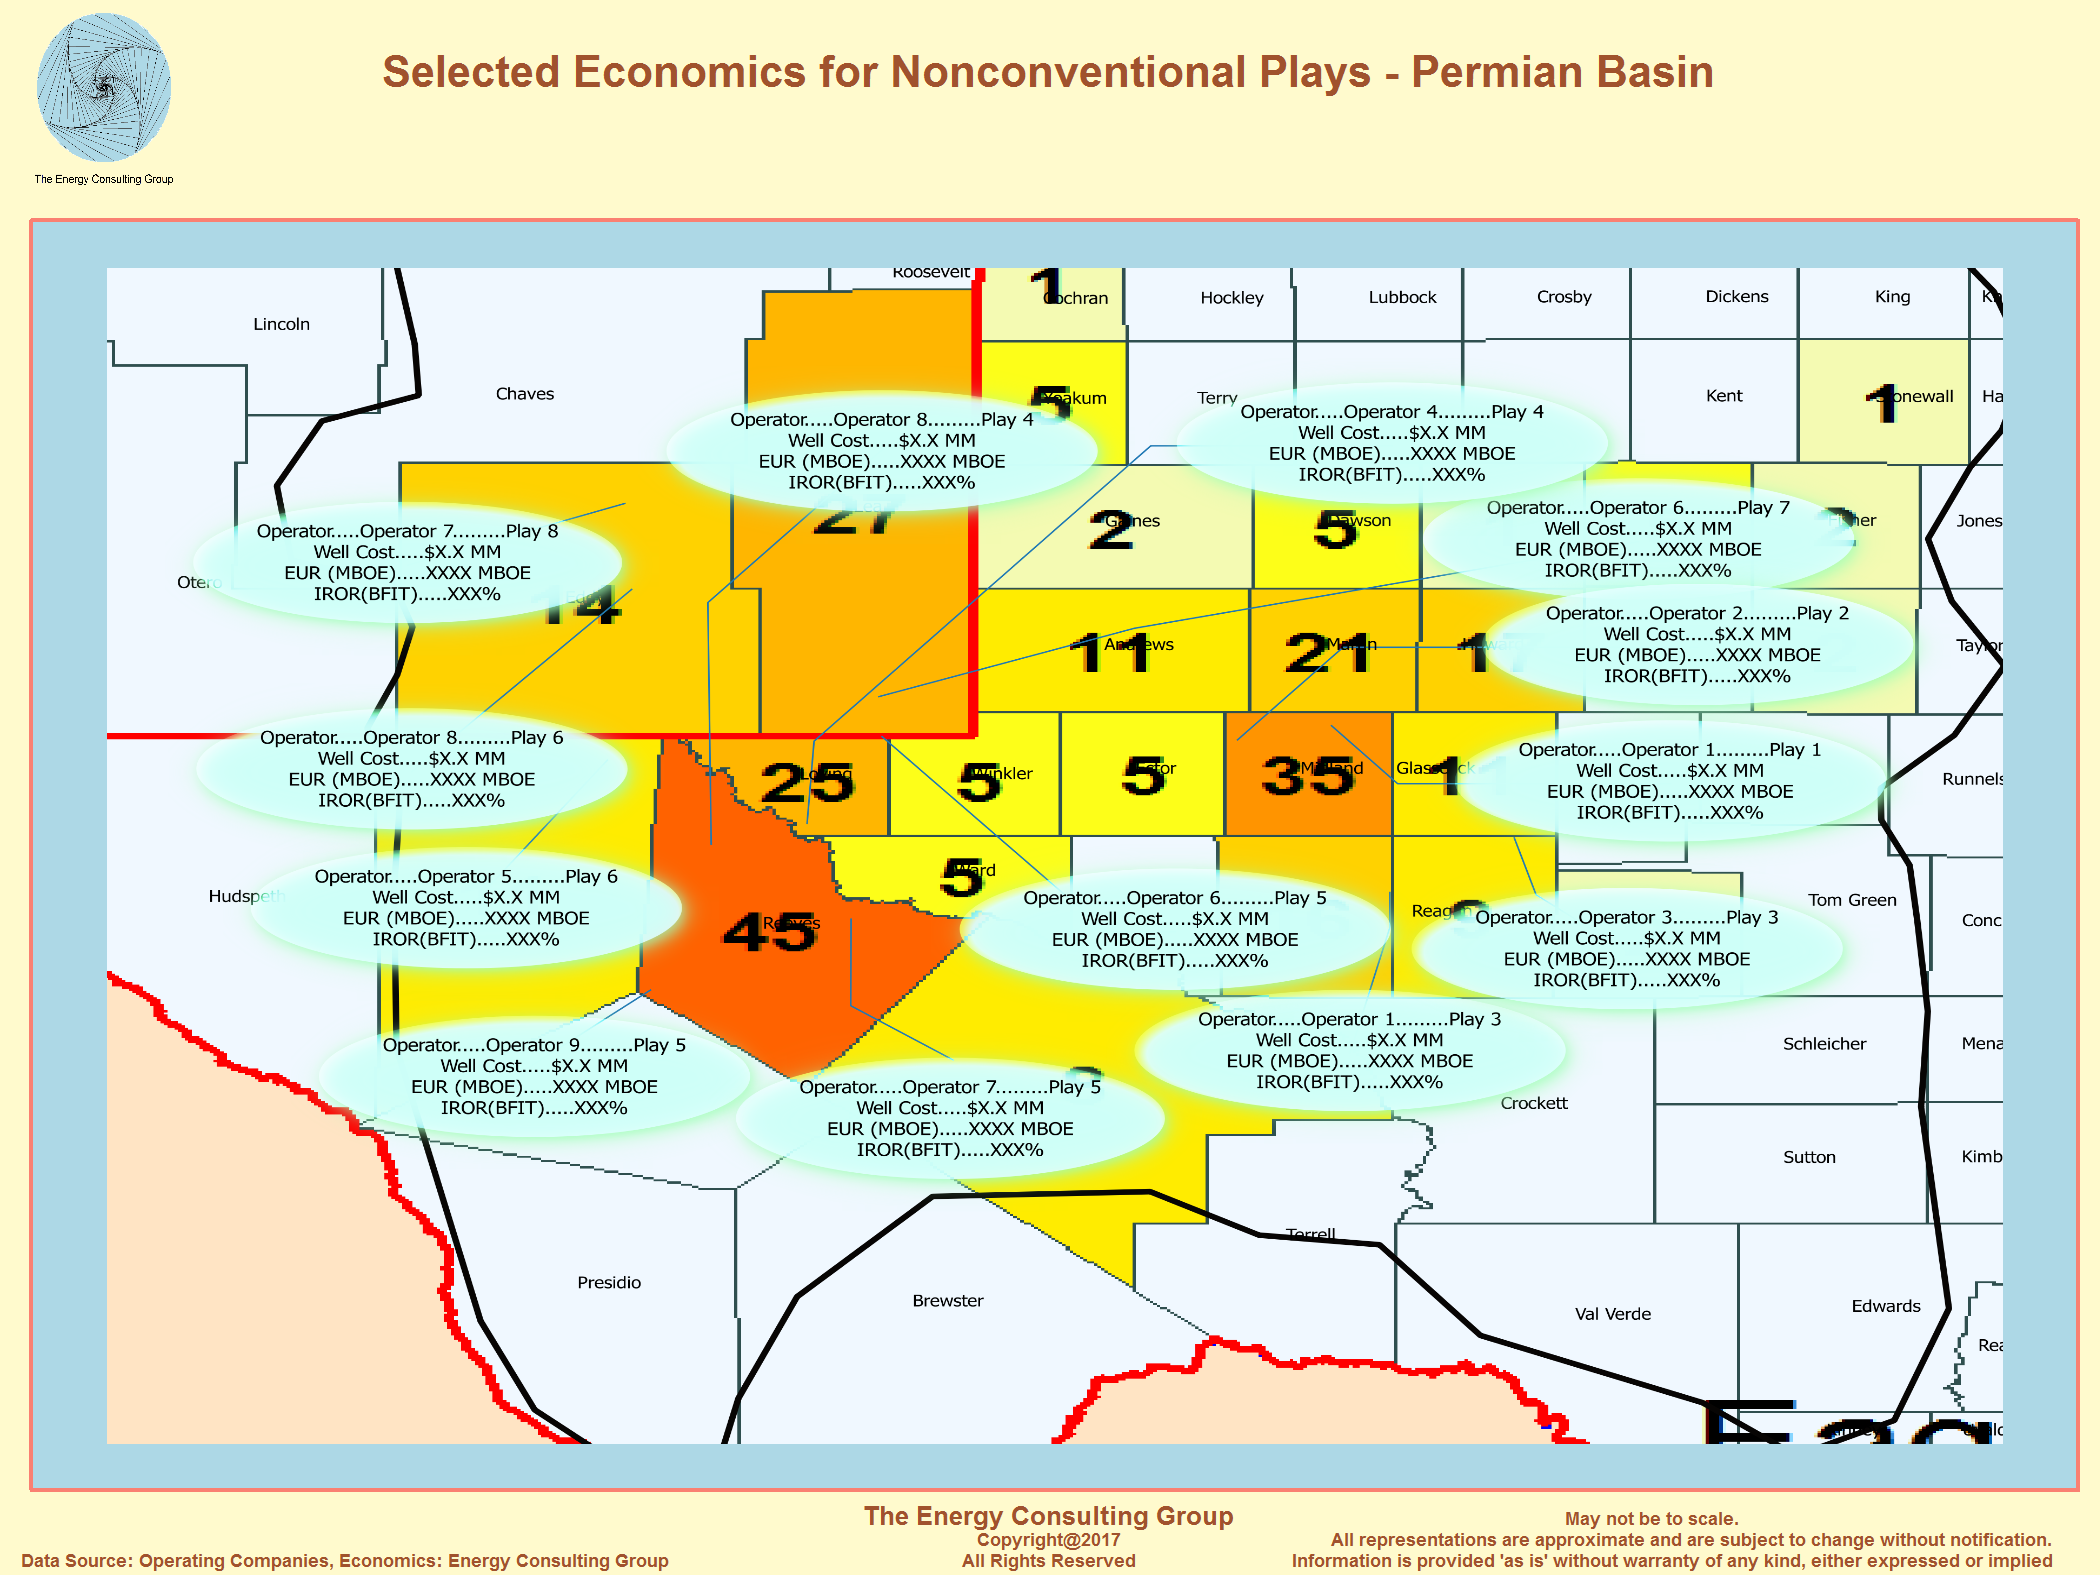
Click on Image To Expand
Please note, the economics presented in the exhibits on this page should not be used for investment decisions. These numbers represent ECG's best assessment of "average" economics and are a blend of results sourced from different operators and our own internal estimates. As such, these economics are not reflective of specific wells or projects, which, even within the same play, can have significantly different economic outcomes. Finally, we use one set of thresholds to define economic success, while others may use different economic criteria. For a more detailed discussion of the economics of oil and gas shale plays, please go here. There, we discuss the statistical basis of the shale plays specifically, and resource plays more generally, and go into considerably more detail on how the unique character of shale plays shapes the economics in comparison to "conventional" and deepwater plays.
|
|
|
|
|
===========================================================================================================================================================
The generic shale play production profile presented below is illustrative of the literally thousands of such profiles that ECG has prepared for shale play economic analysis. In the course of such analysis, ECG has segmented the major shale gas and tight oil plays by production performance. We have confirmed the reasonableness of the profiles by using a combination of publicly available company reports, and state oil and gas commission data. In ECG's work with private equity firms, and others interested in investing in oil and gas assets, we have found that the ARPS parameters, such as Di and b, generated using the public information agree closely with those derived from data room production data. While the production profiles vary in the specifics of defining features such as initial rates, cumulative recoveries, decline rates, etc. they all share the feature of relatively high initial decline rates before settling over the long term into a relatively low decline production profile. The reservoir physics of why these plays have such profiles are well understood, and so similar production performance is to be expected across the shale plays, but this is not the place to discuss. Please contact us at insight@energy-cg.com for more details, if interested.
Generica Shale Play Production Profile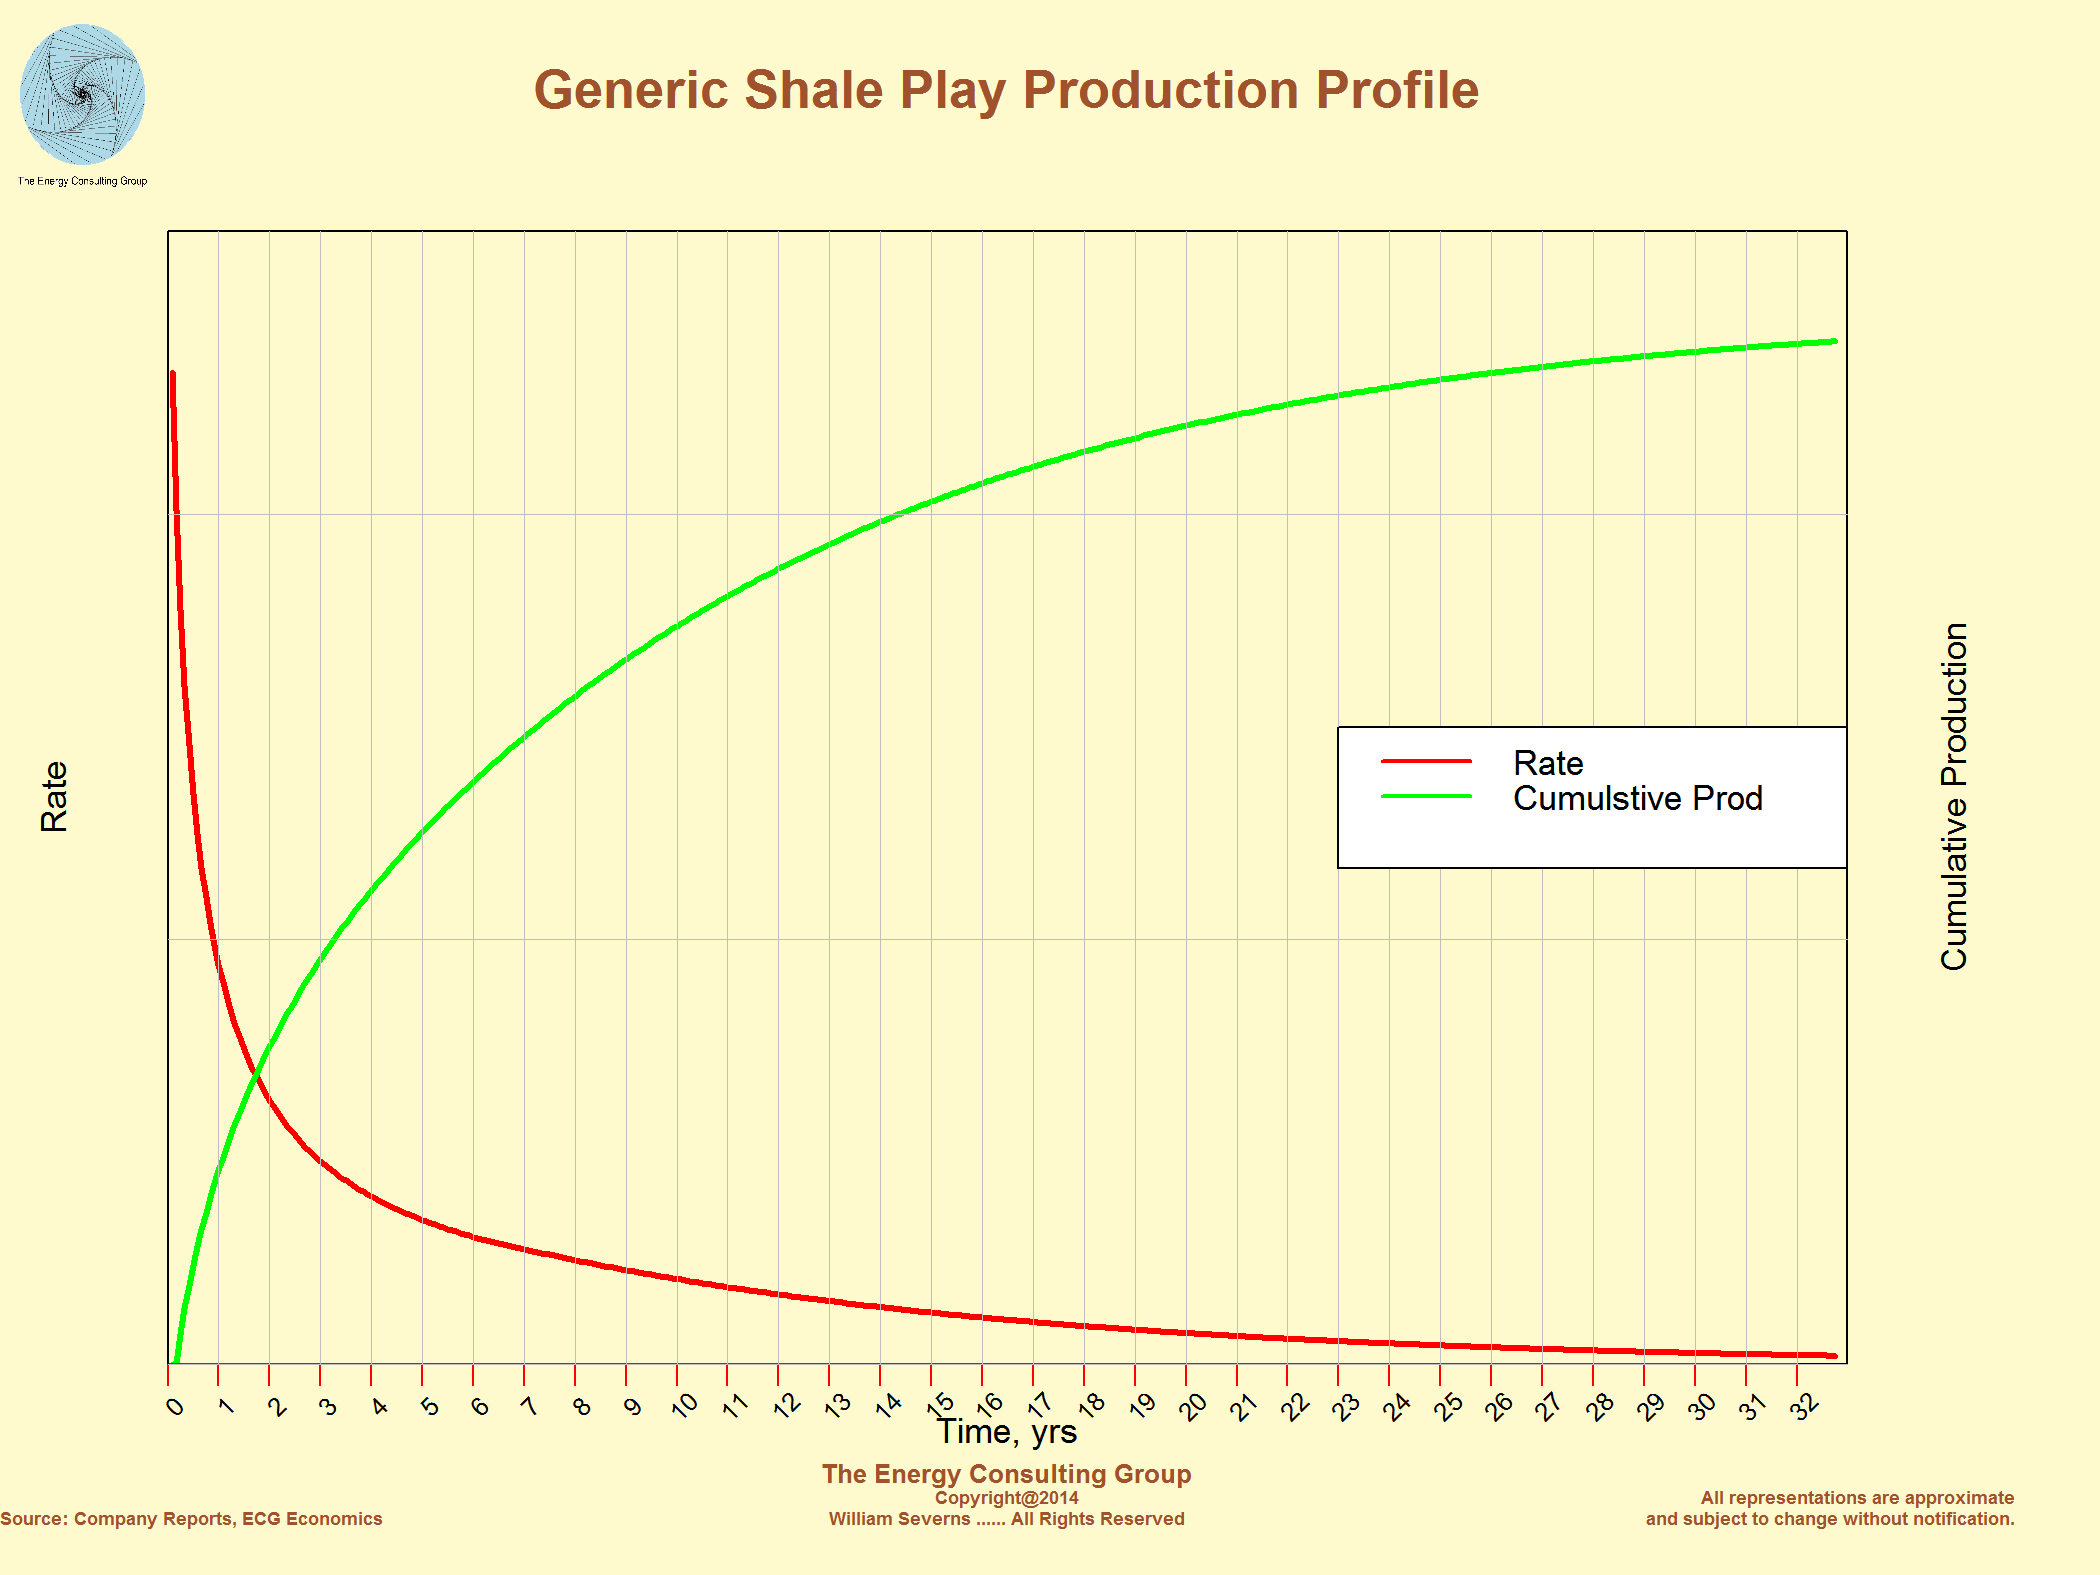 |
Go to The Energy Consulting Group home page for more oil and gas related information.
===========================================================================================================================================================
|
E&P News and Information Scandinavian International and National International Energy
Agency Department of Trade and Norwegian
Petroleum Ministry of Industry
and E&P Project Information |
|---|