The Energy Consulting Group
Management consultants for upstream oil and gas producers and service companies
Our focus is to work with management teams to develop and
implement business strategies that are practical, sustainable and allow
organizations to achieve their full potential. Our consultants have
long histories of working closely with senior executive teams of
firms of all sizes to help their companies not only be successful,
but achieve performance that stands out relative to
peers.
.
Contact Bill at insight@energy-cg.com to
find out how we can help you.
Marcellus-Utica-Upper
Devonian
===========================================================================================================================================================The large Marcellus shale gas accumulation is a mix of dry and wet gas (see the map below, "Marcellus Utica Play Areas"). The most prolific dry gas part of the play is in northeastern Pennsylvania, while the wet gas region is in southwestern Pennsylvania. The four activity maps, listed under, "Evolution of Marcellus-Utica Drilling Activity Over Time", illustrate that much of the initial Marcellus drilling was for dry gas. Infrastructure limitations, especially the initial lack of NGL processing capacity, limited development in the wet gas portion of the play. However, between increased processing capacity and increased export capacity, activity in sw PA has increased substantially over the past 2 1/2 years. In addition, the Utica play in eastern Ohio has emerged as a viable wet gas play, as has the Upper Devonian, which overlies the Marcellus throughout most of sw PA.
Selected North American Tight Oil and Shale Gas Plays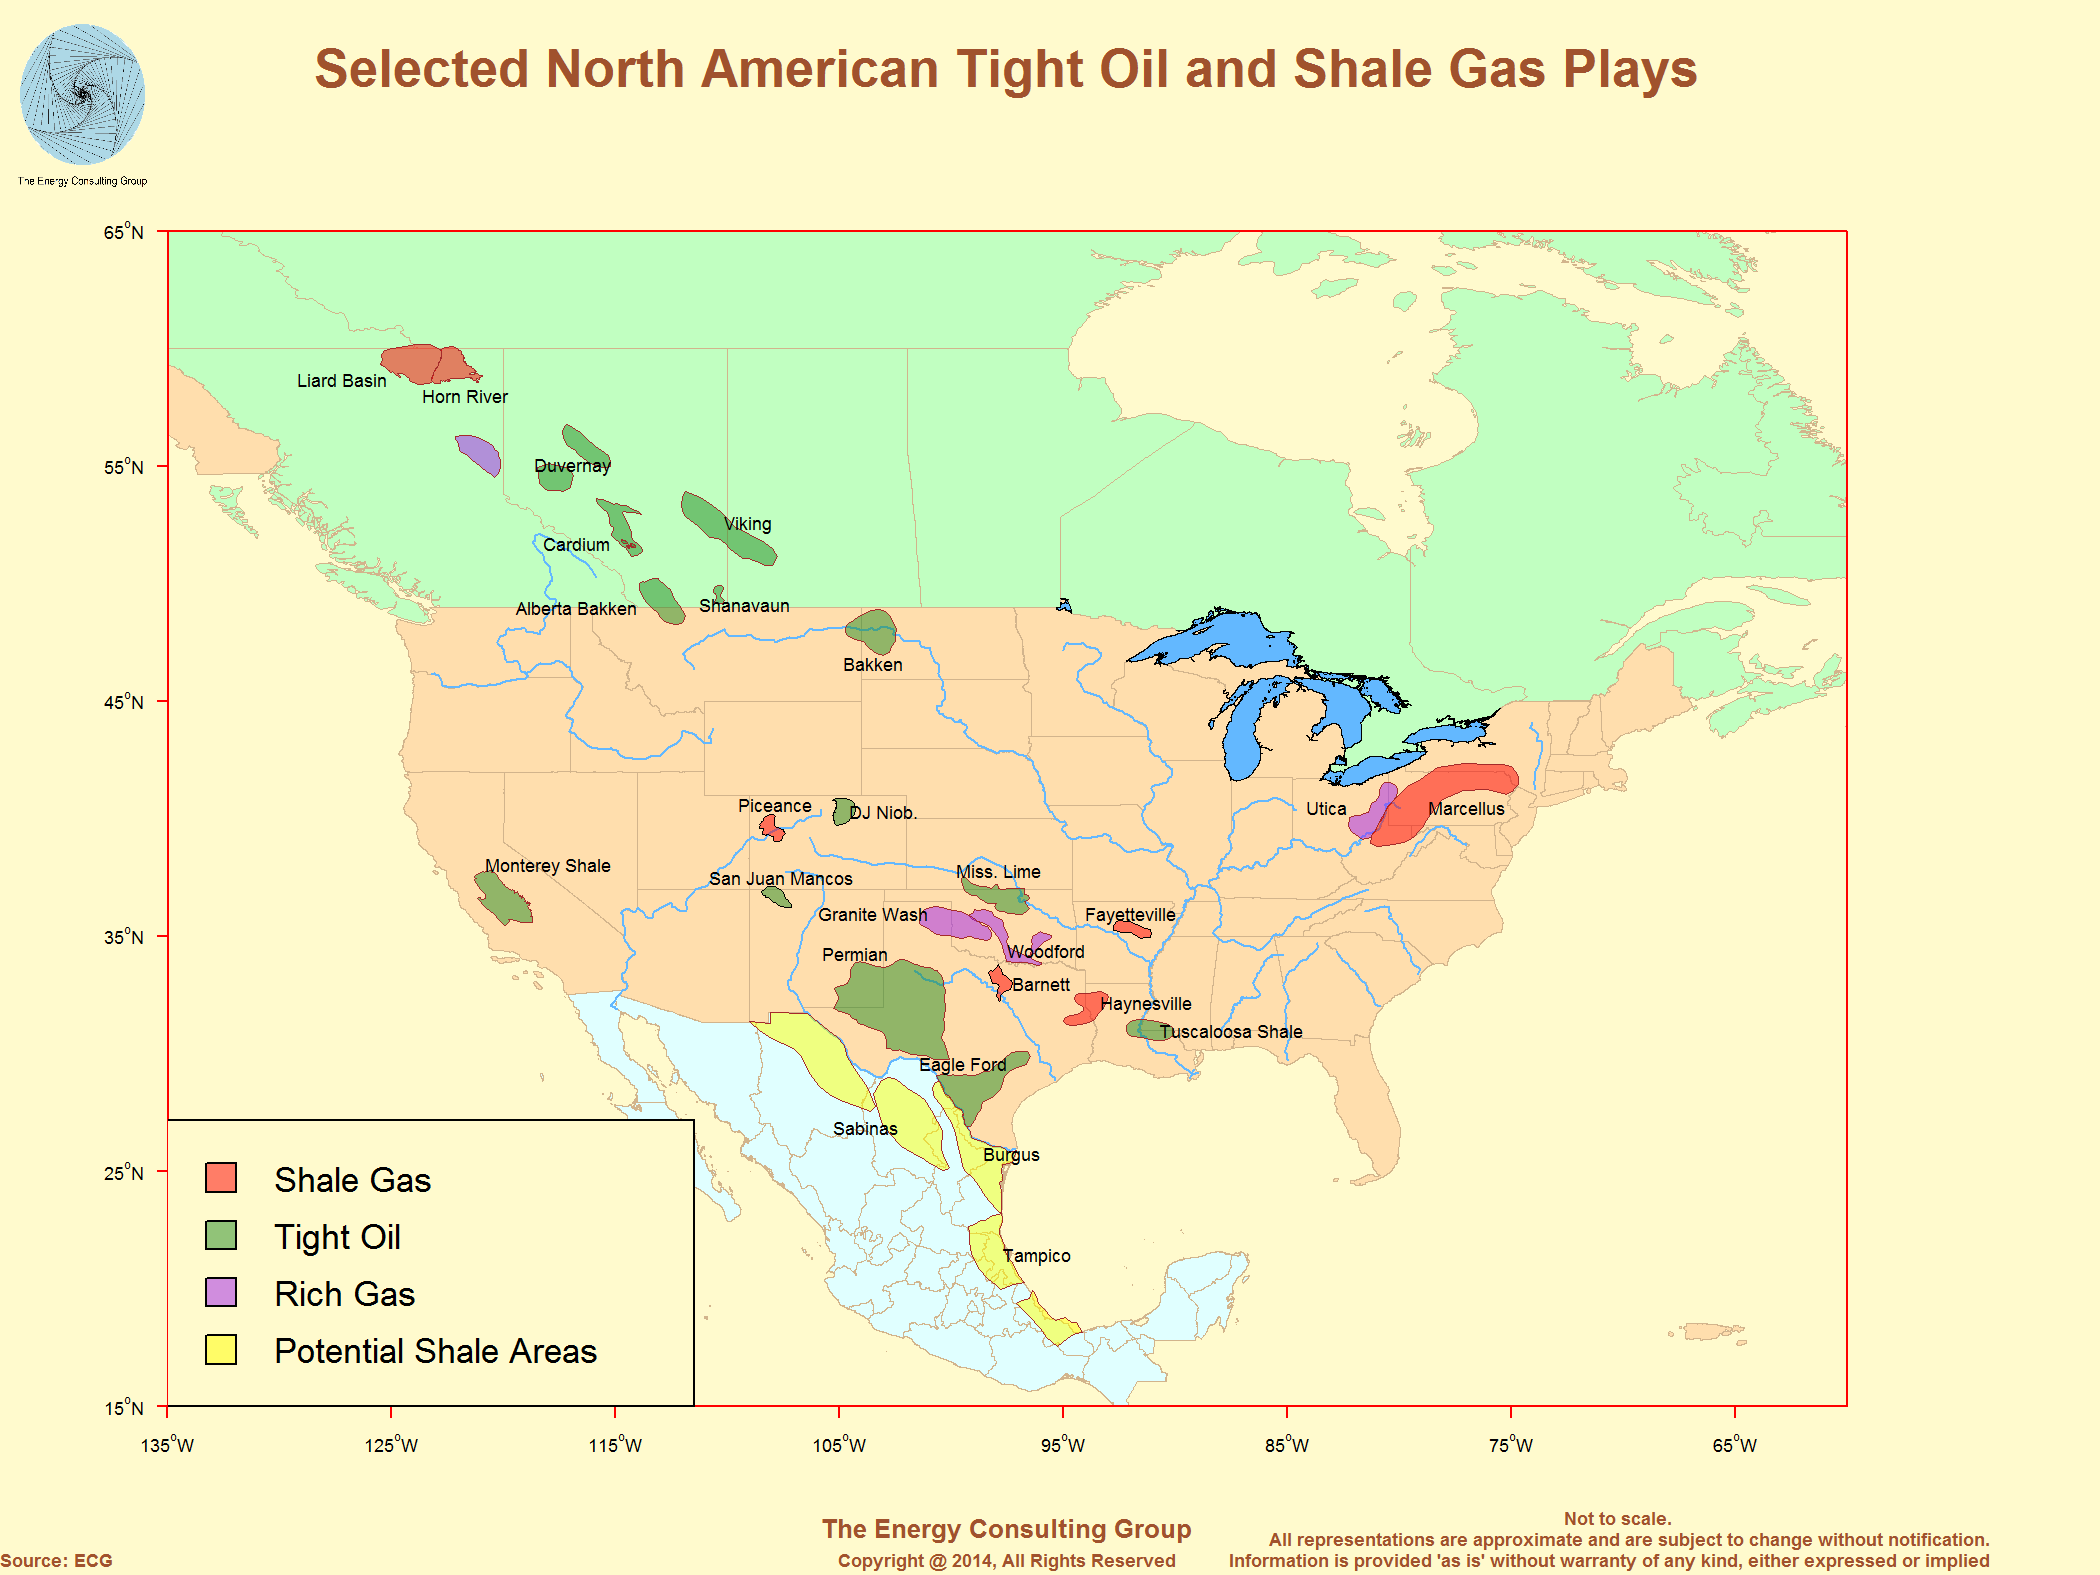 Click Image for Larger Version |
Marcellus-Utica Play Areas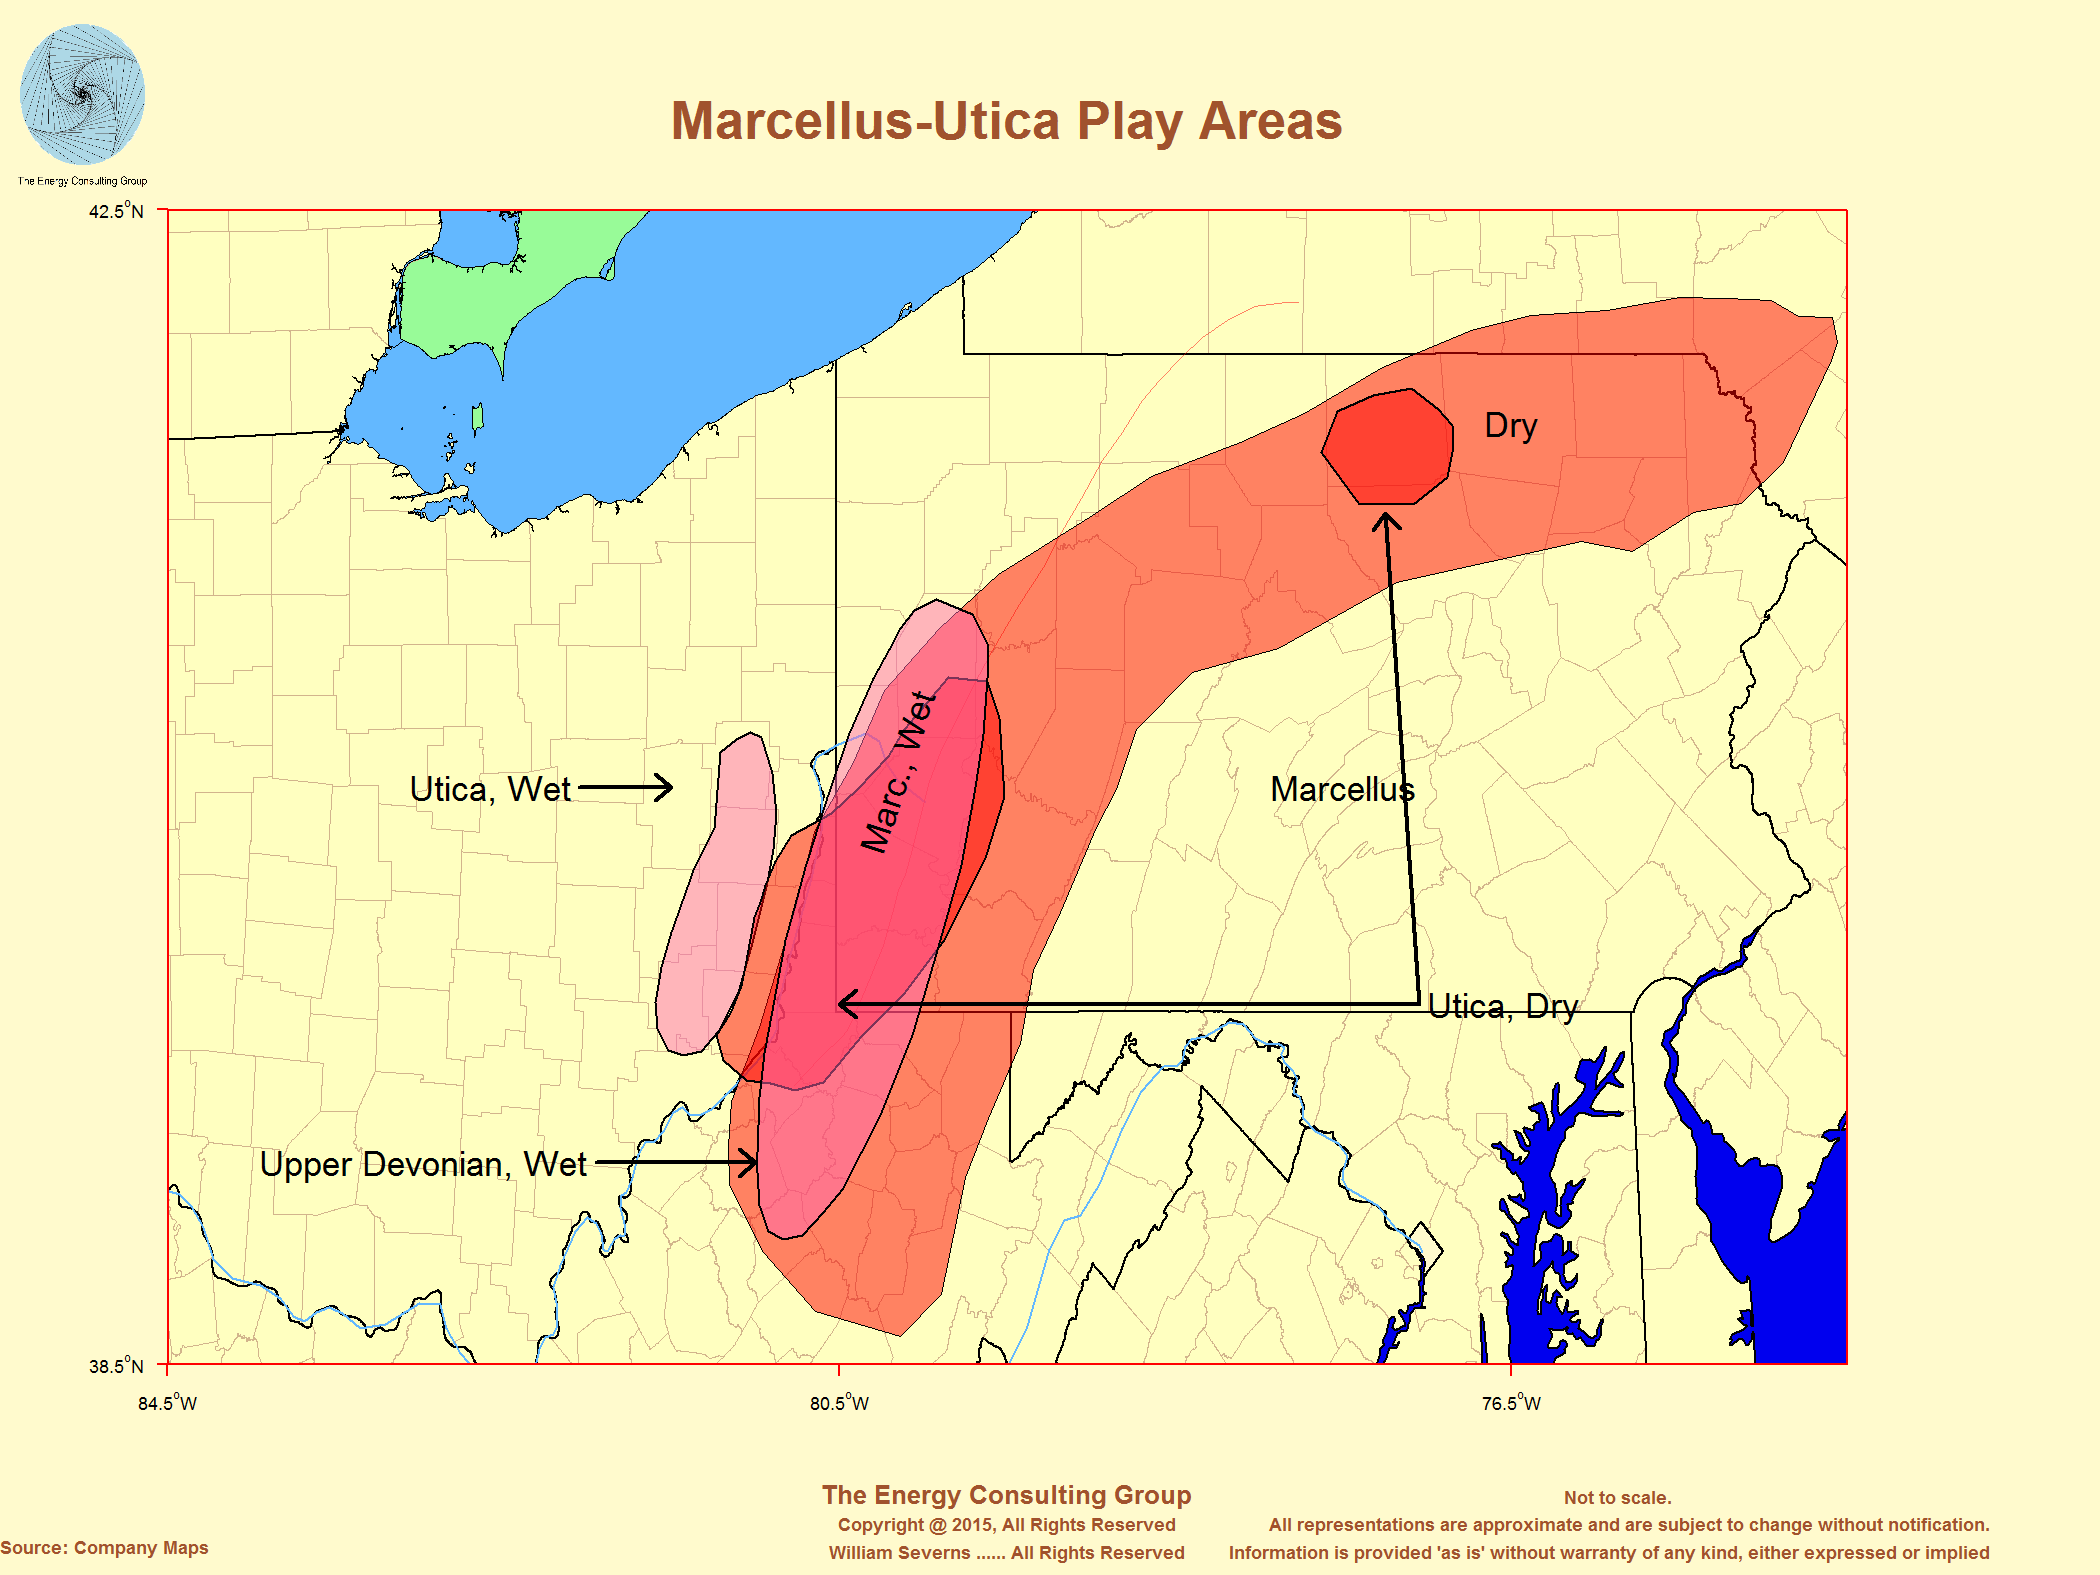 Click Image for Larger Version |
Marcellus: Regional Terrain Map with Contours and Play Outline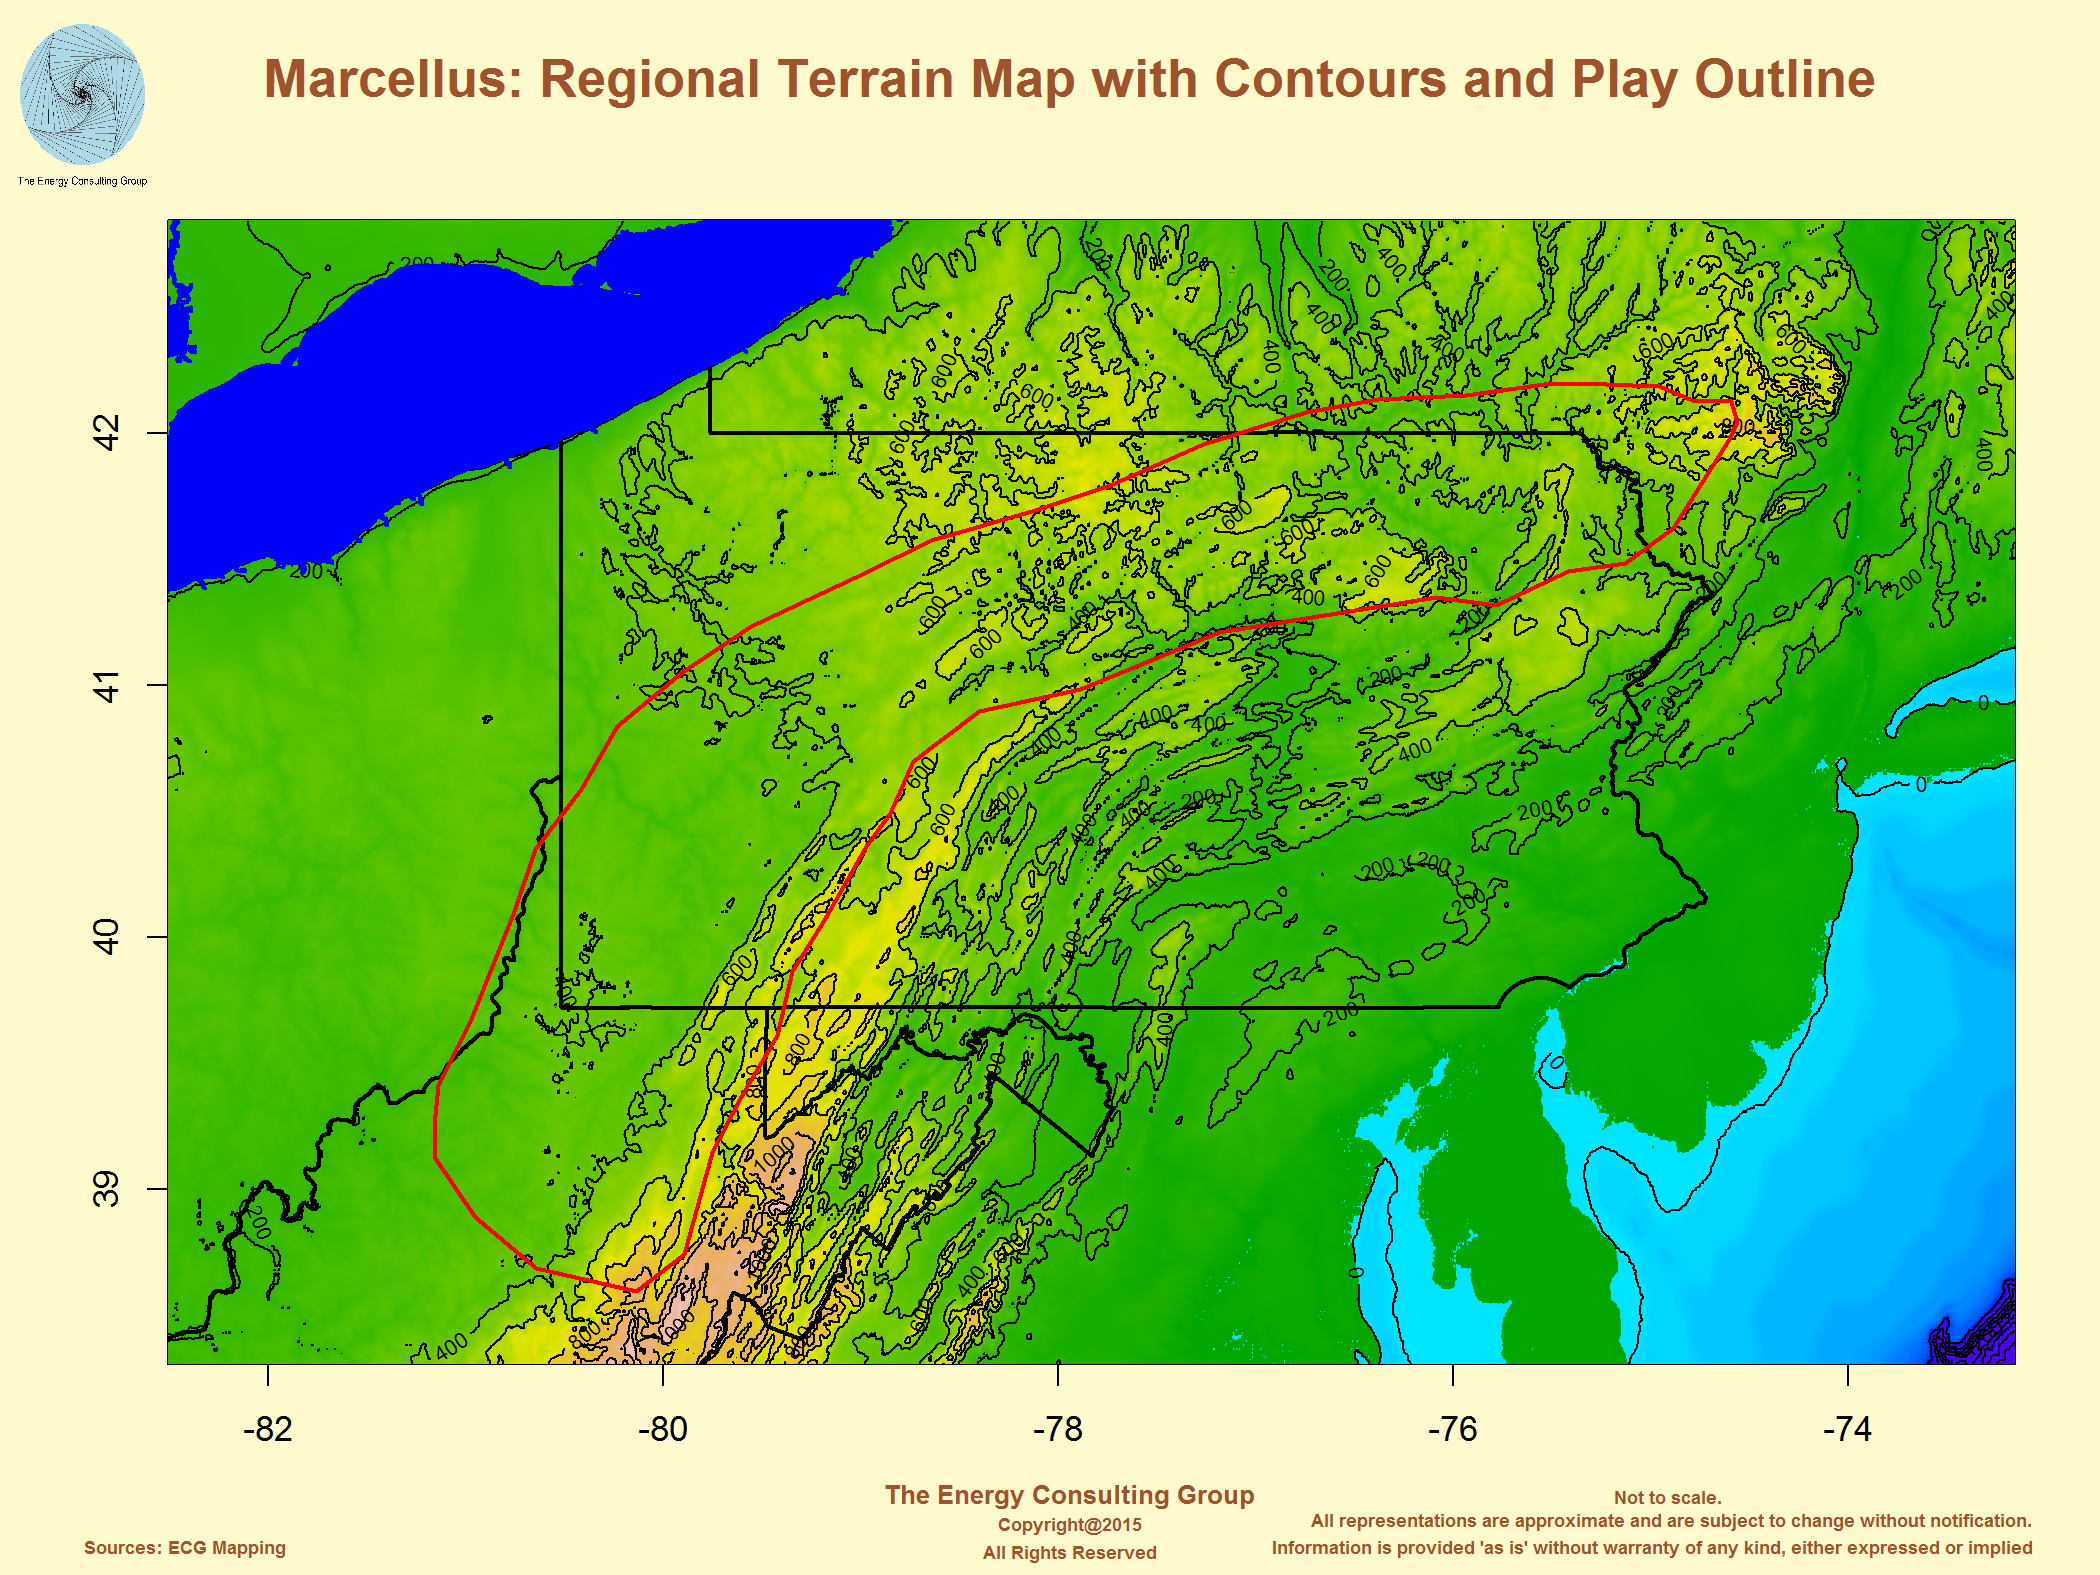 Click Image for Larger Version |
|
Marcellus:Structure Map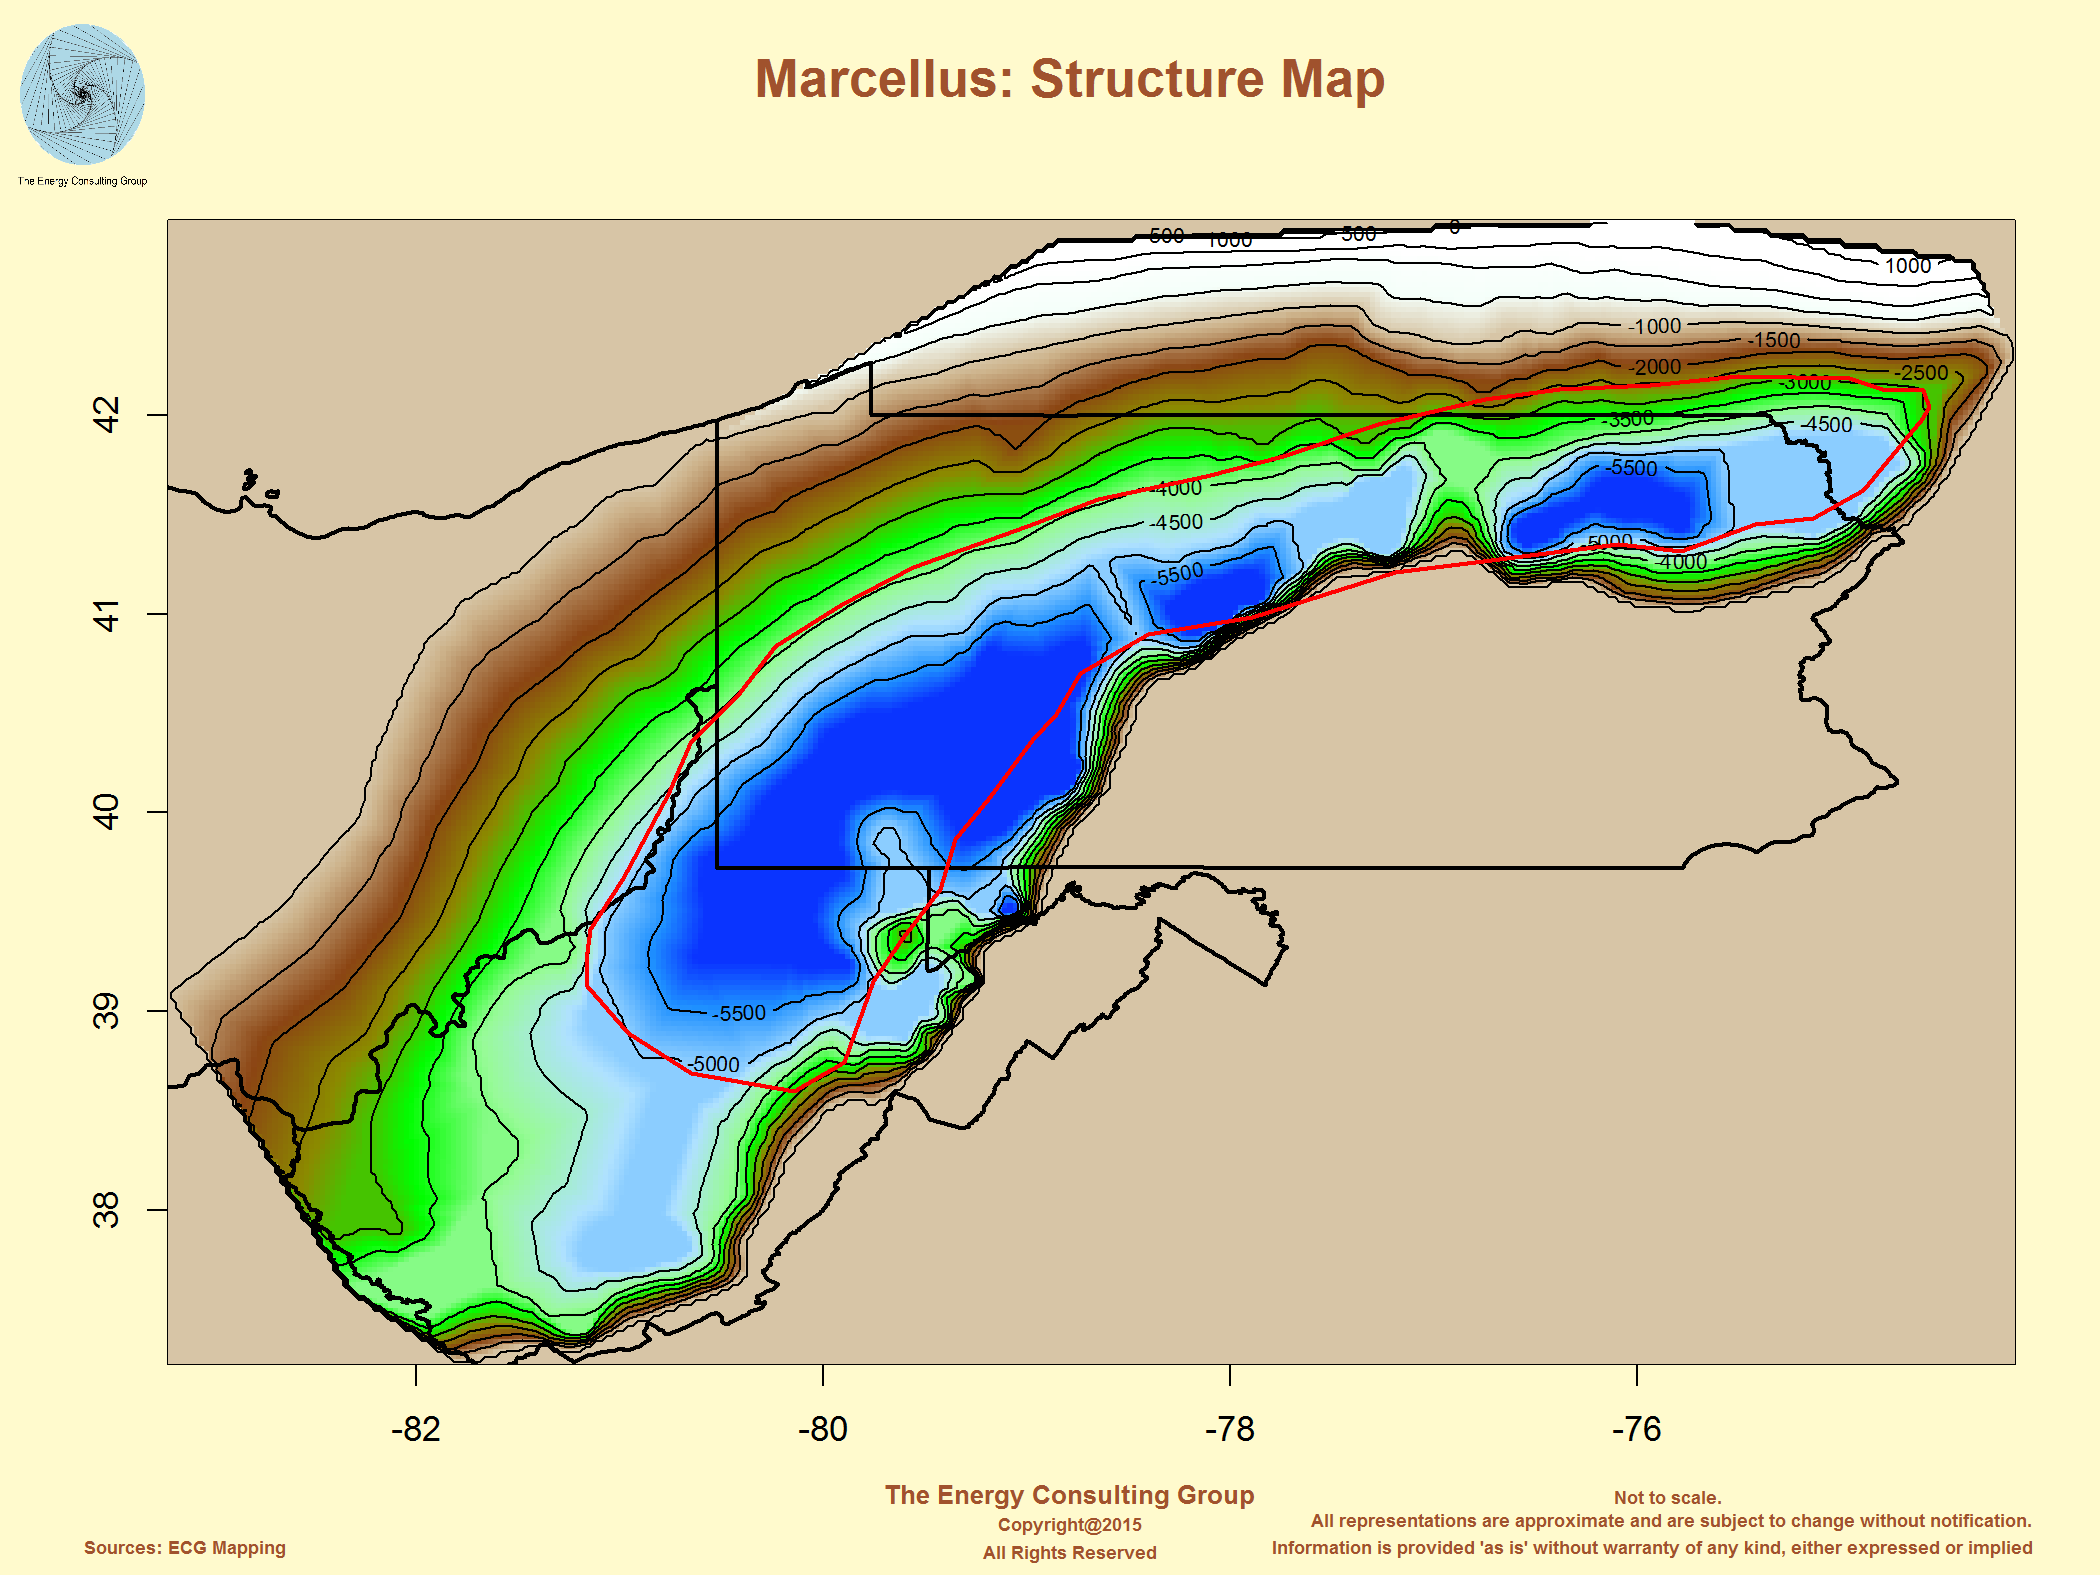 Click Image for Larger Version |
Rotatable 3D Structure Map: Investigate the Marcellus
structure map, as presented to the left in an interactive manner using a
standard browser. (Can use a standard browser with mouse to rotate the
map). Rotatable 3D Structure Map with Wells: Investigate the Marcellus structure relative to Marcellus wells. (Can use a standard browser with mouse to rotate the map). |
Marcellus Thickness Map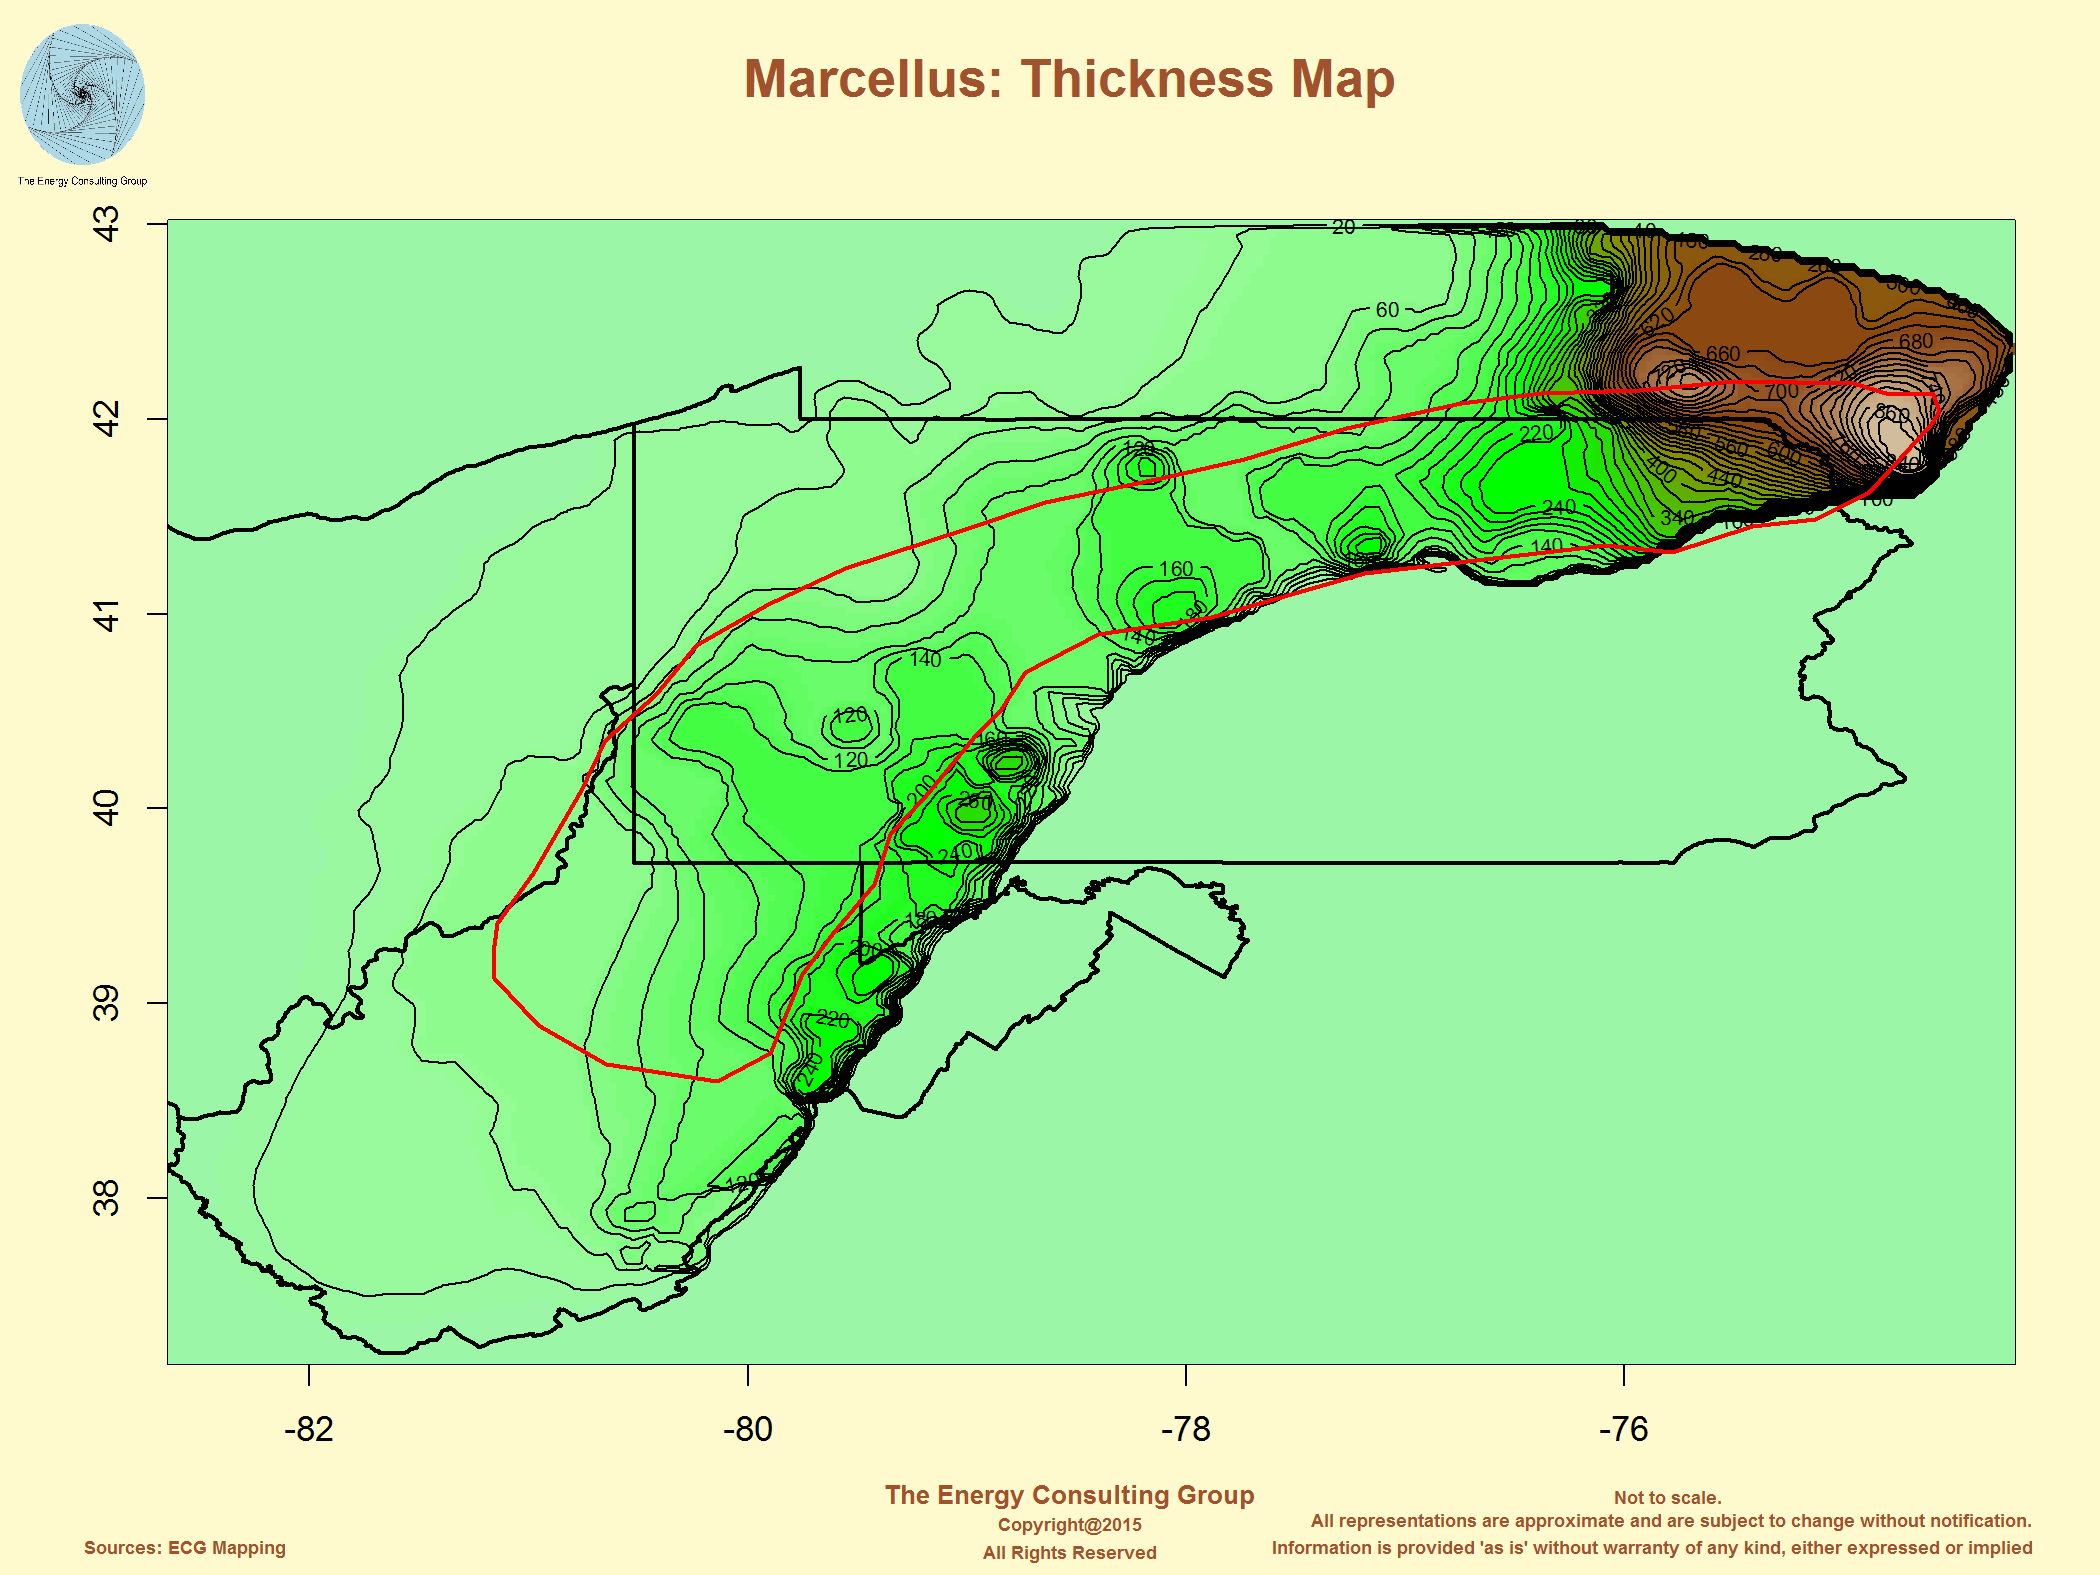 |
Rotatable 3D Thickness Map: Investigate the Marcellus
thickness (isopach) map, as presented to the left in an interactive
manner using a standard browser. (Can use a standard browser with mouse
to rotate the map). Rotatable 3D Thickness Map with Wells: Investigate the Marcellus isopach relative to Marcellus wells. (Can use a standard browser with mouse to rotate the map). |
===========================================================================================================================================================
Marcellus, Utica, and Upper Devonian Well and Operator Economics
The ECG group has used its proprietary economics program, EVAL, to assess the economics of the primary producing areas in the Marcellus, Utica, and Upper Devonian. The program uses what ECG believes to be one of the most advanced shale play production modeling tools in the industry to forecast three product streams (natural gas, condensate, and NGL), and value each stream separately compared to the capital, operating, and overhead costs necessary to develop and produce the resource. As one might expect, the economics vary considerably, depending on the operator, production profile, and ultimate recovery of gas, condensate, and NGL.
===========================================================================================================================================================
Appalachia Production Volumes
Appalachia Area Gas Production Click Image for Larger Version |
US Natural Gas - Marcellus, Utica, and Eagle Ford Breakout Click Image for Larger Version |
Marcellus Rate and Recovery Performance Overtime (Dry Gas)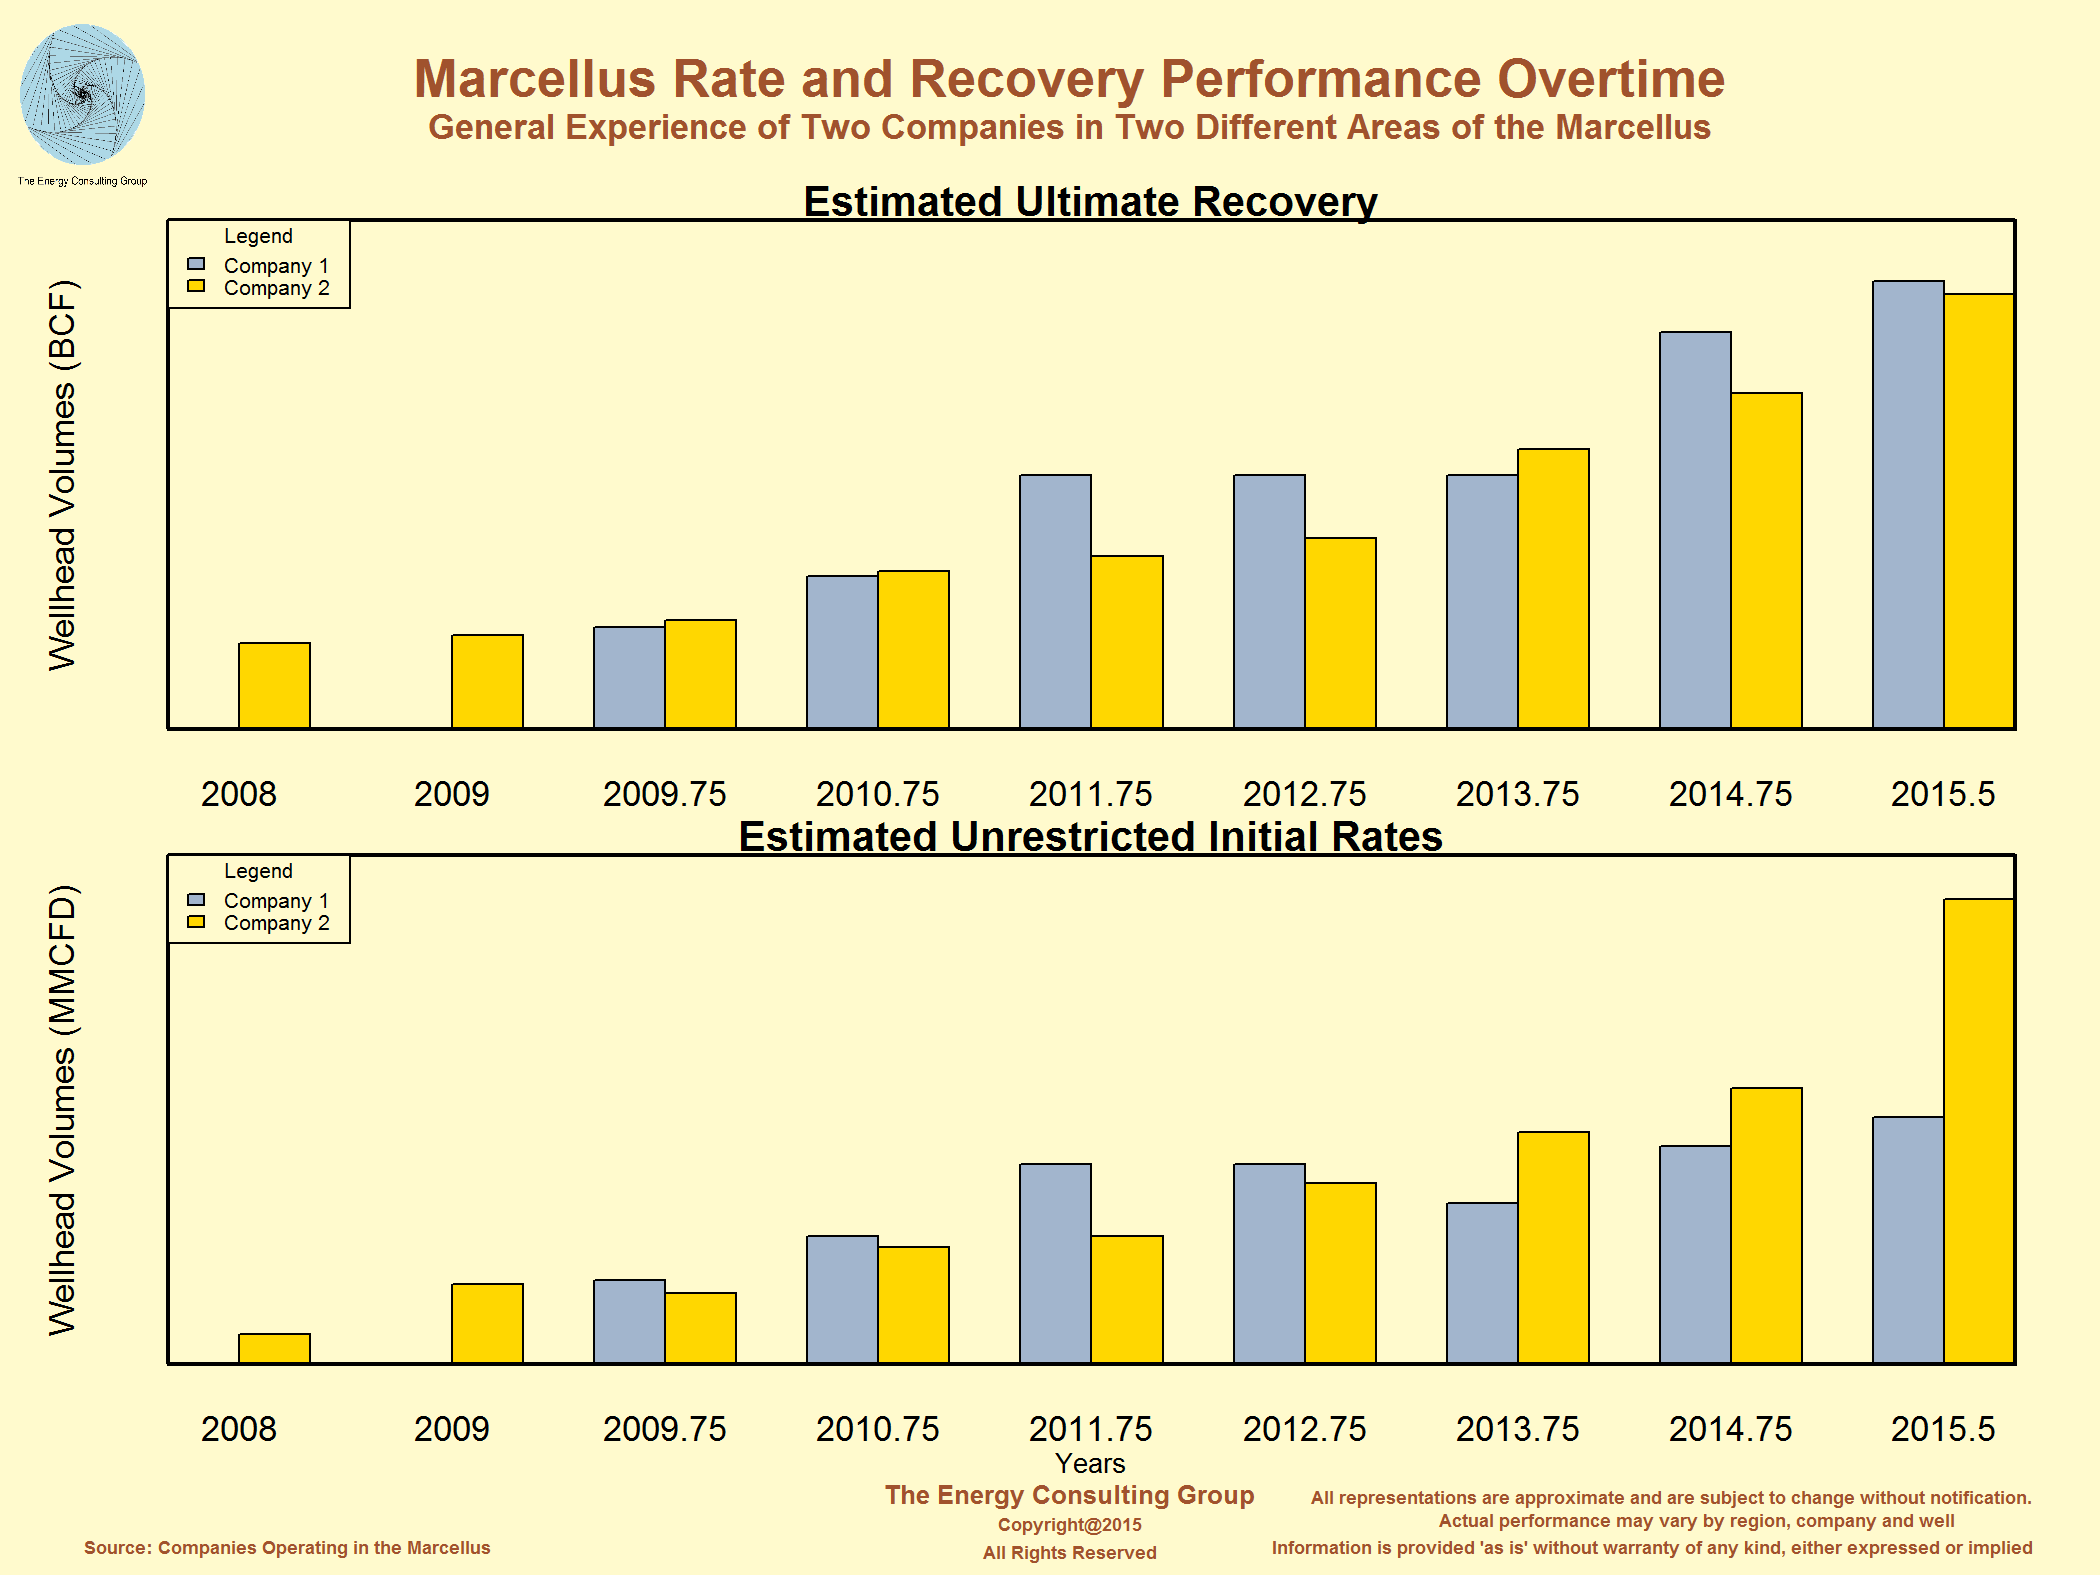 Click Image for Larger Version If need details on rate and ultimate recovery, please send us an e-mail. |
What is obvious is that a large part of the production growth shown on the previous two slides is due to improving technology and better understanding of the reservoir. The figures to the left clearly illustrates the positive impact on rate due to these factors experienced by two Marcellus operators. |
==========================================================================================================================================================
Marcellus
Area Drilling
Activity
(includes Utica and Upper
Devonian)
The four activity maps presented below indicate that the drilling footprint for the three plays
(Marcellus, Utica, and Upper Devonian) is
expanding, especially into northern West Virginia, and eastern
Ohio. It is likely this broadening of activity will also deepen as
NGL processing capacity undergoes a massive expansion in the
tri-state area (northern West Virginia, eastern Ohio, and southwestern
Pennsylvania) between
2012-2014.
Evolution of Marcellus-Utica Drilling Activity Over Time
|
Marcellus-Utica Drilling Activity (Raw data only. Rig counts have not been filtered for depth, or well geometry) Reported Drilling Activity: July 25, 2008 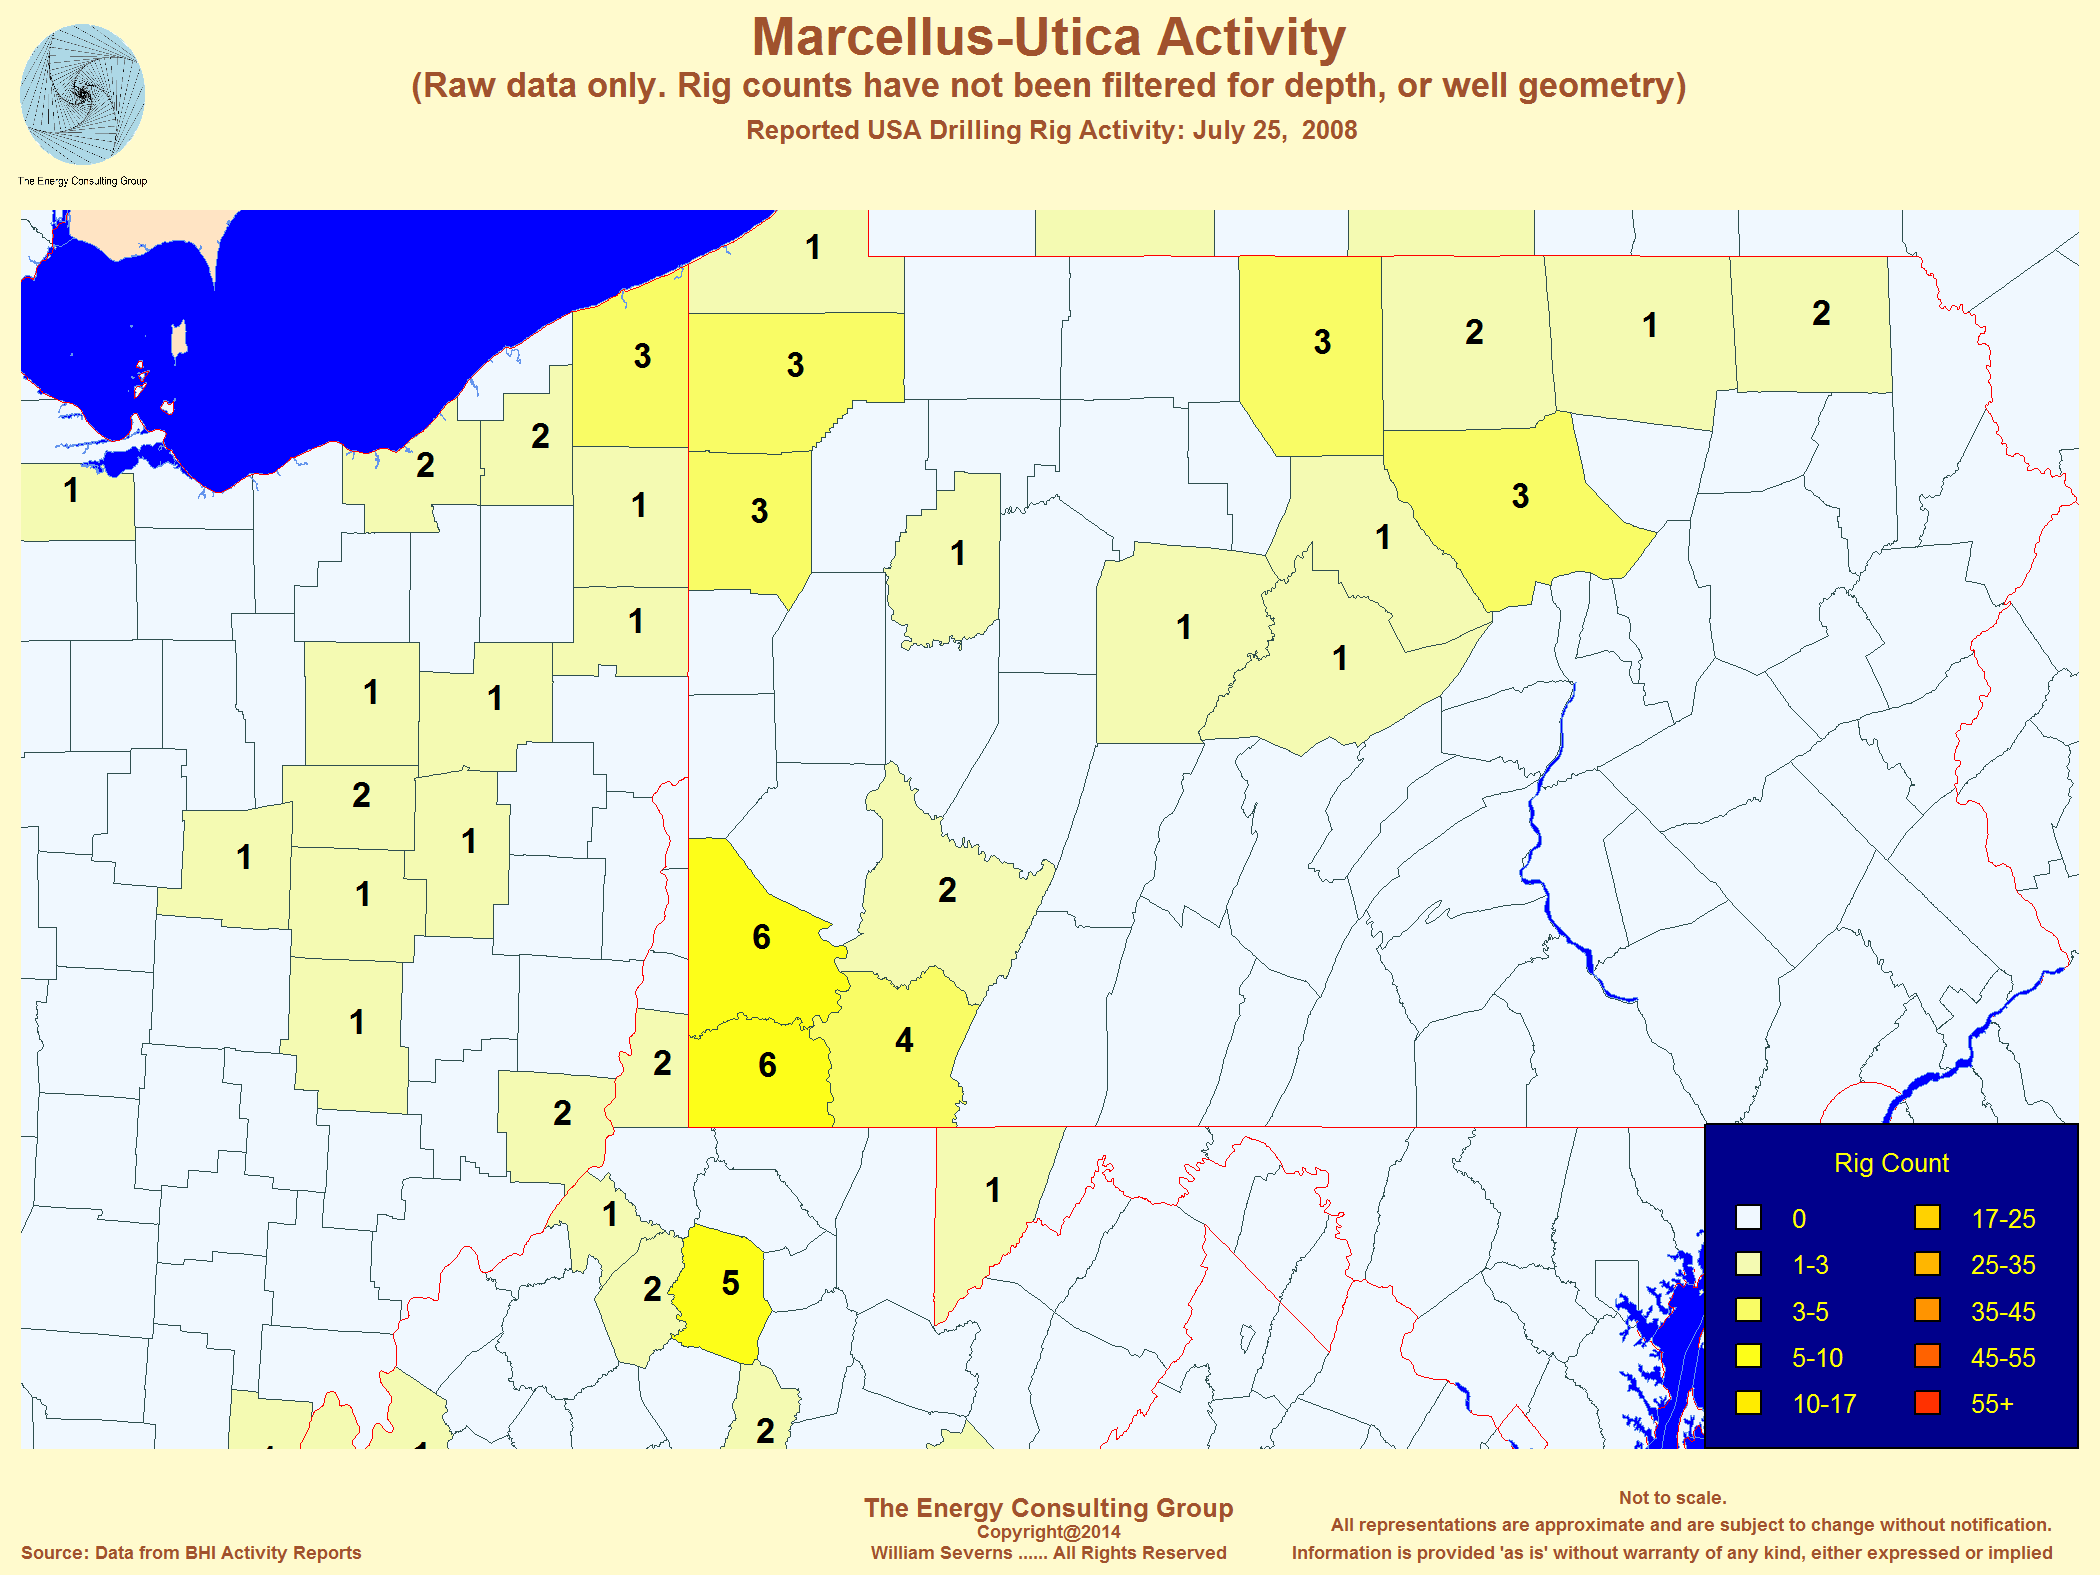 |
Marcellus-Utica
Drilling Activity (Raw data only. Rig counts have not been filtered for depth, or well geometry) Reported Drilling Activity: June 17, 2011 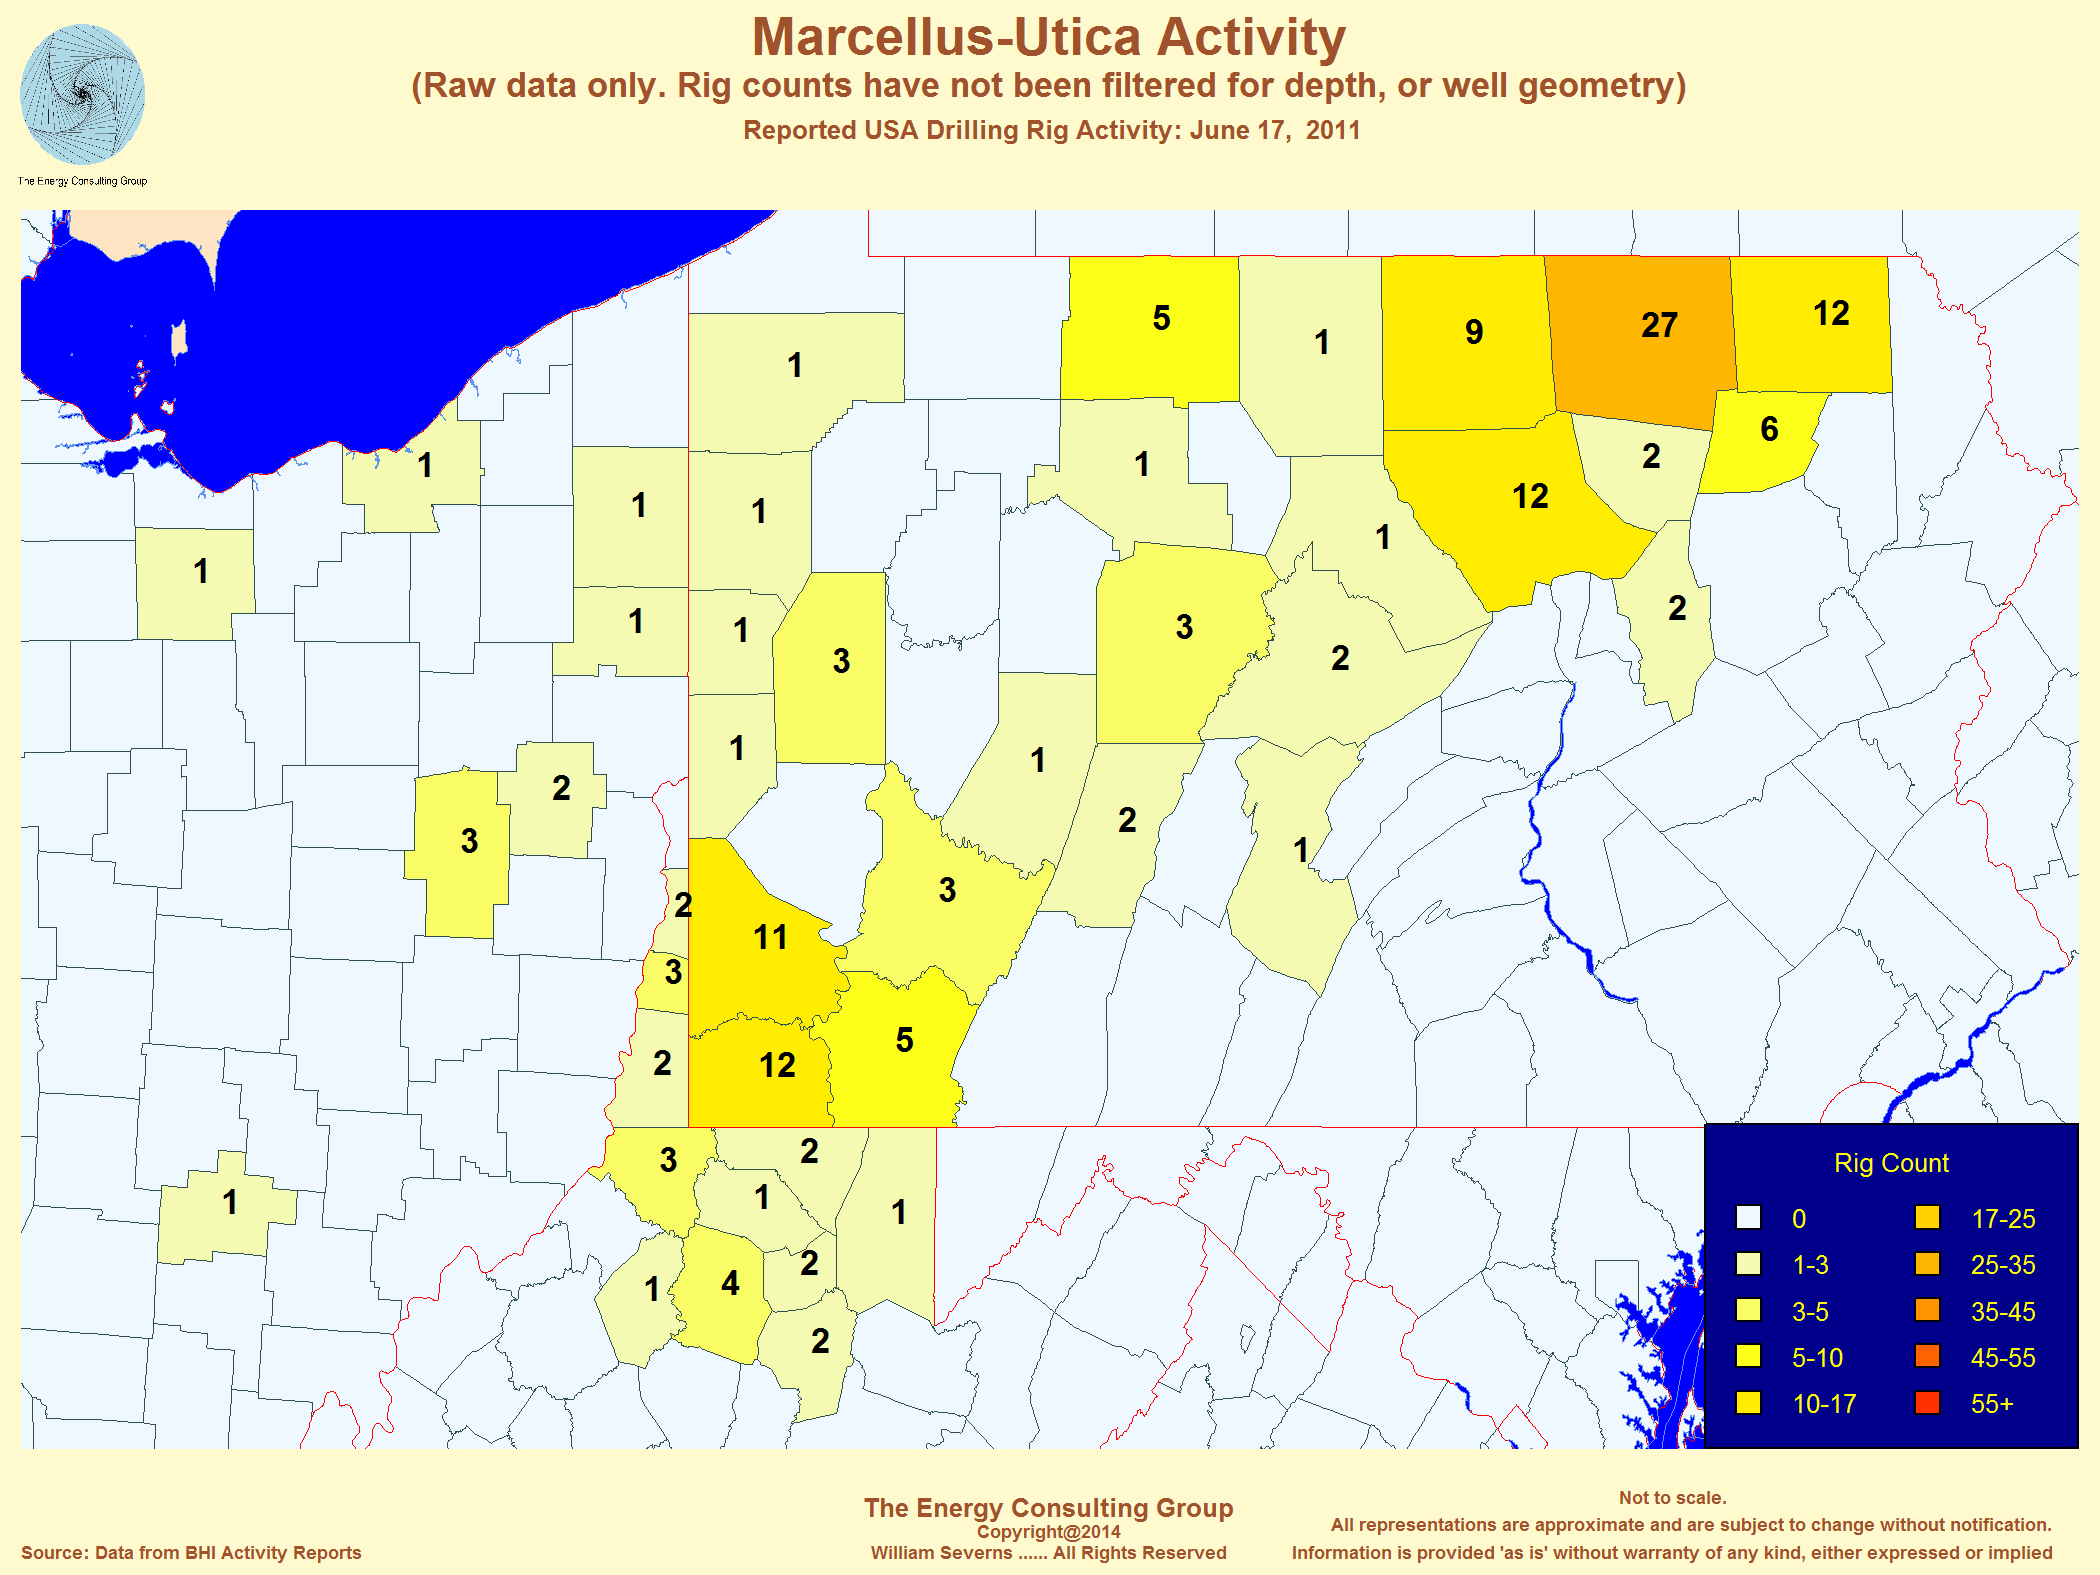 |
Marcellus-Utica Drilling Activity (Raw data only. Rig counts have not been filtered for depth, or well geometry) Reported Drilling Activity: November 28, 2014 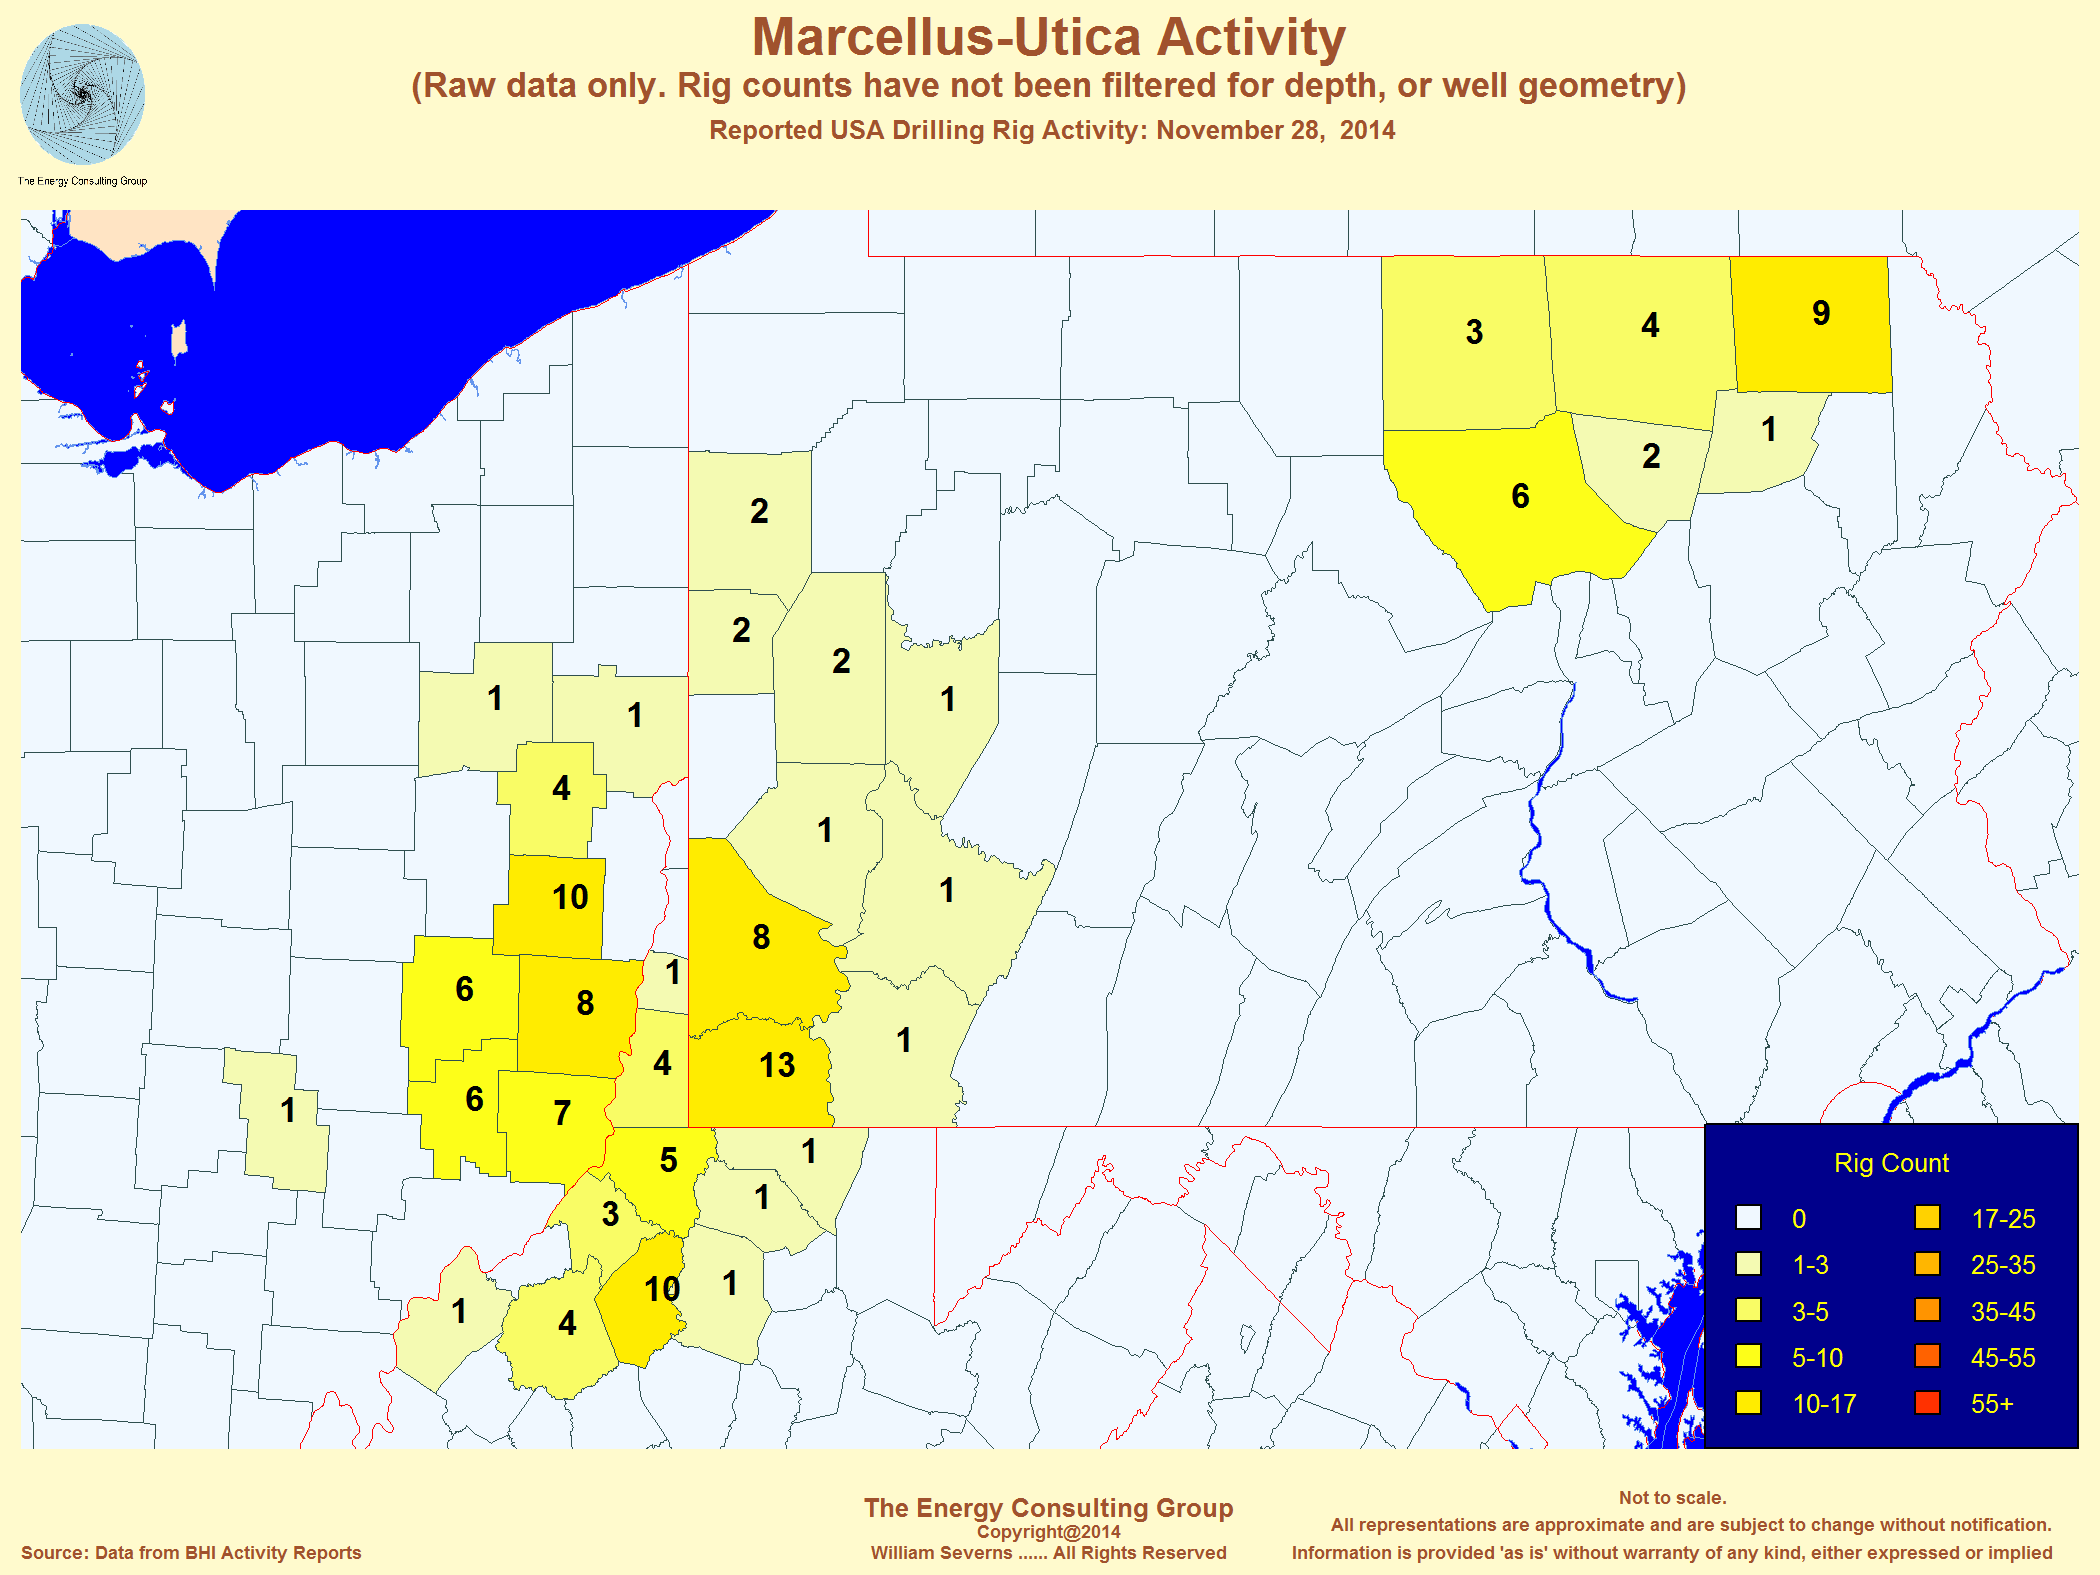 |
Marcellus-Utica Drilling Activity (Raw data only. Rig counts have not been filtered for depth, or well geometry) Reported Drilling Activity: February 28, 2019 |
===========================================================================================================================================================
|
E&P News and Information Scandinavian International and National International Energy
Agency Department of Trade and Norwegian
Petroleum Ministry of Industry
and E&P Project Information |
|---|