(updated February 2023)
|
Baker Hughs International reported that as of
2/17/2023 US rig
760 rigs. See below for details. Download powerpoint file with rig activity maps and rig count trend graphics. Recent USA Oil and Gas Drilling Rig Activity Map  Click on the image for more details Recent USA Oil and Gas Fracking Activity Map  Click on the image for more details |
February 2023
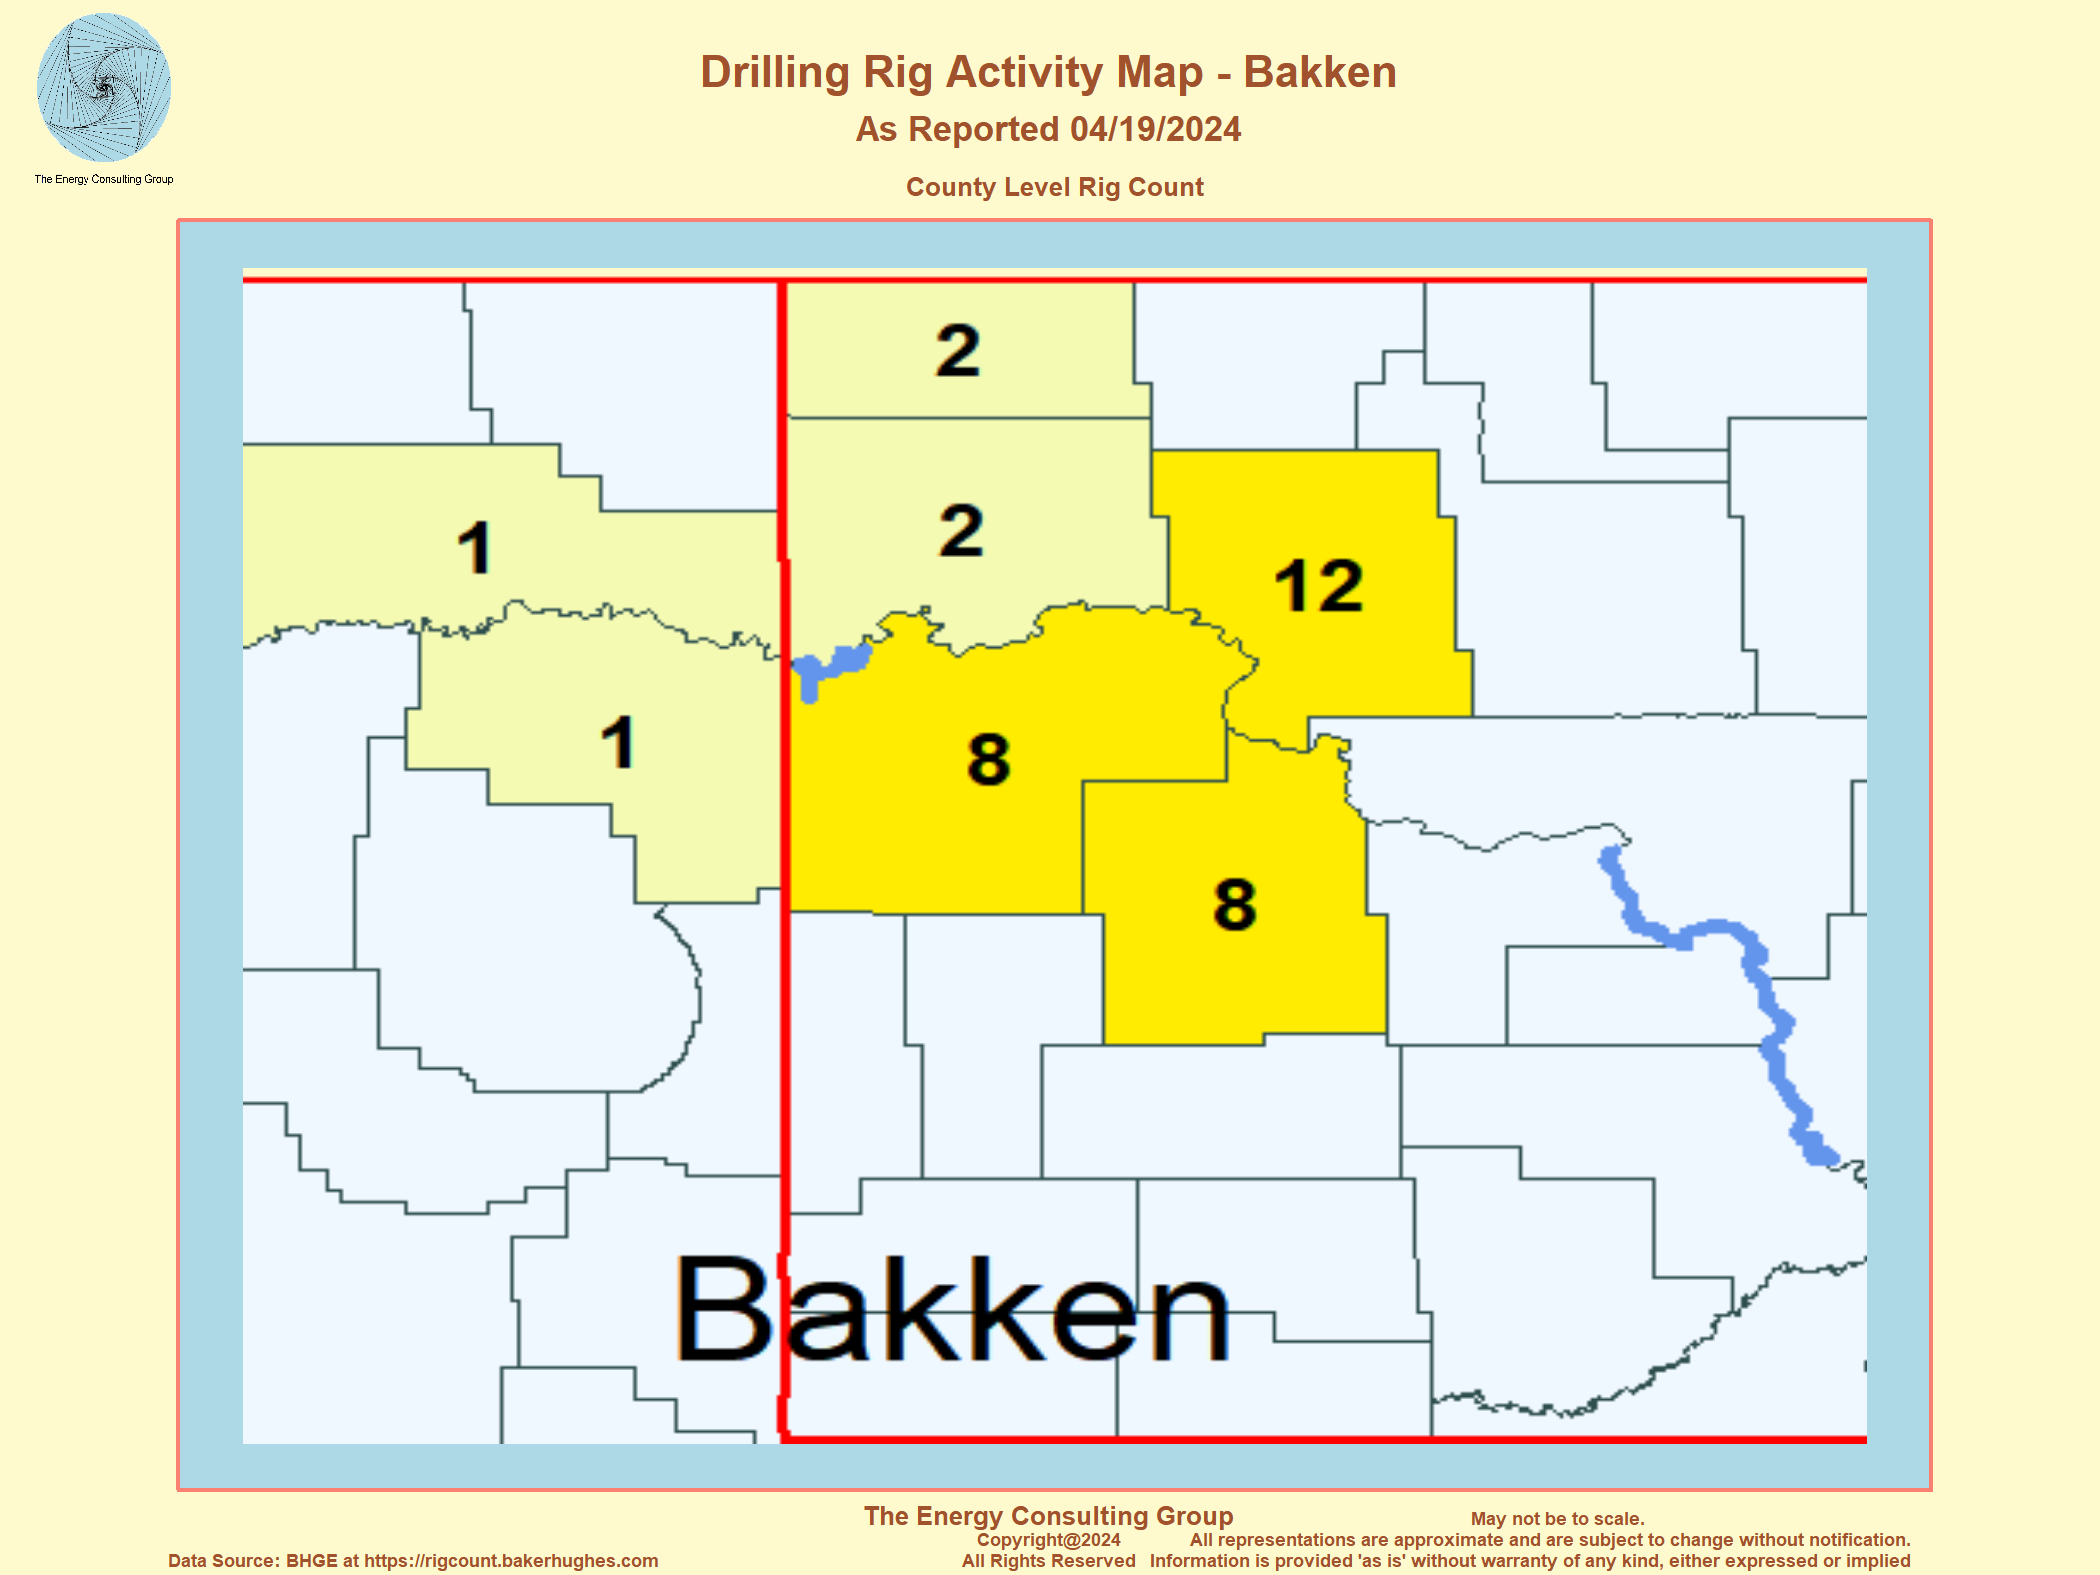
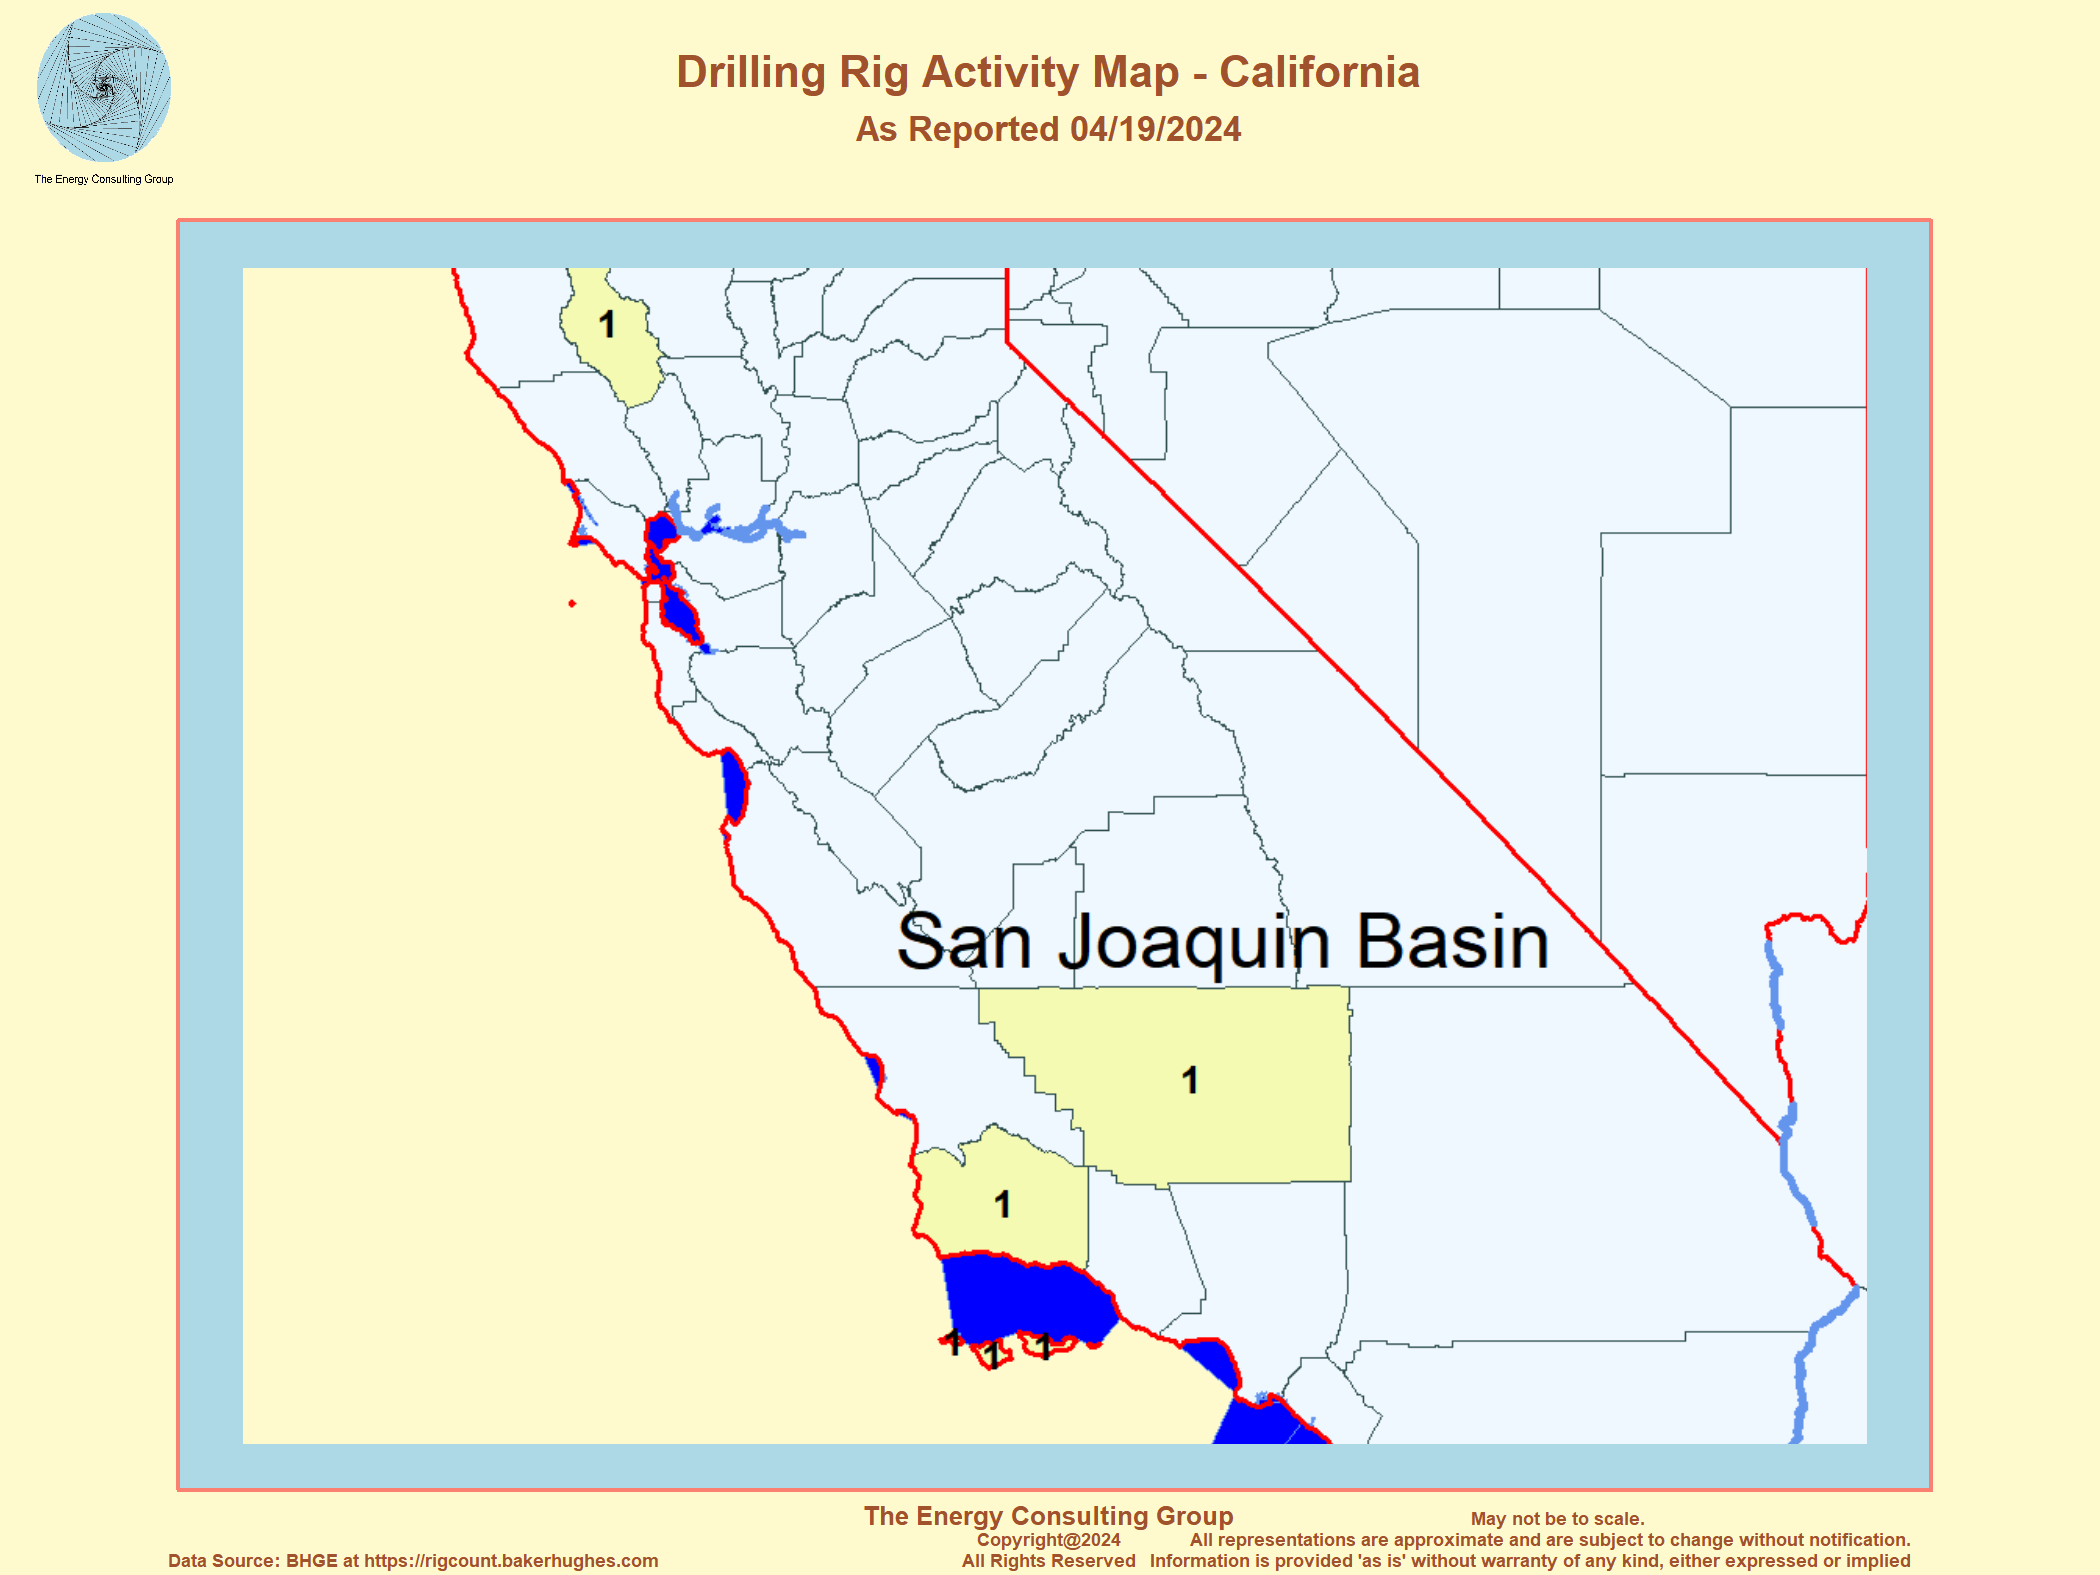
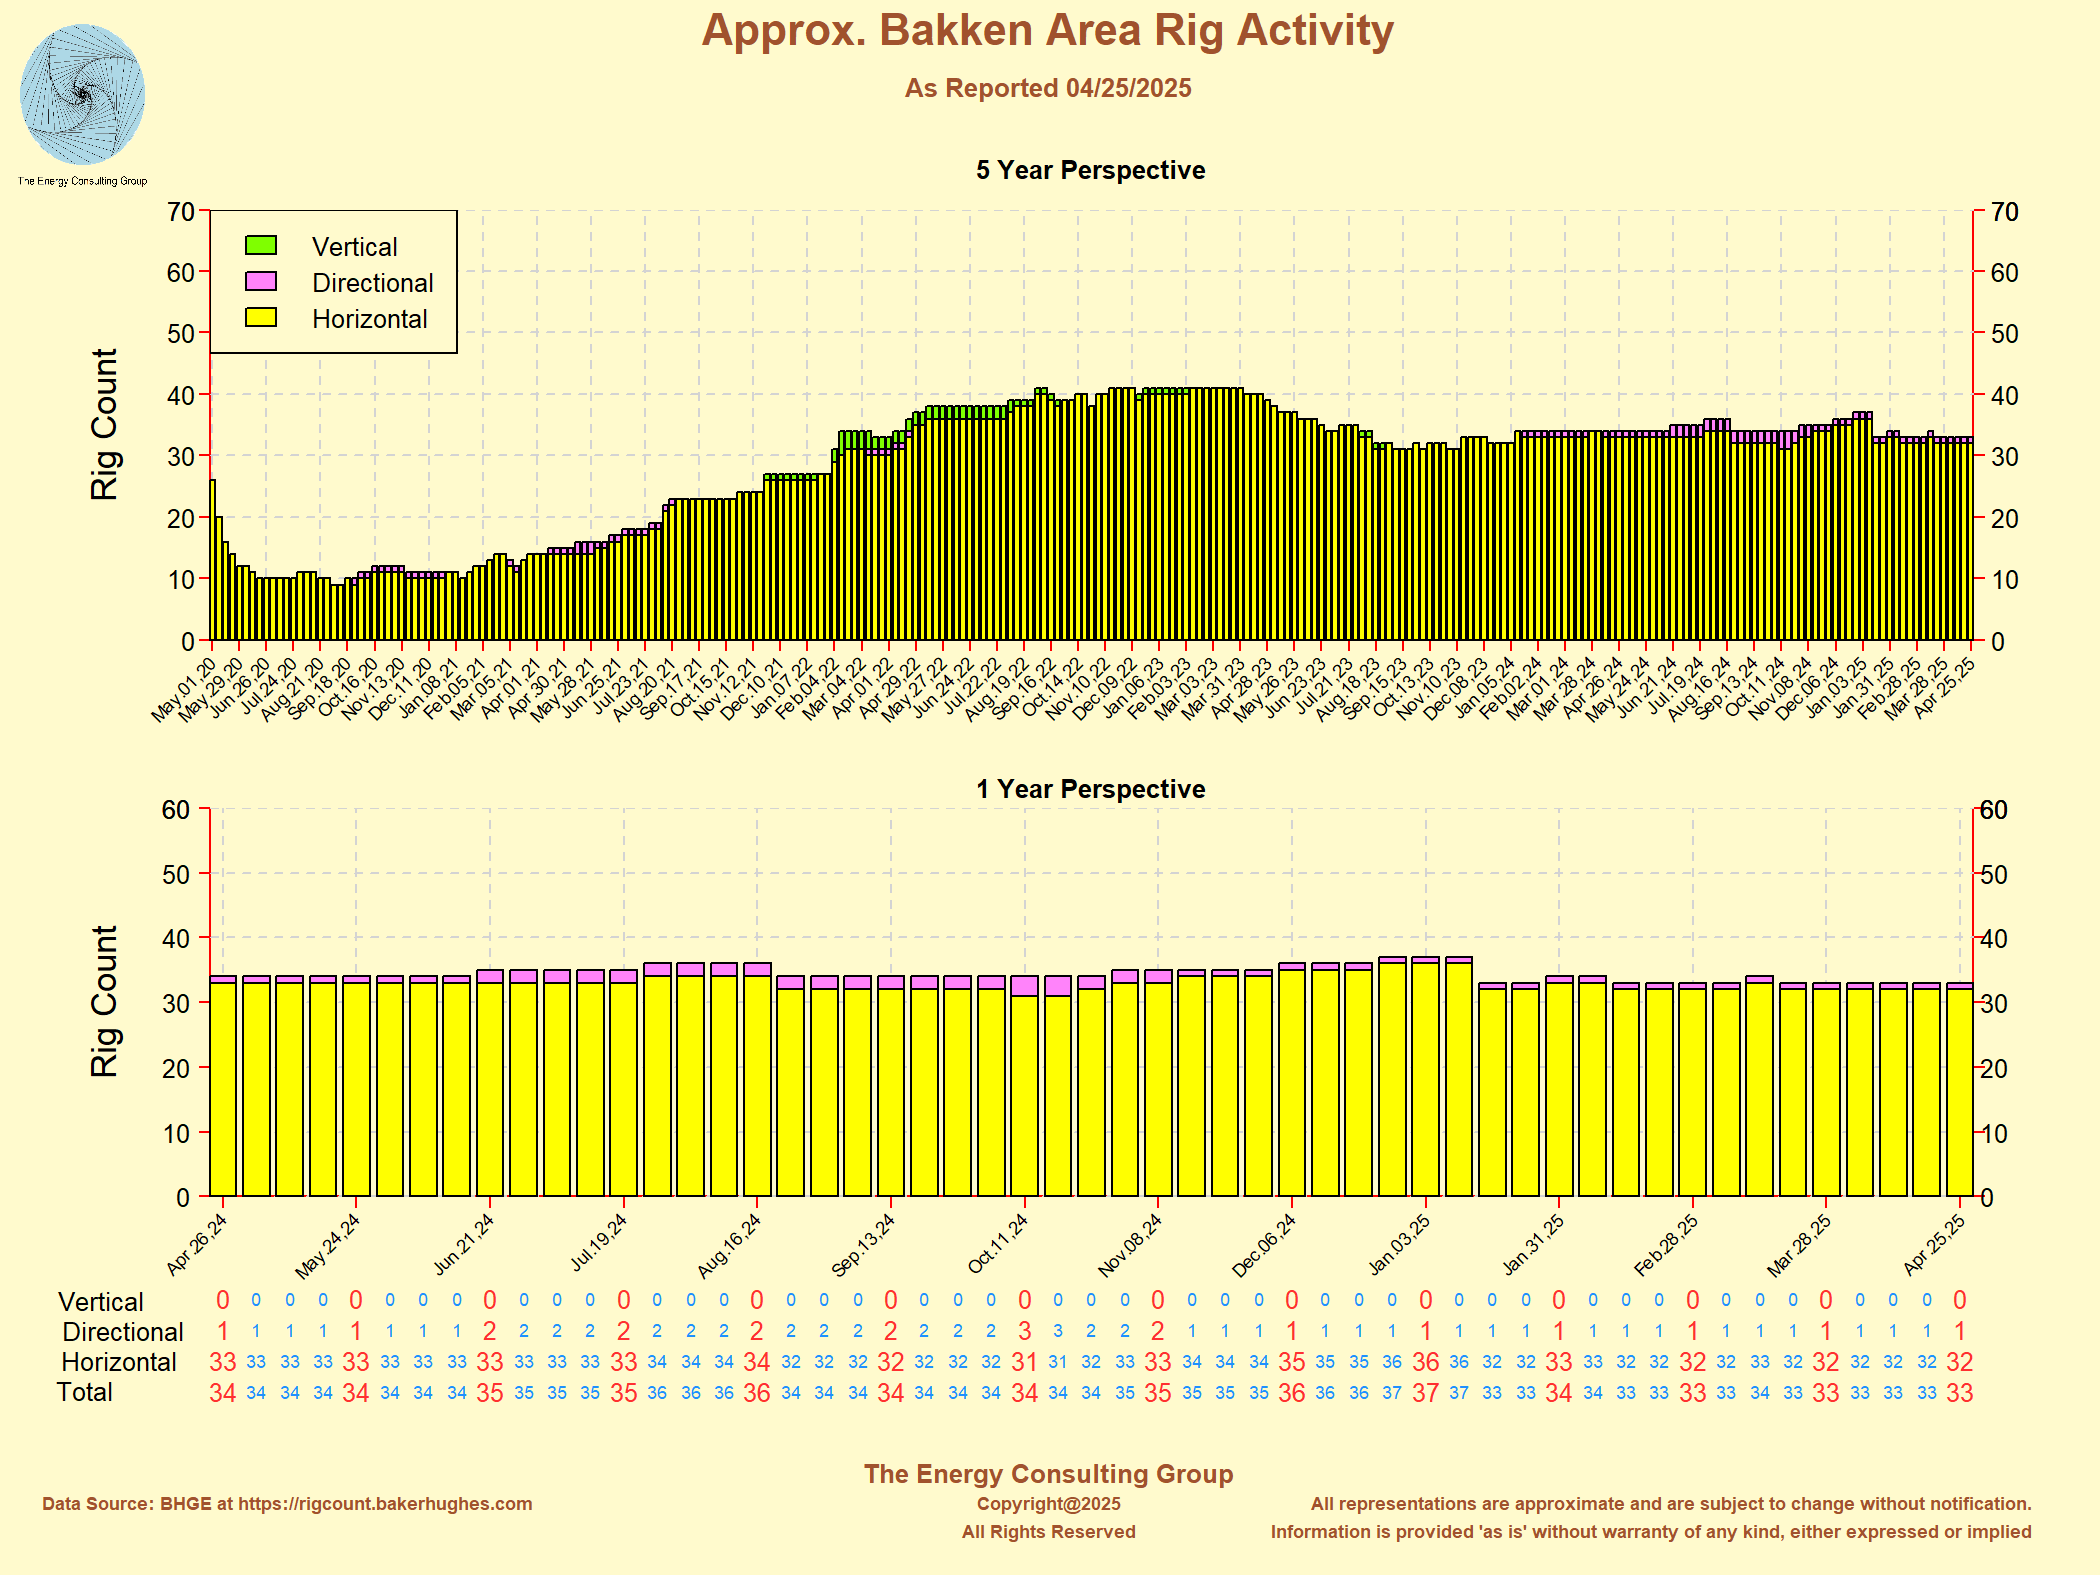
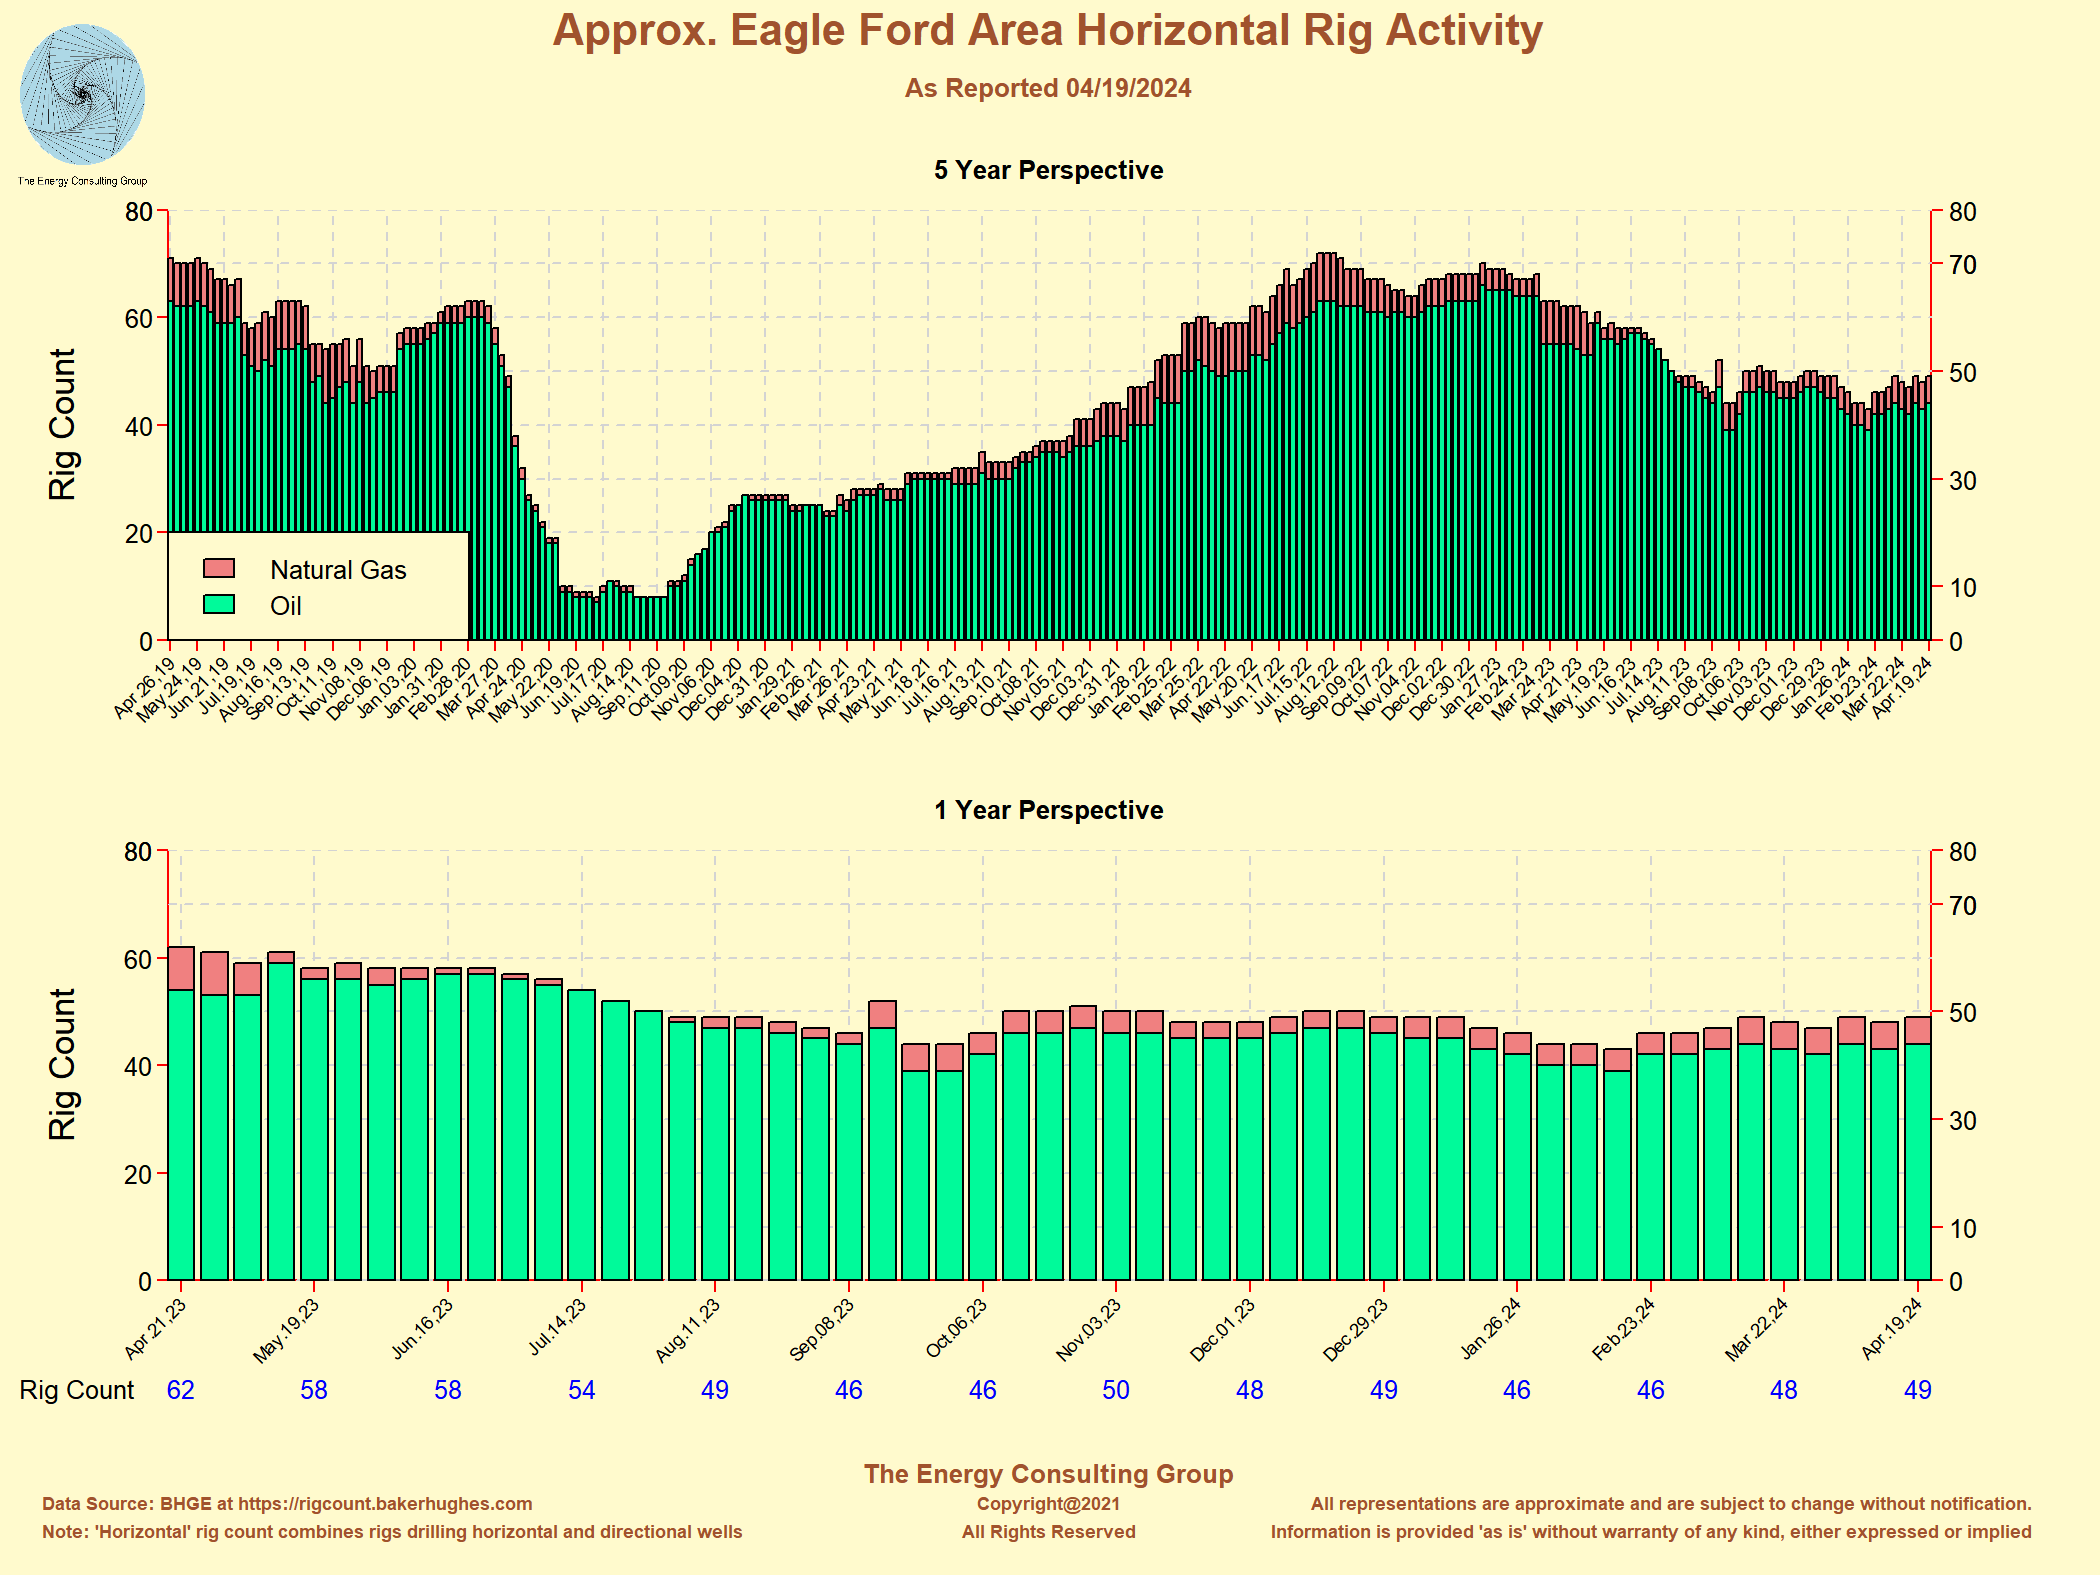
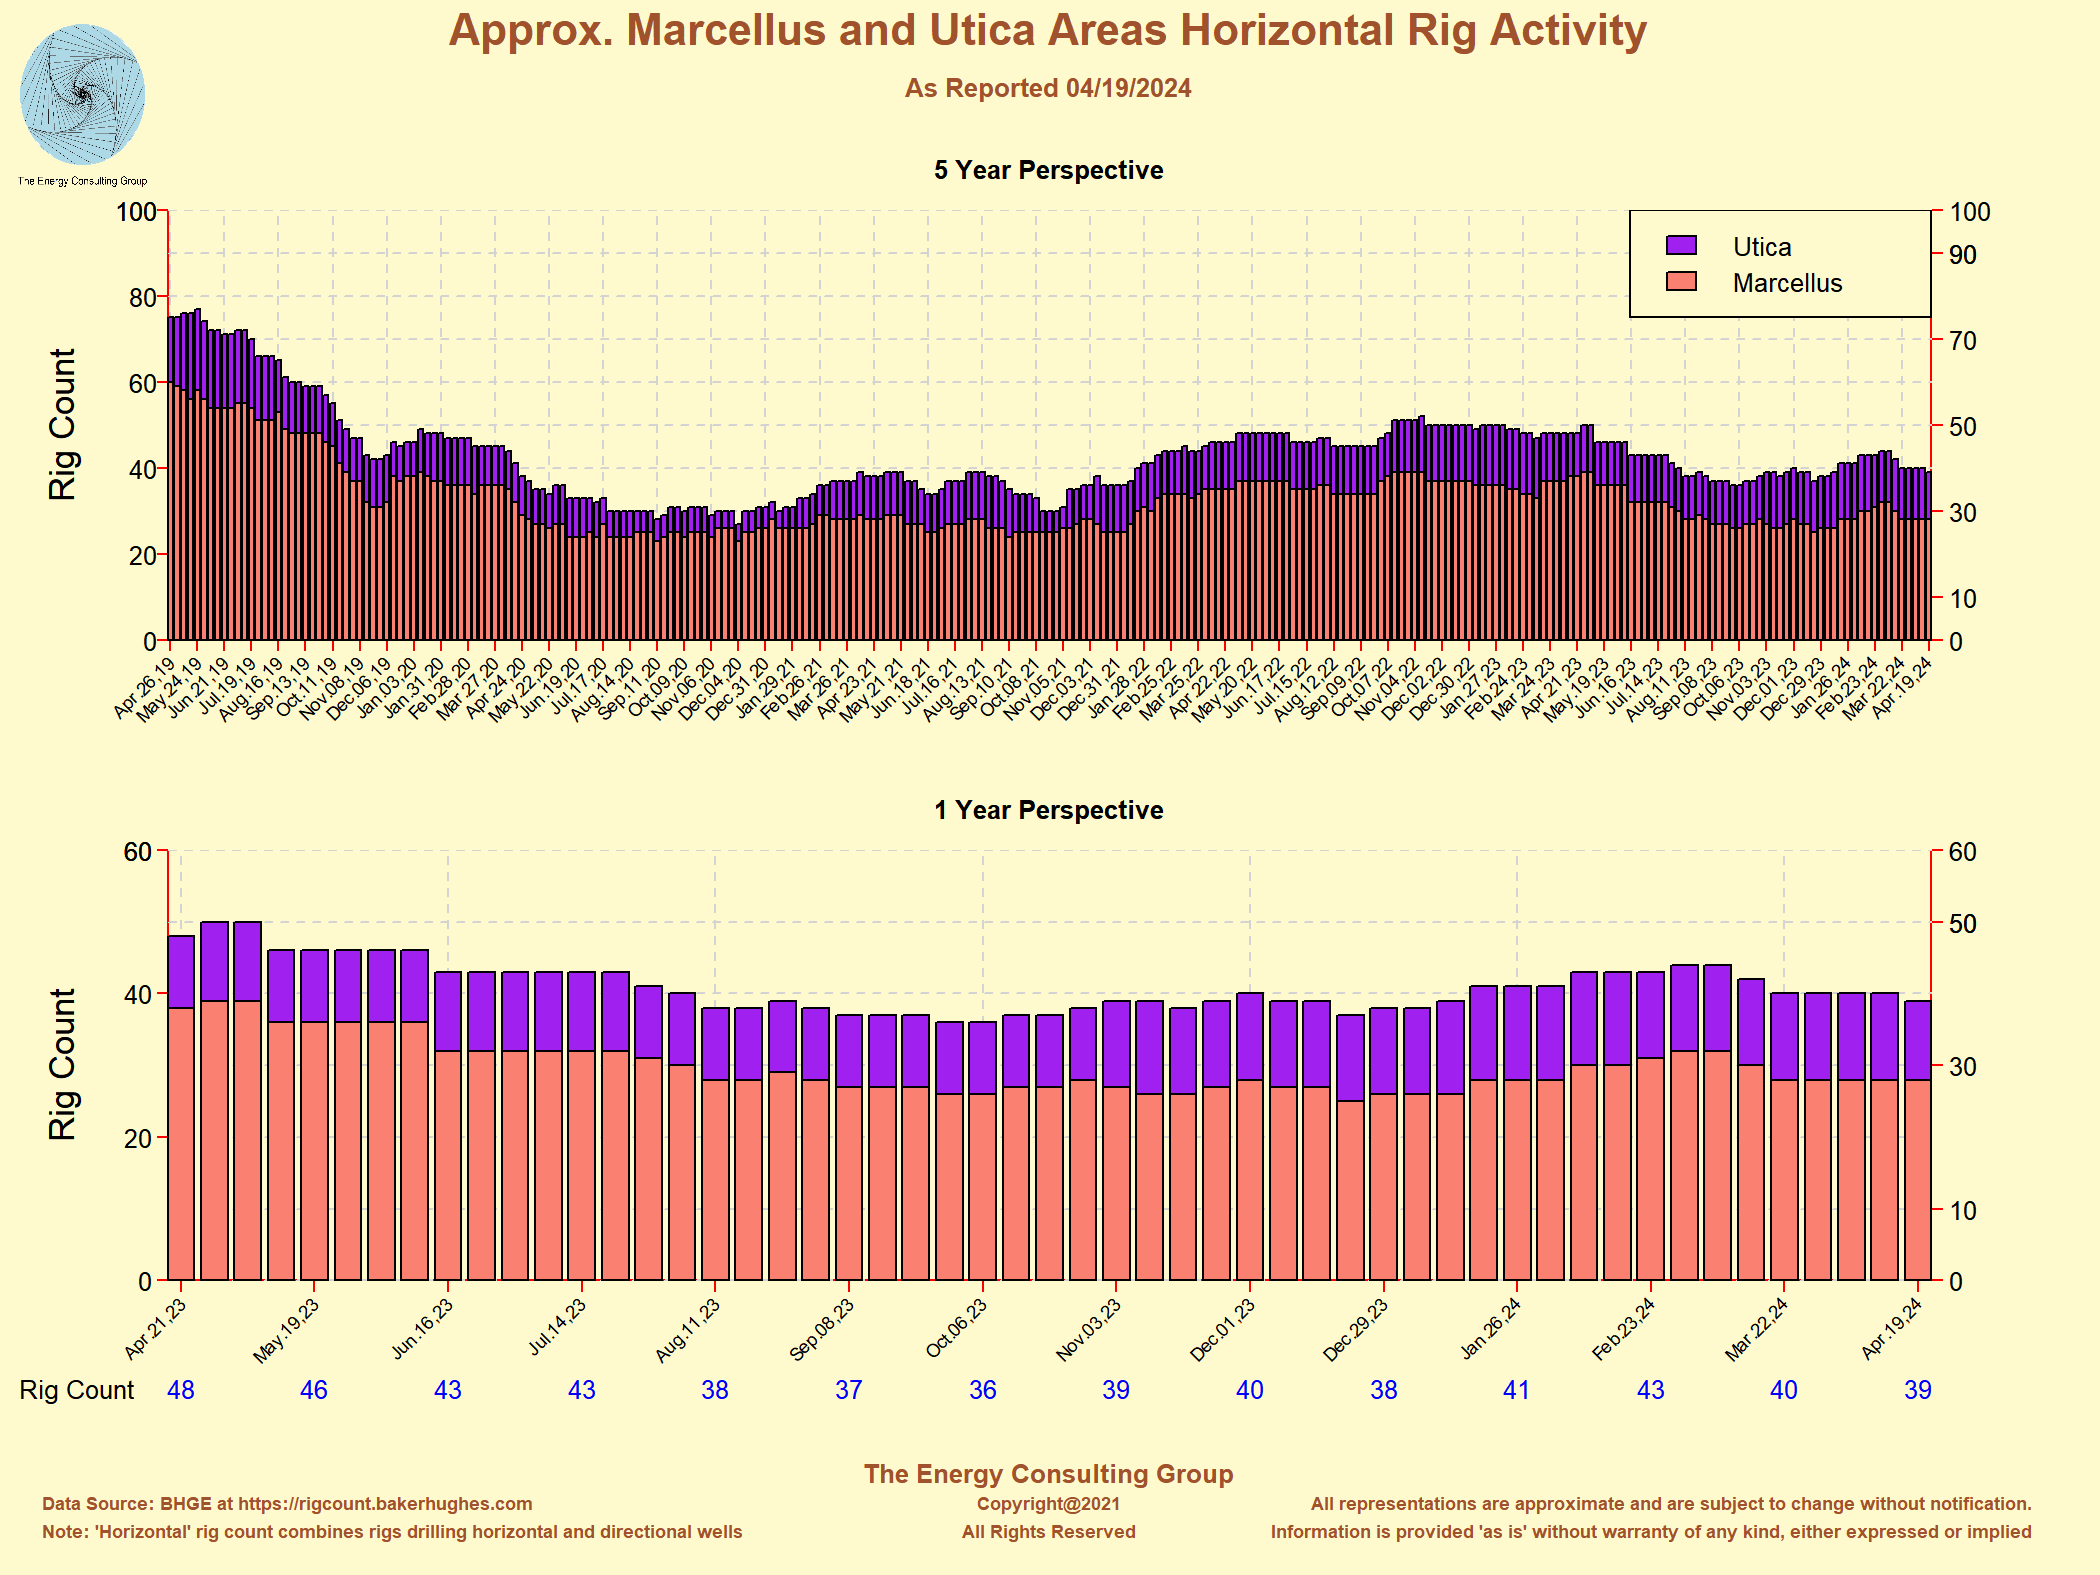
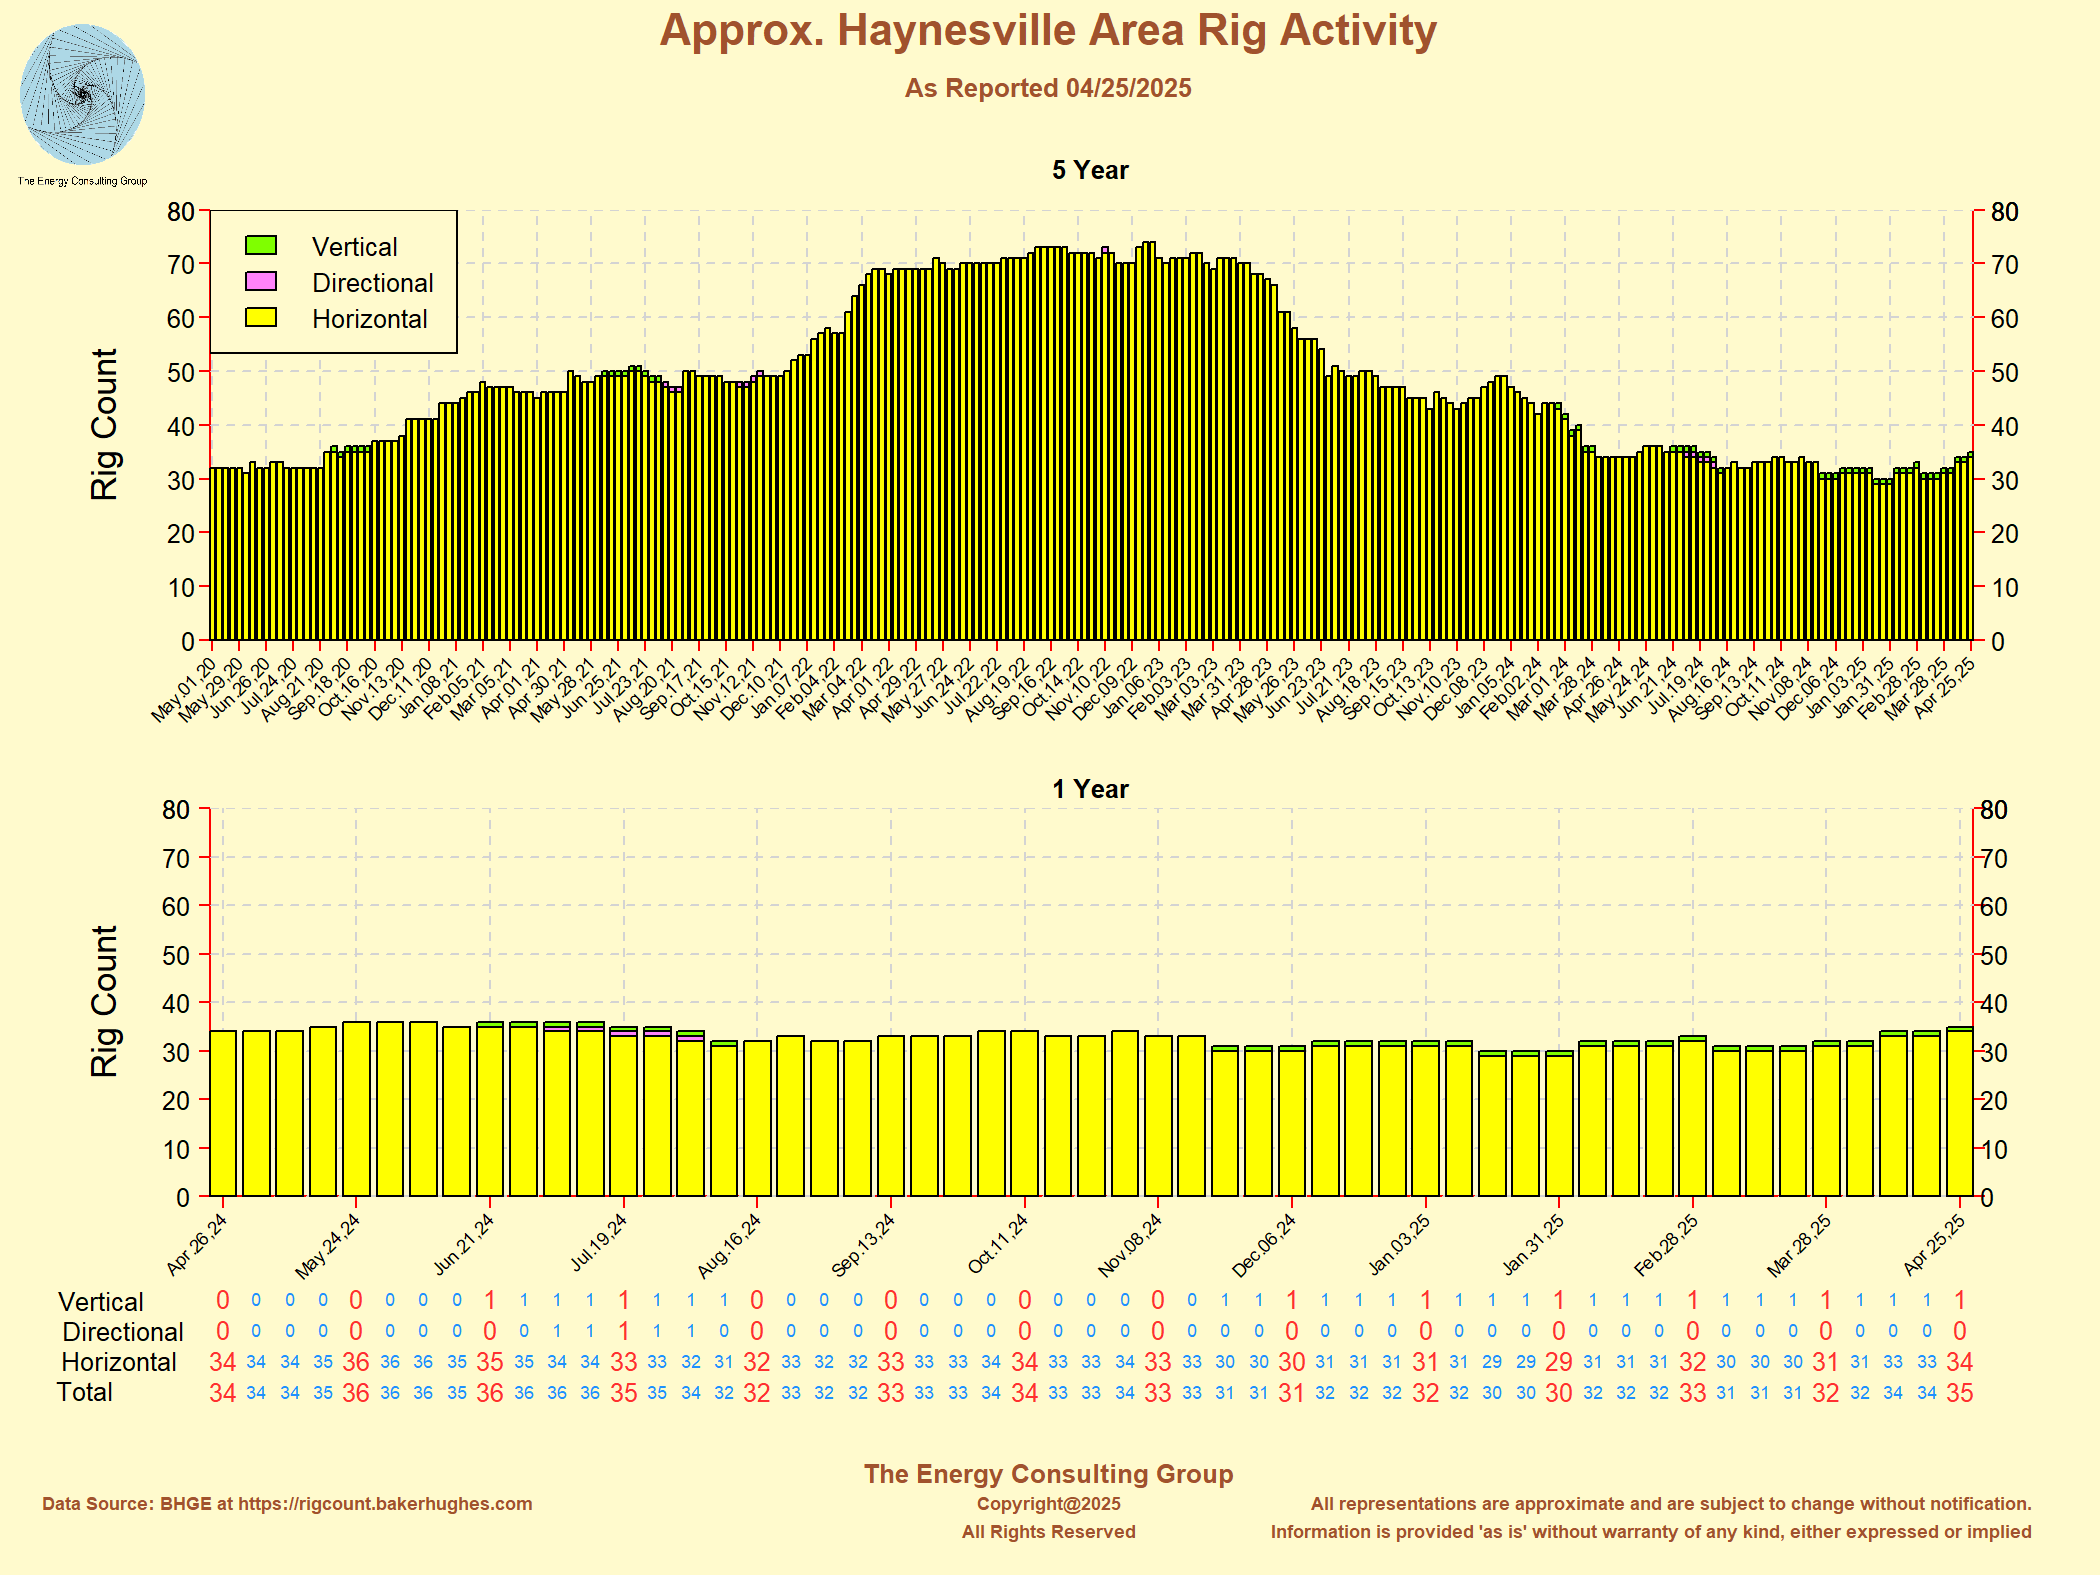
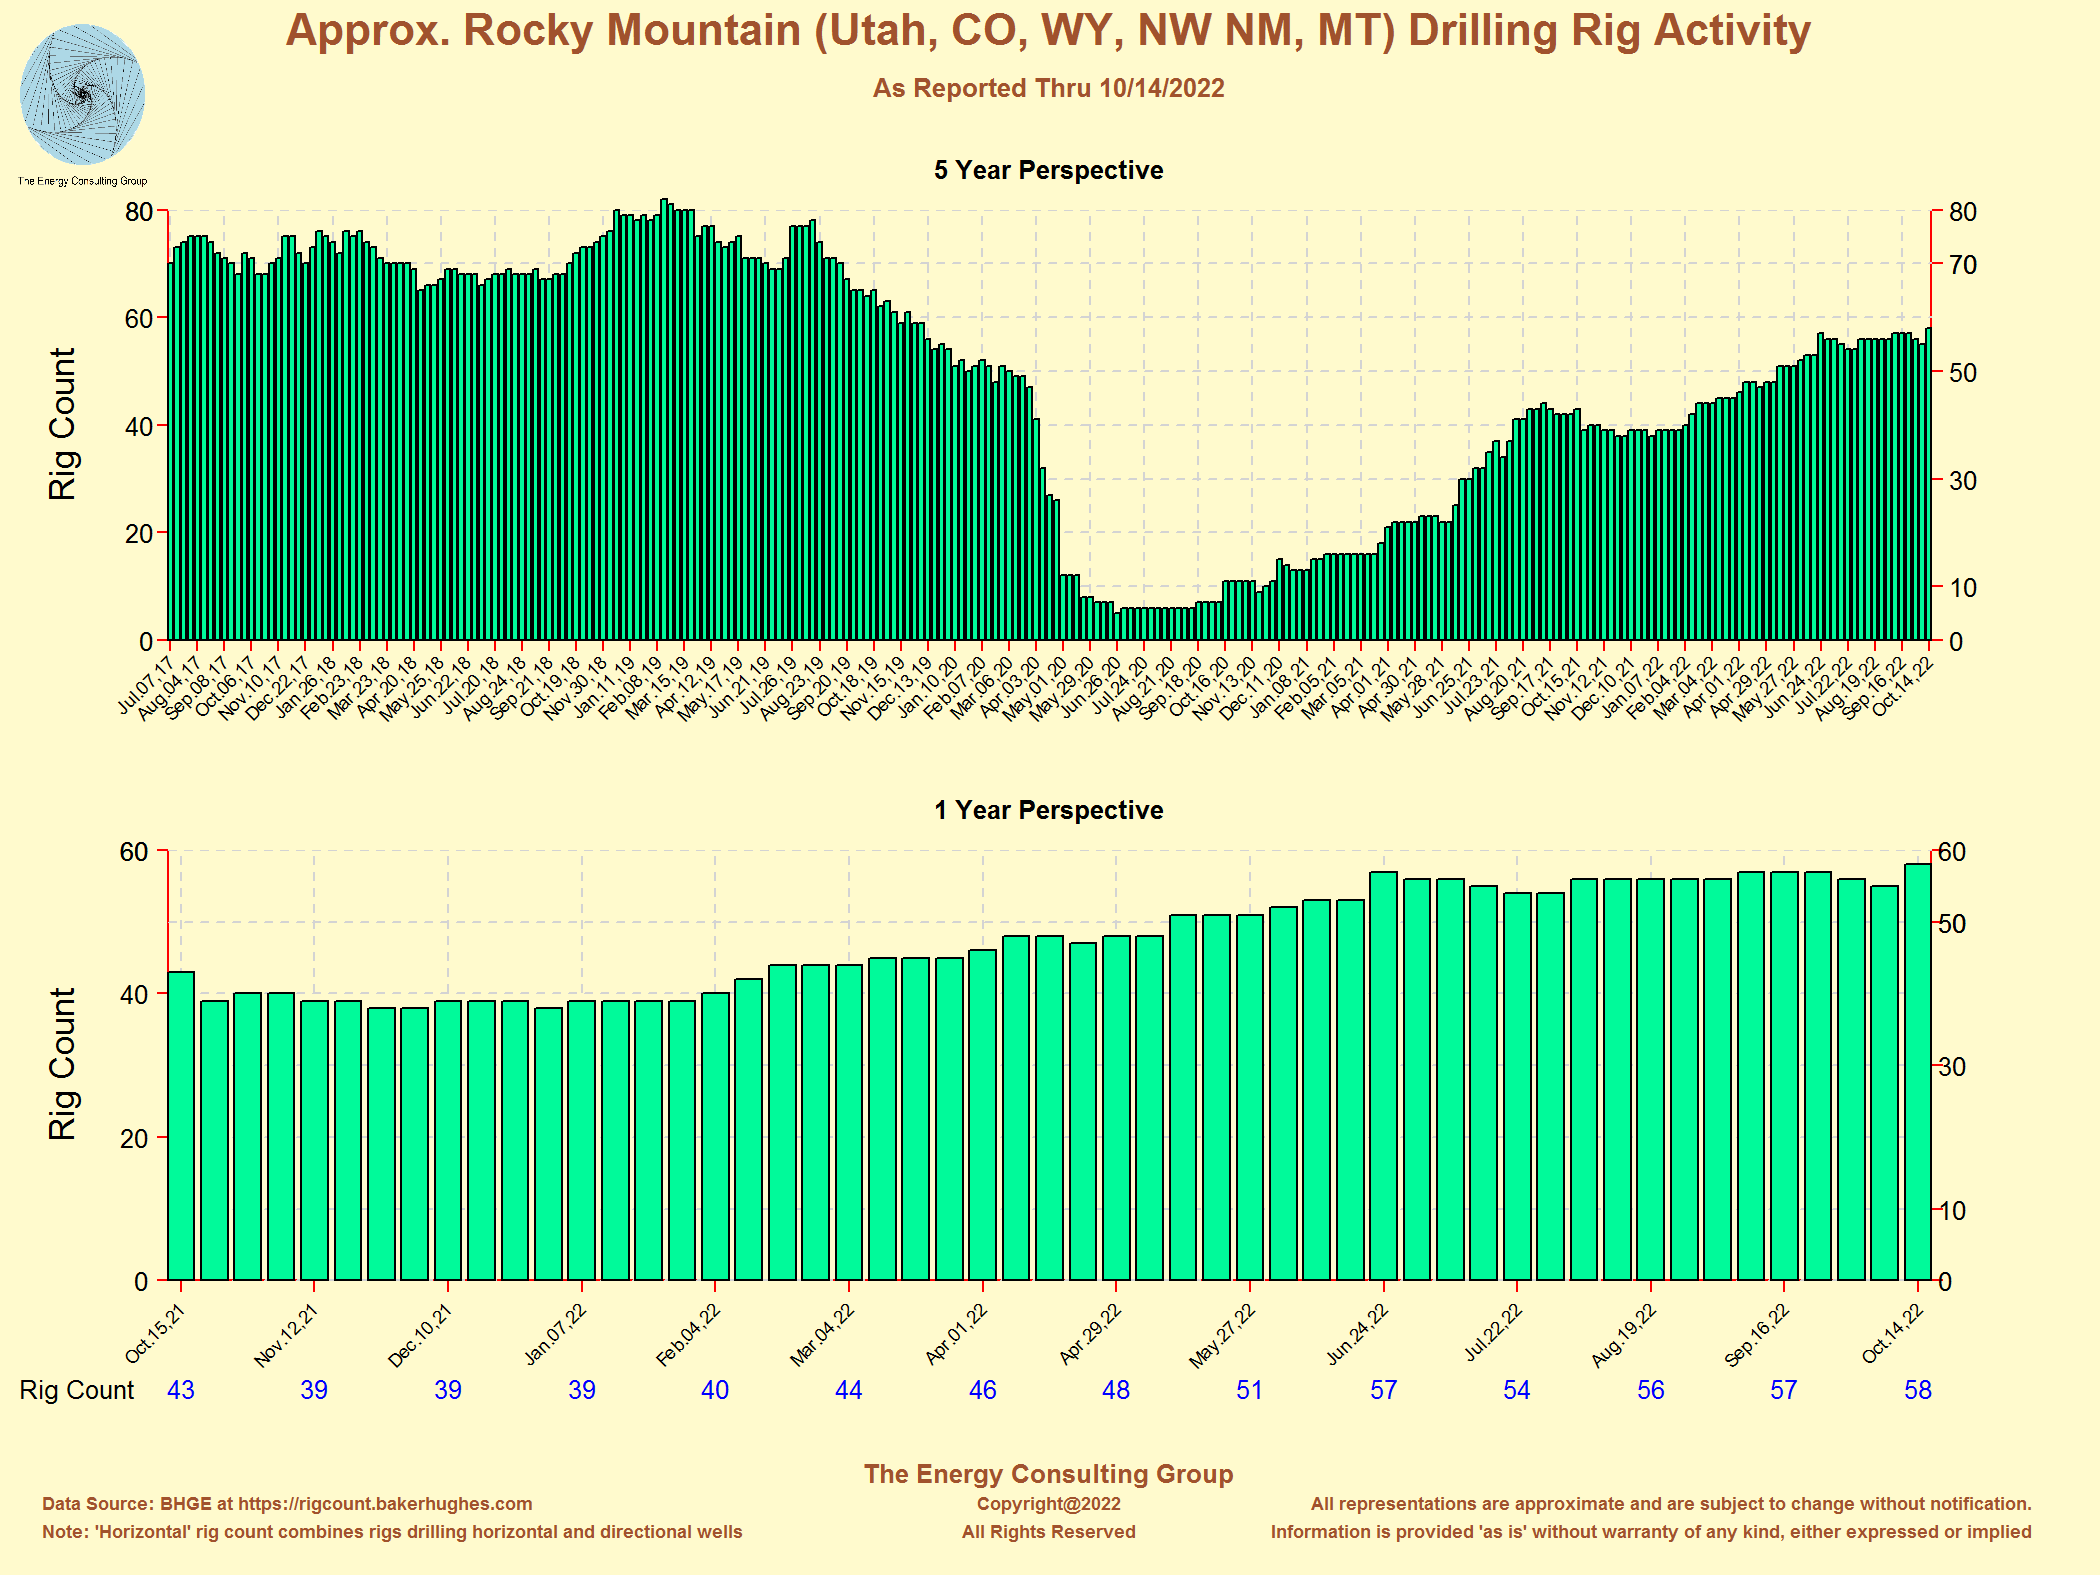
PermianLinks to area specific, oil and gas drilling rig activity maps Bakken Eagle Ford and Eaglebine in South Texas Anadarko(STACK/SCOOP in central Oklahoma) Appalachia (Marcellus and Utica) Rocky Mountain(DJ PowderRiver) Haynesville California |
February 2023
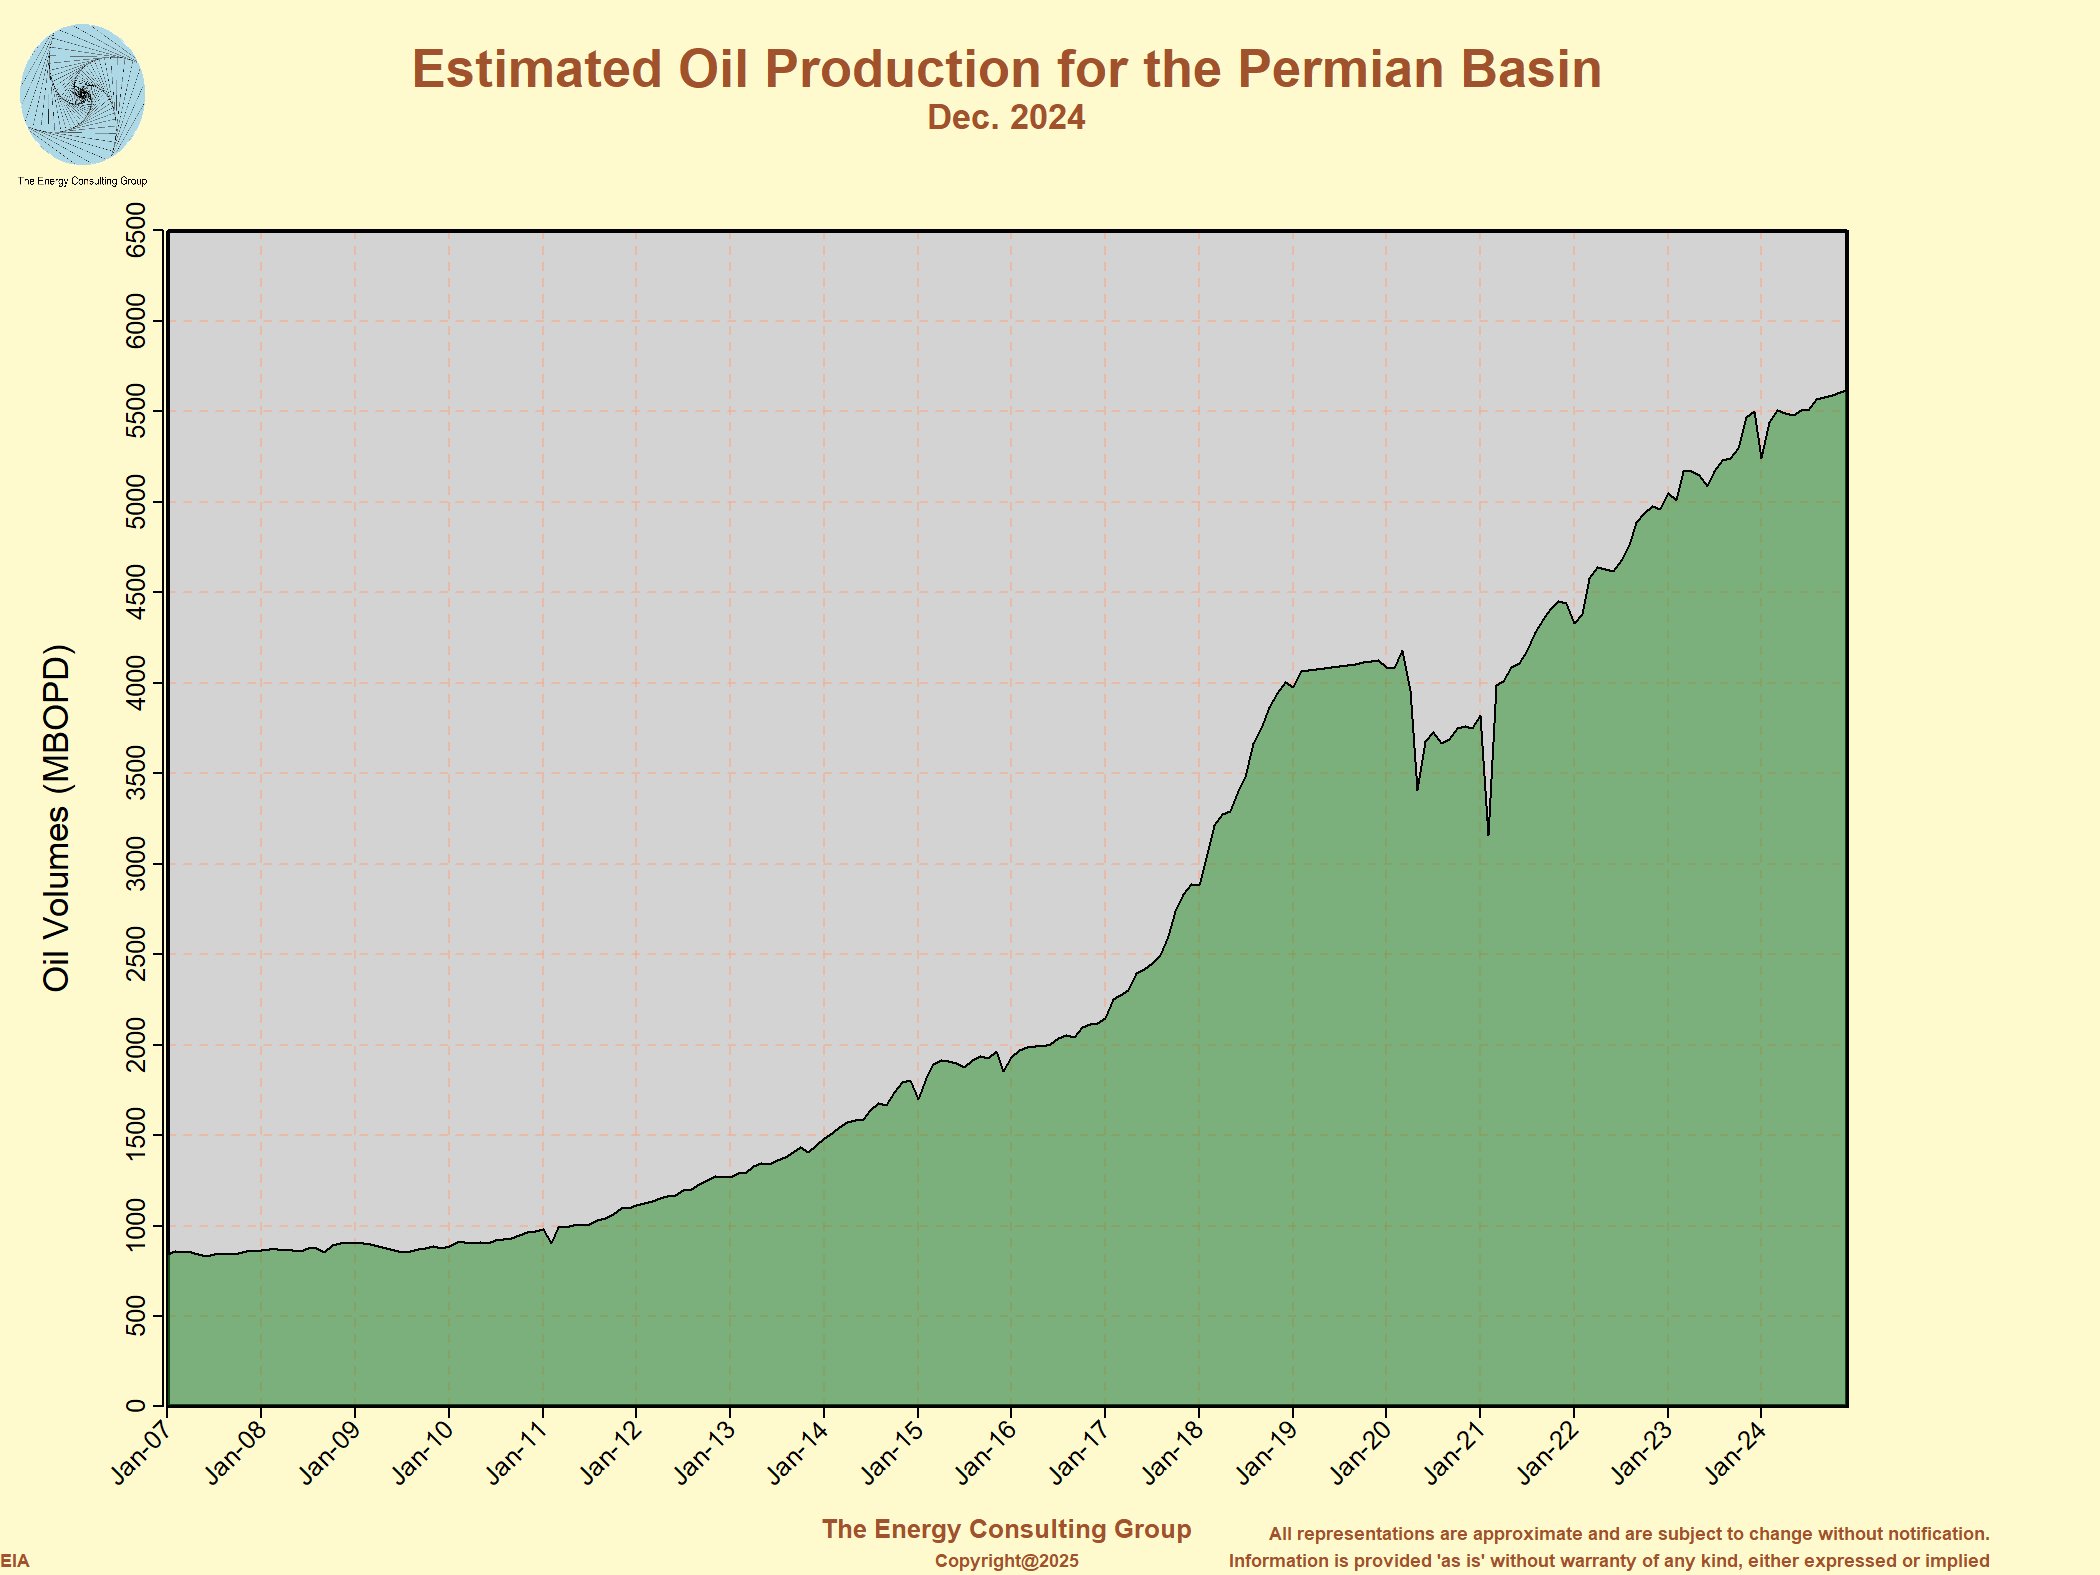
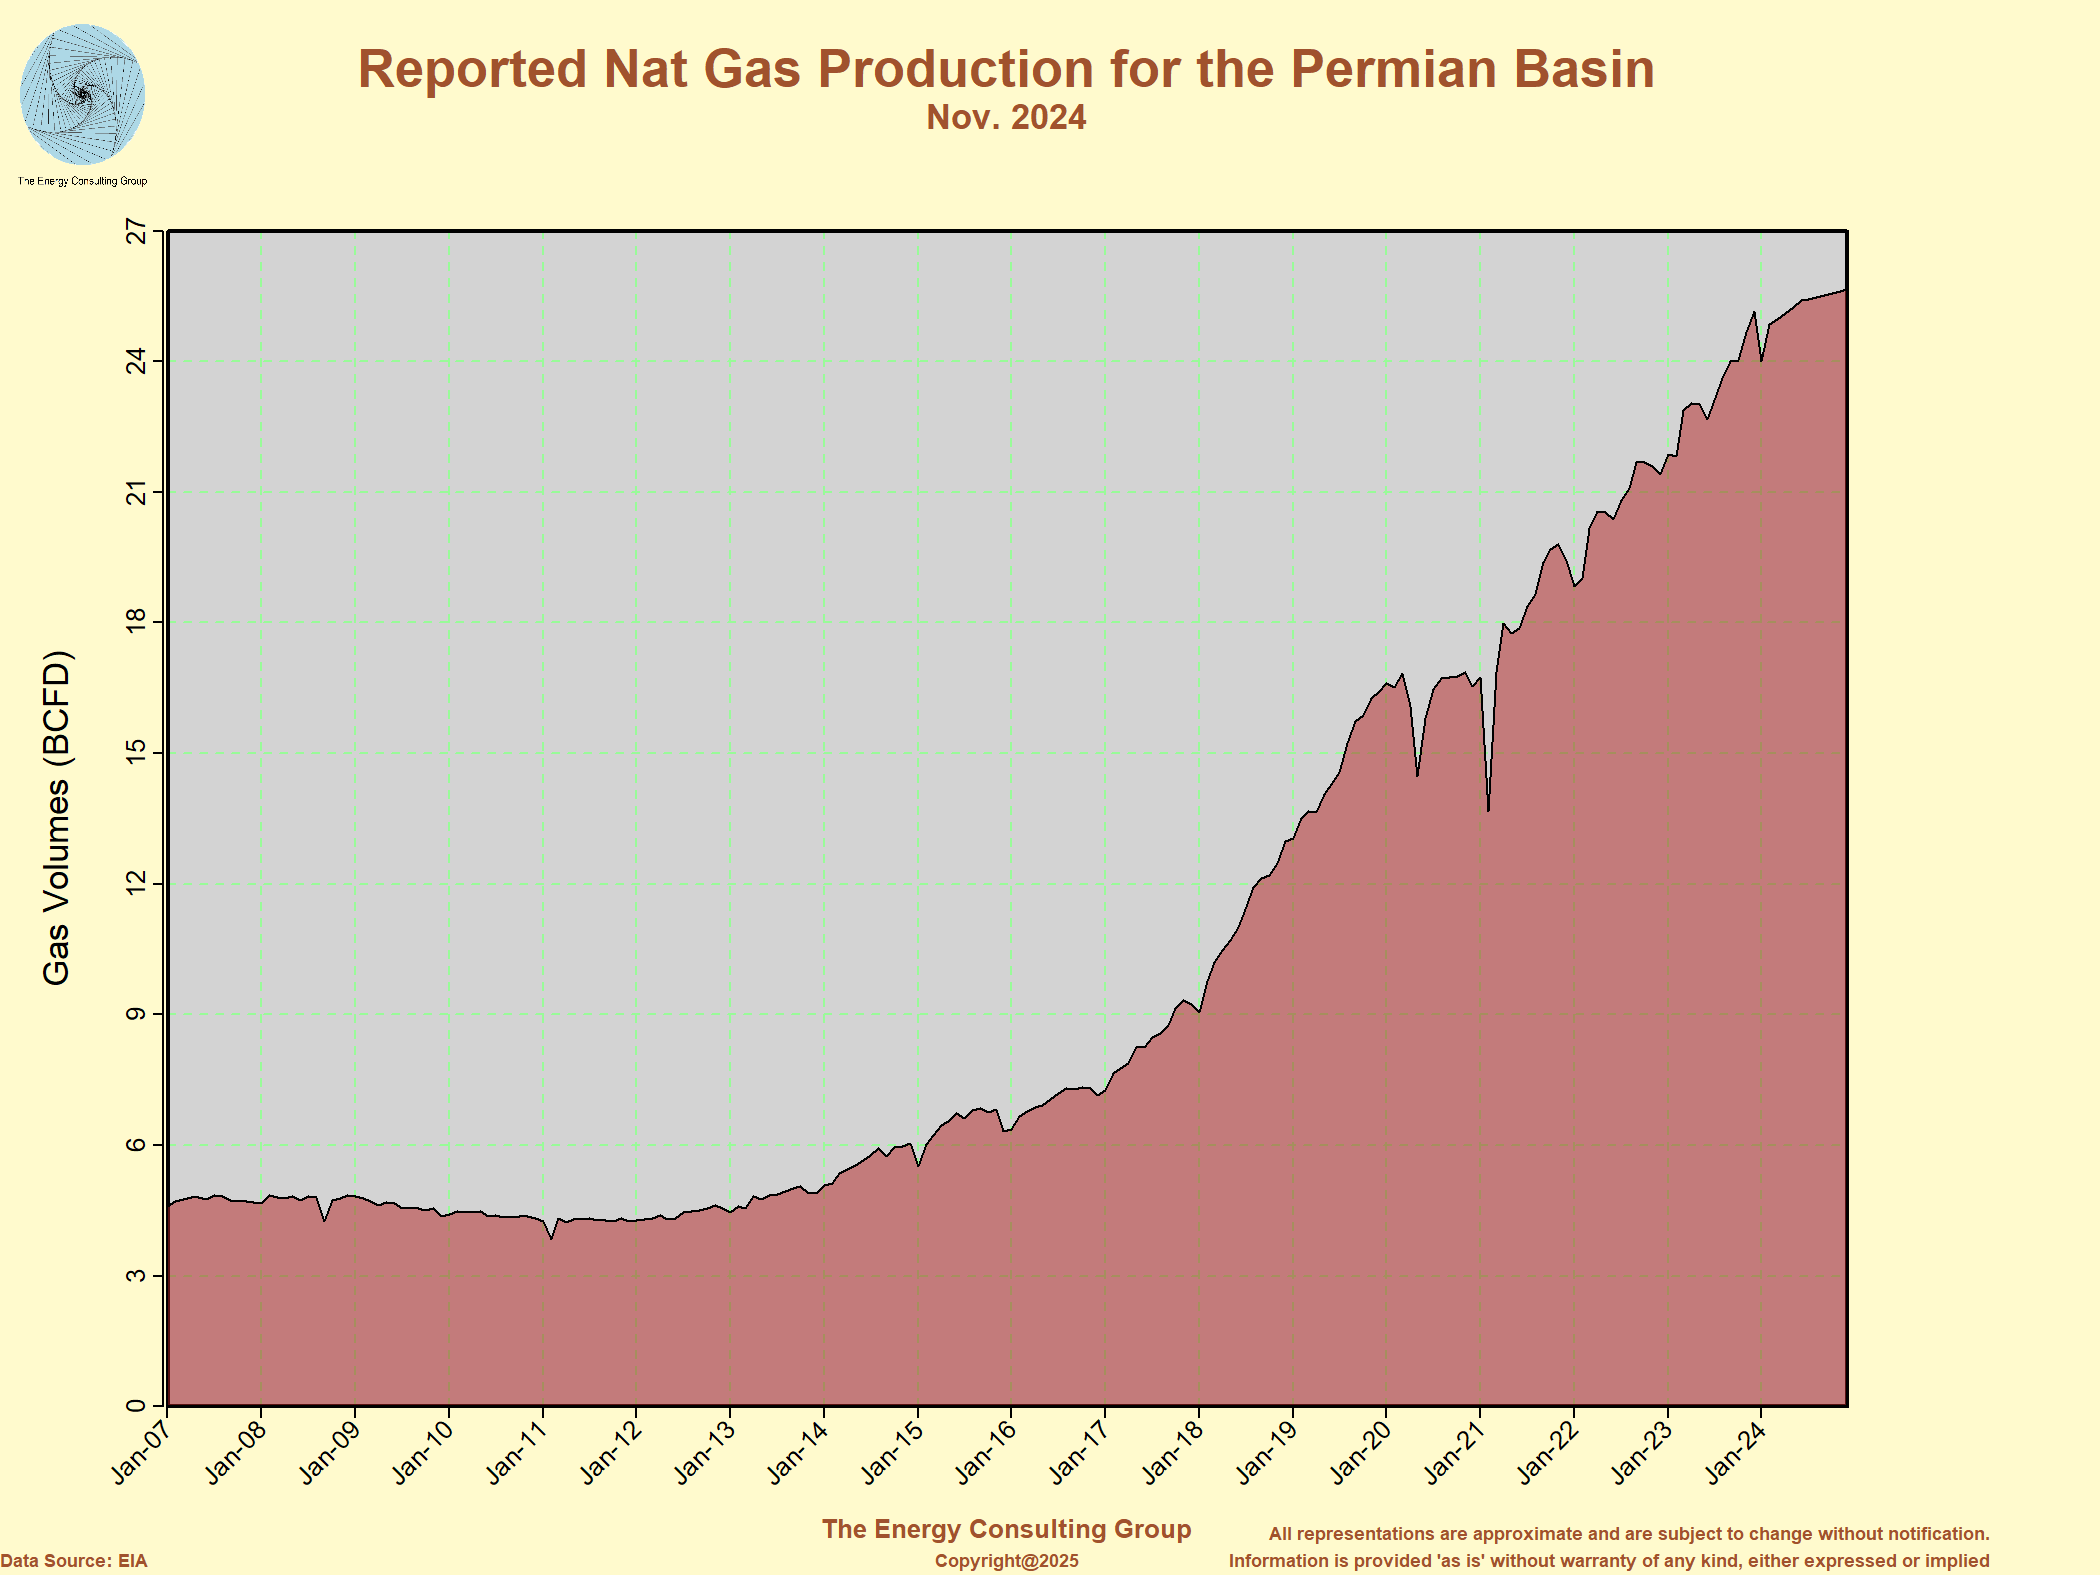
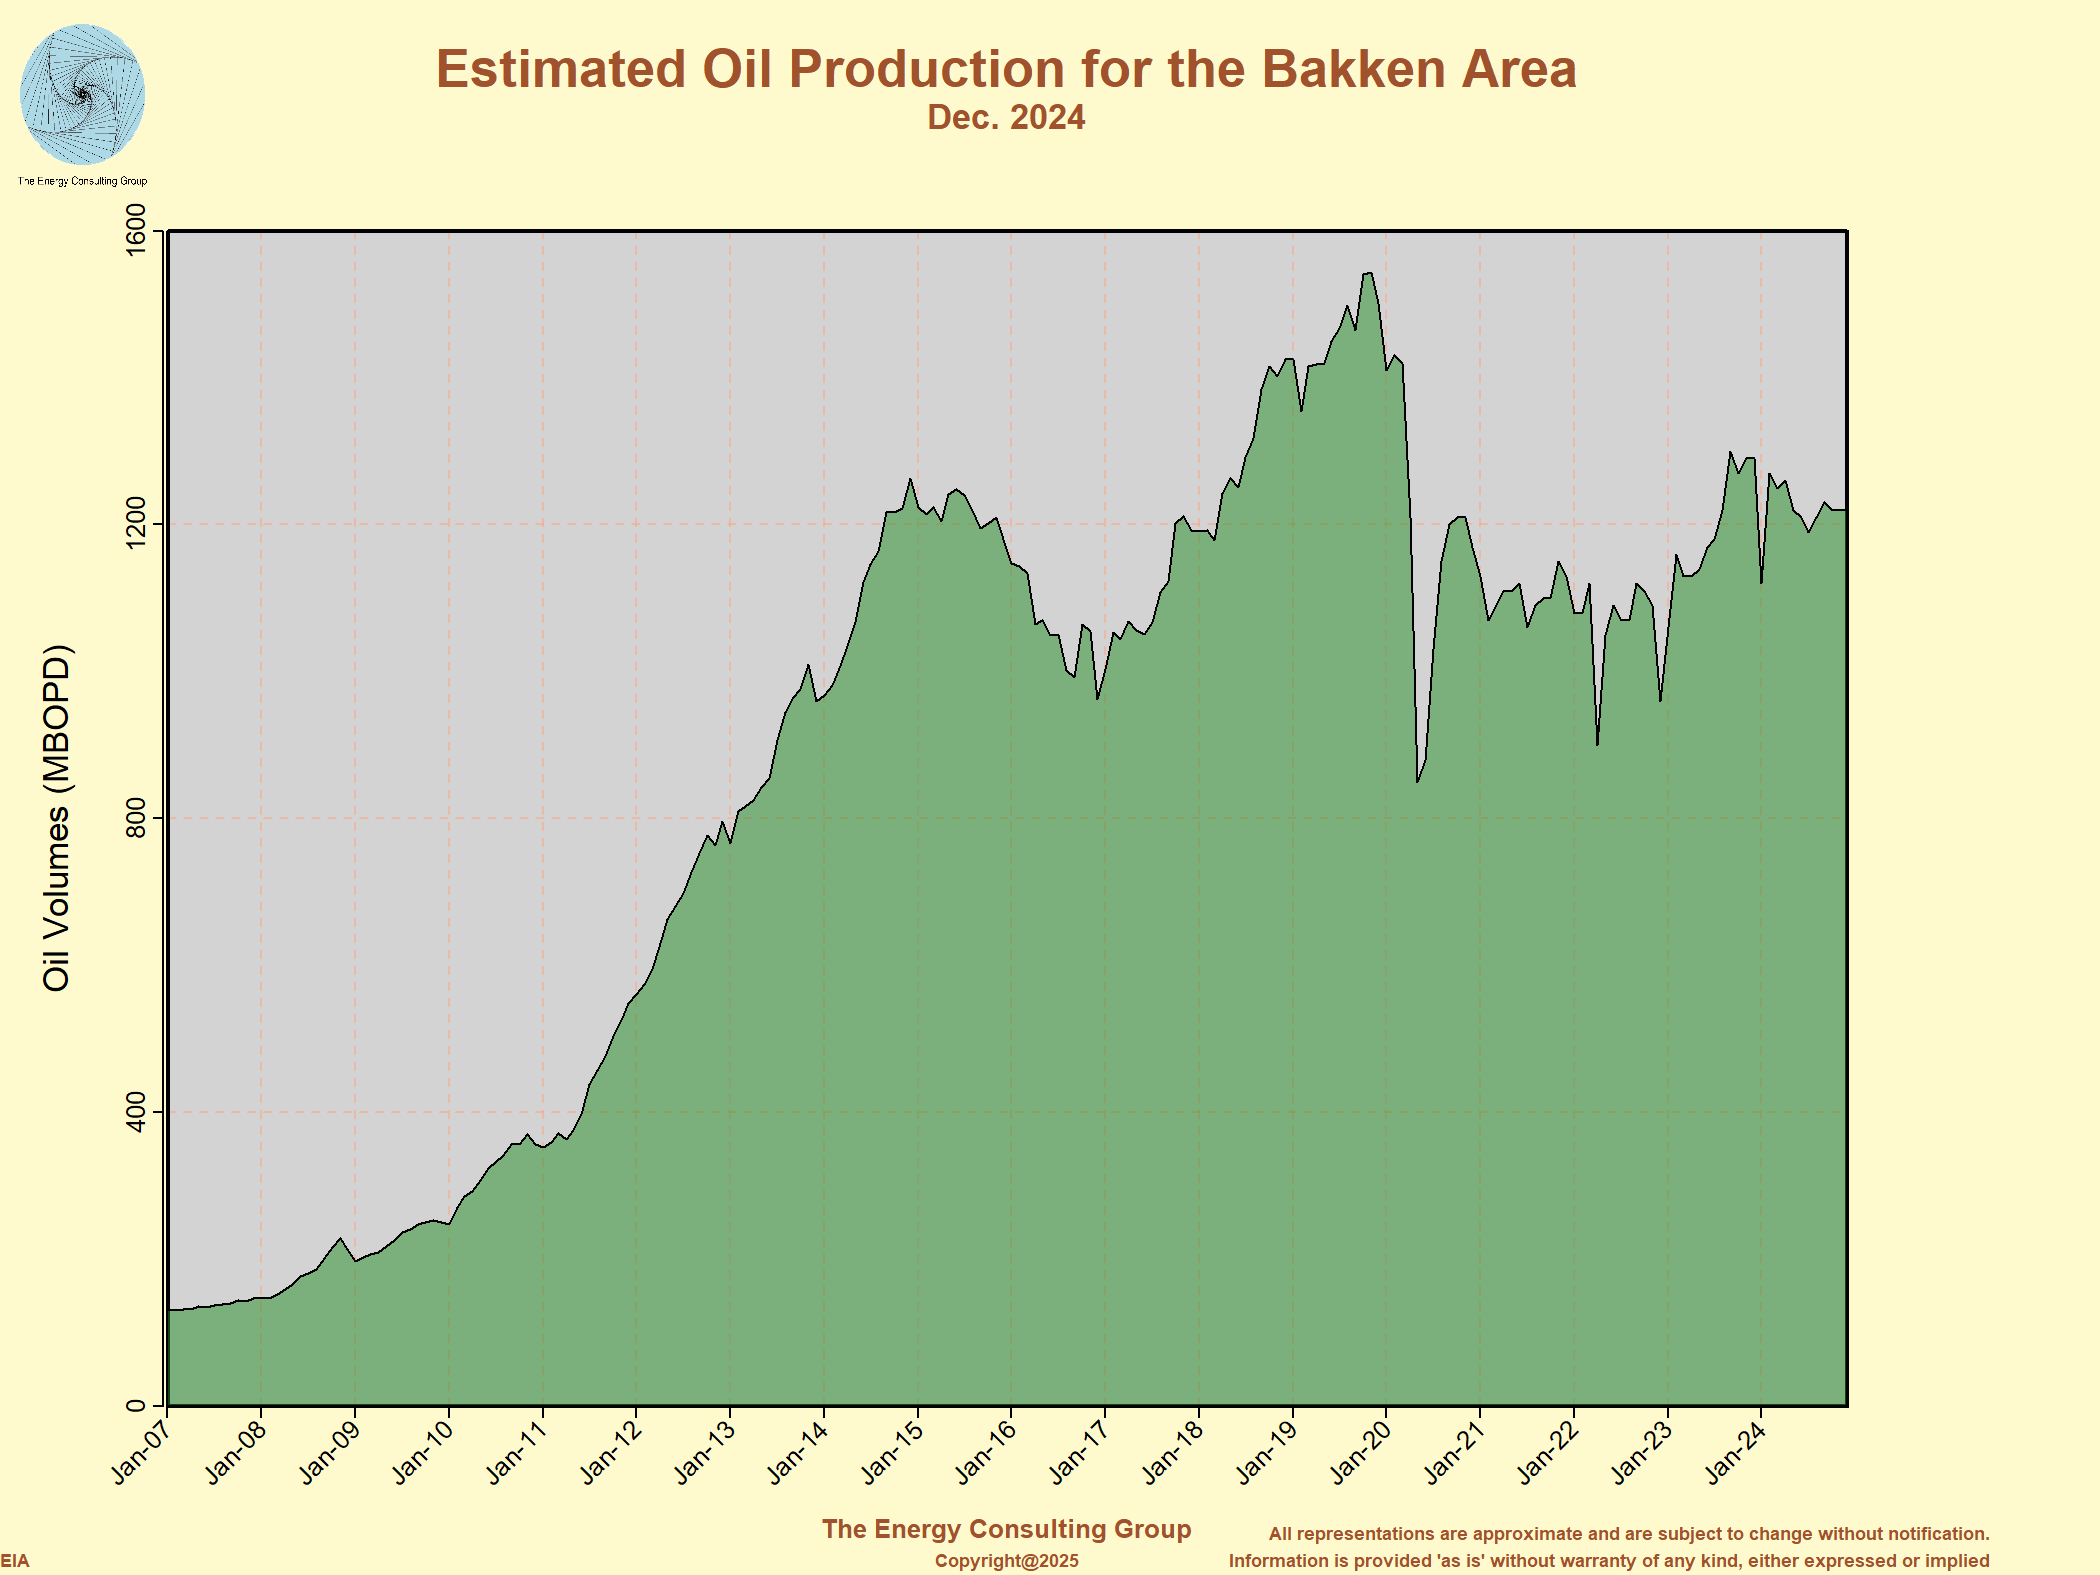
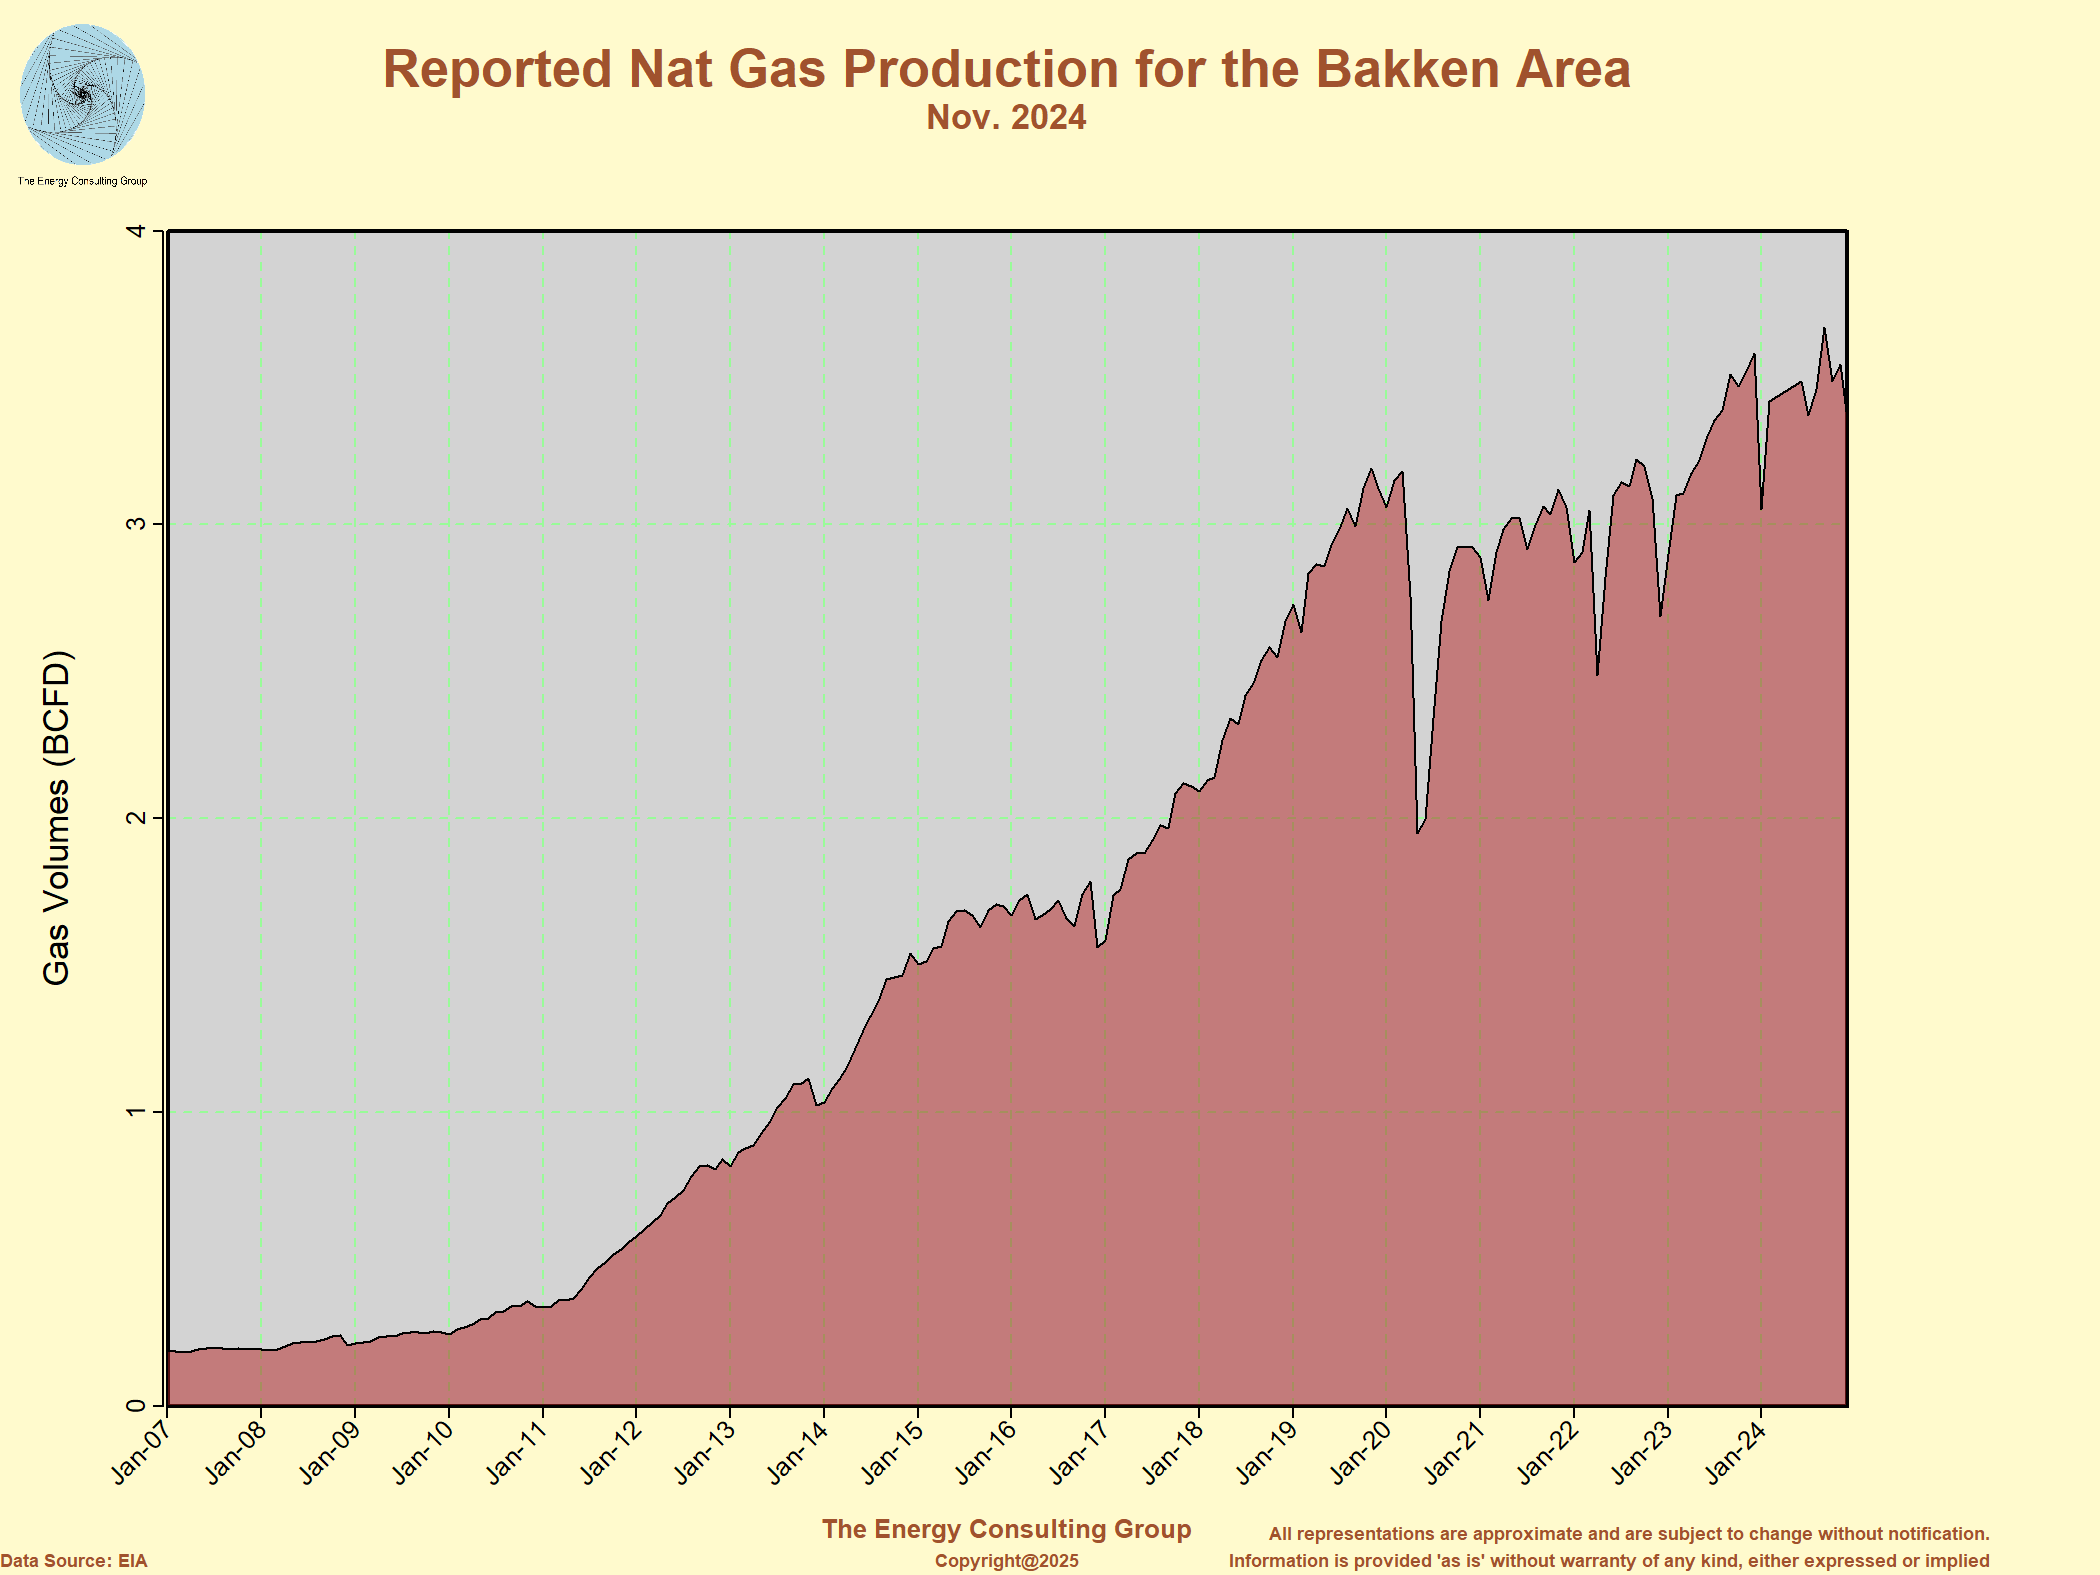
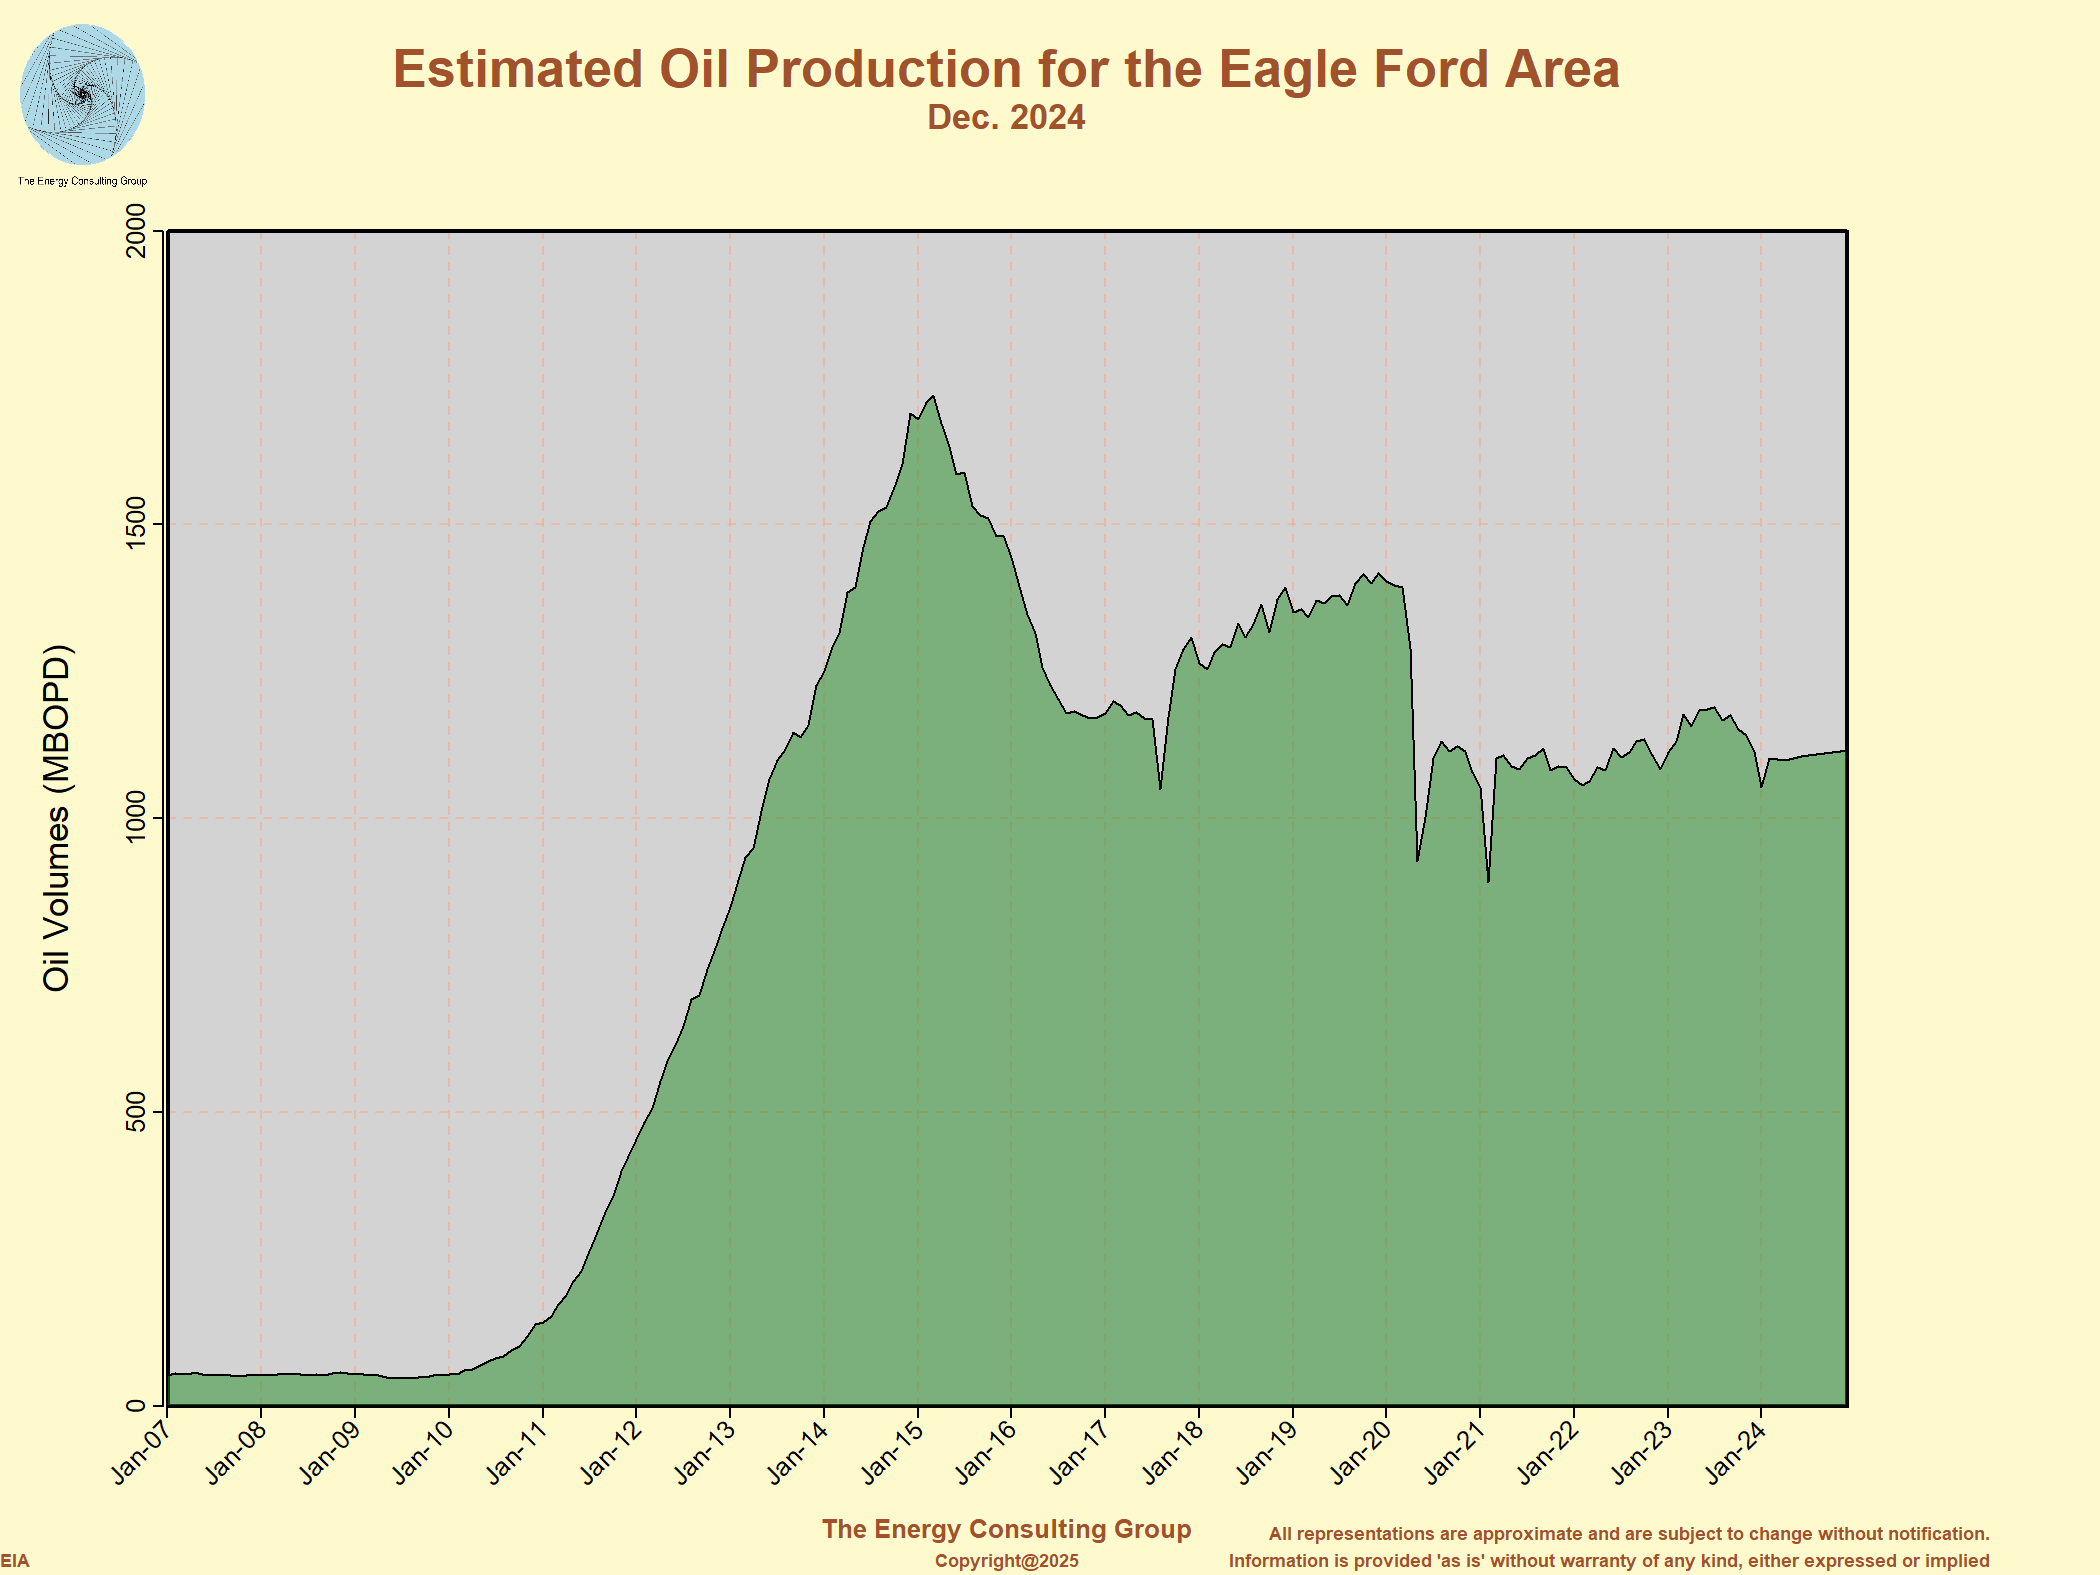
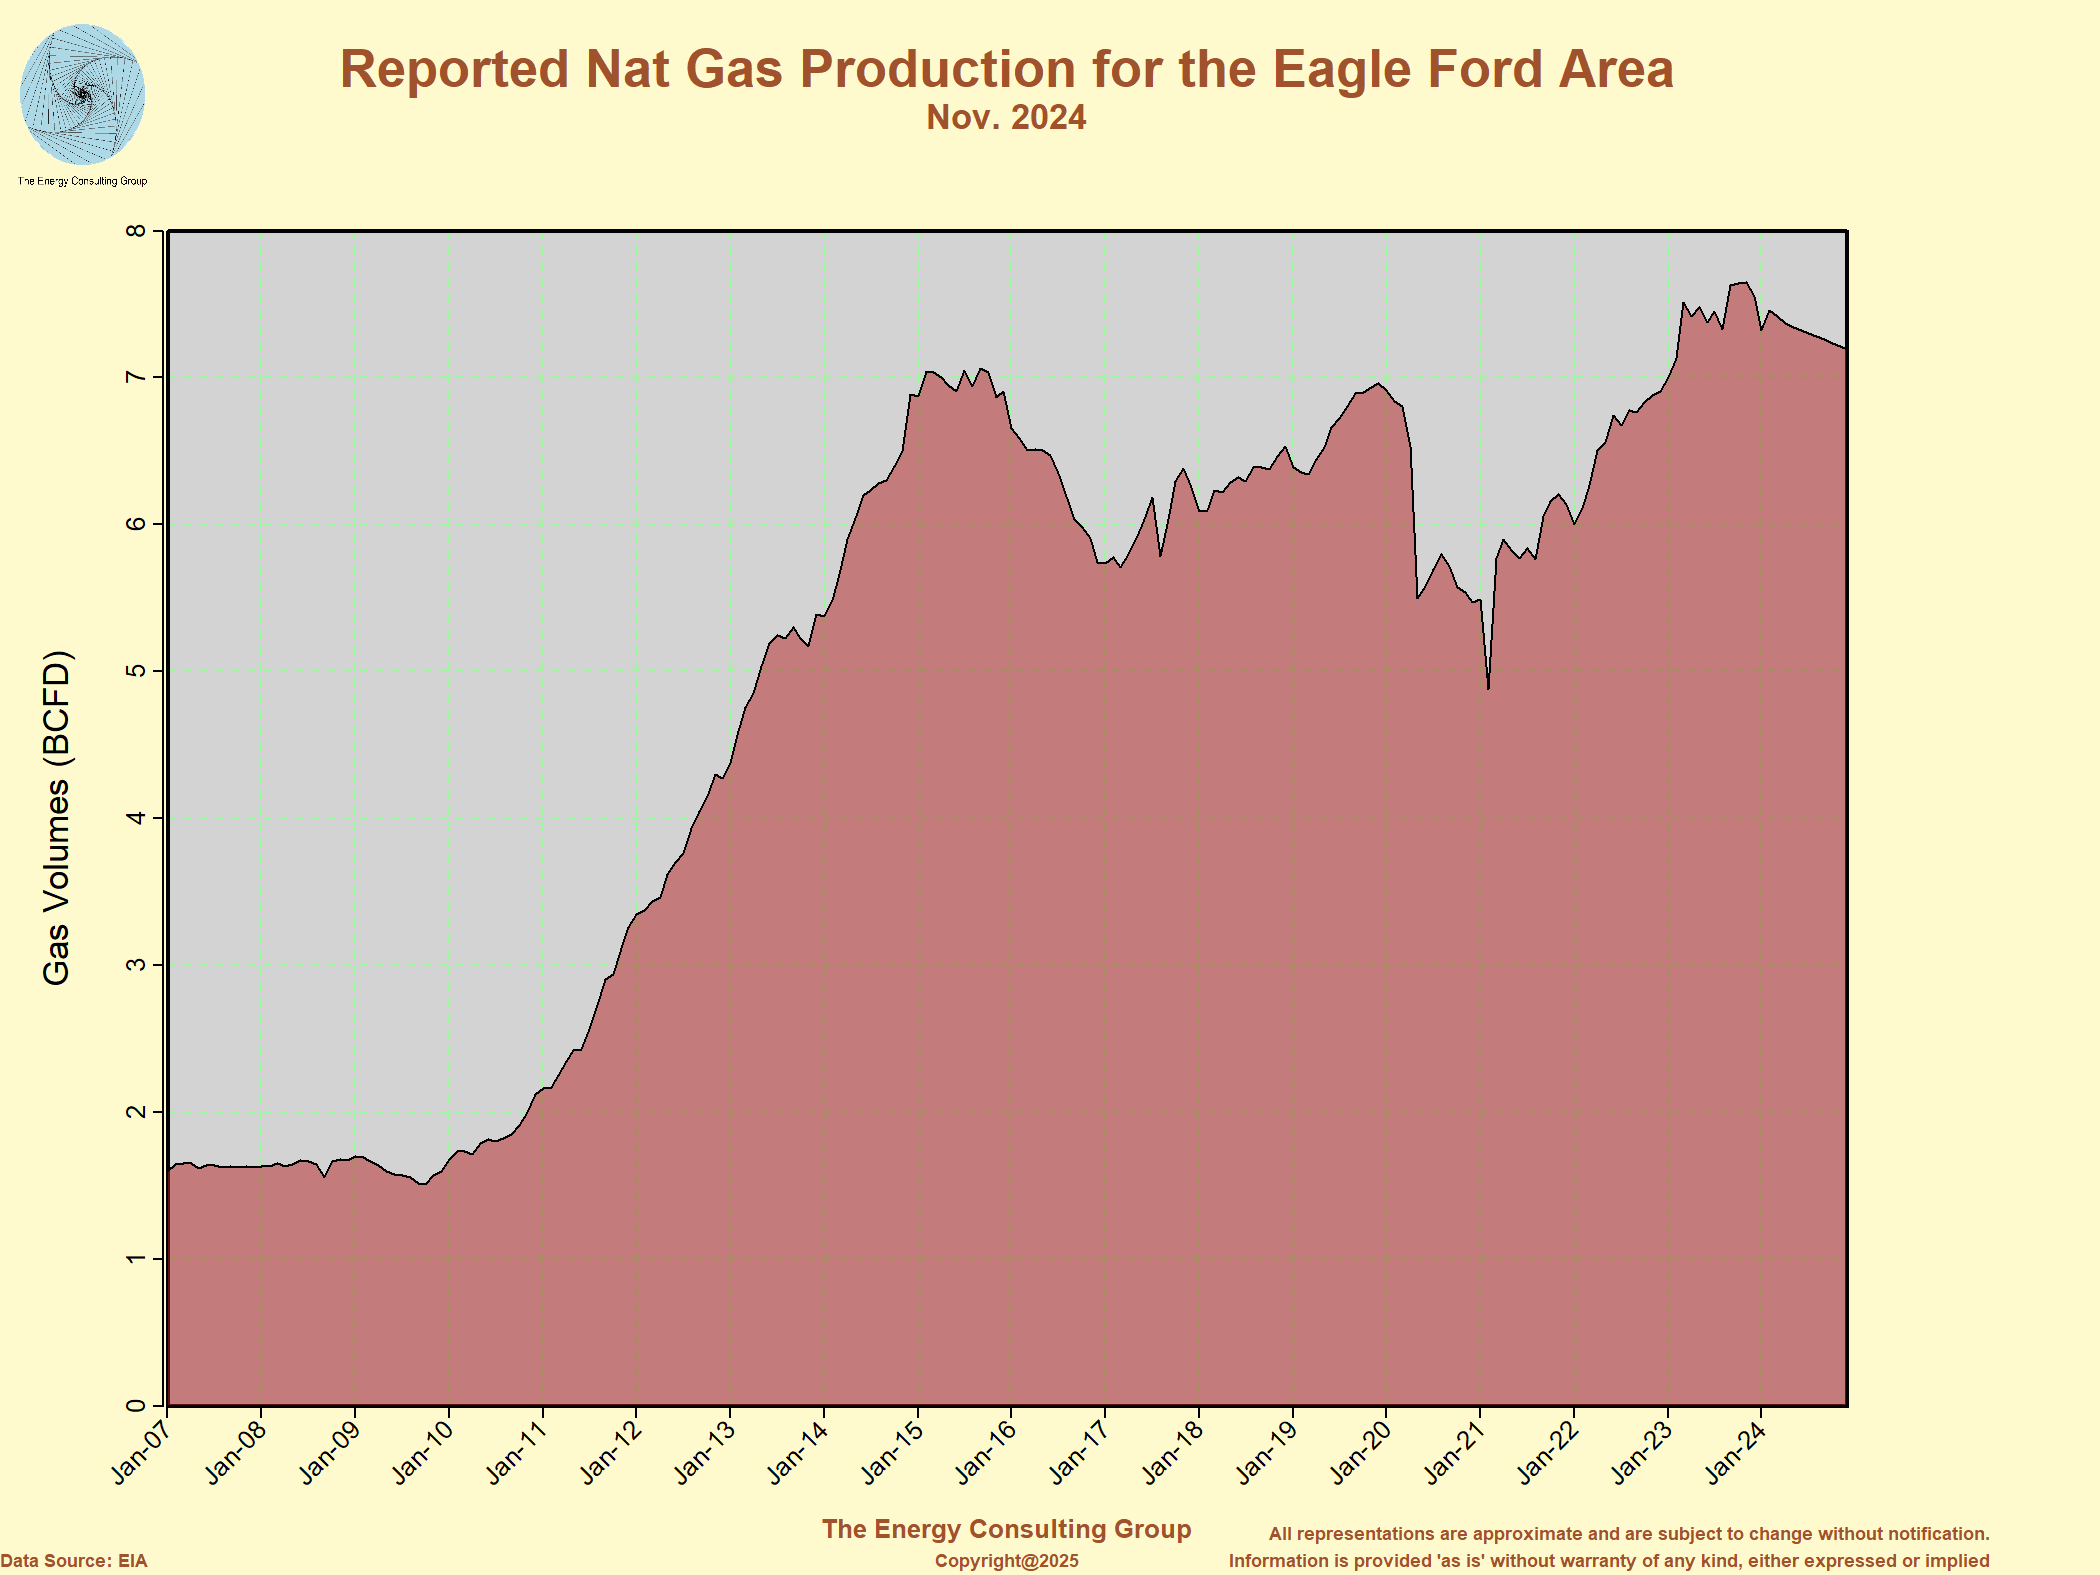
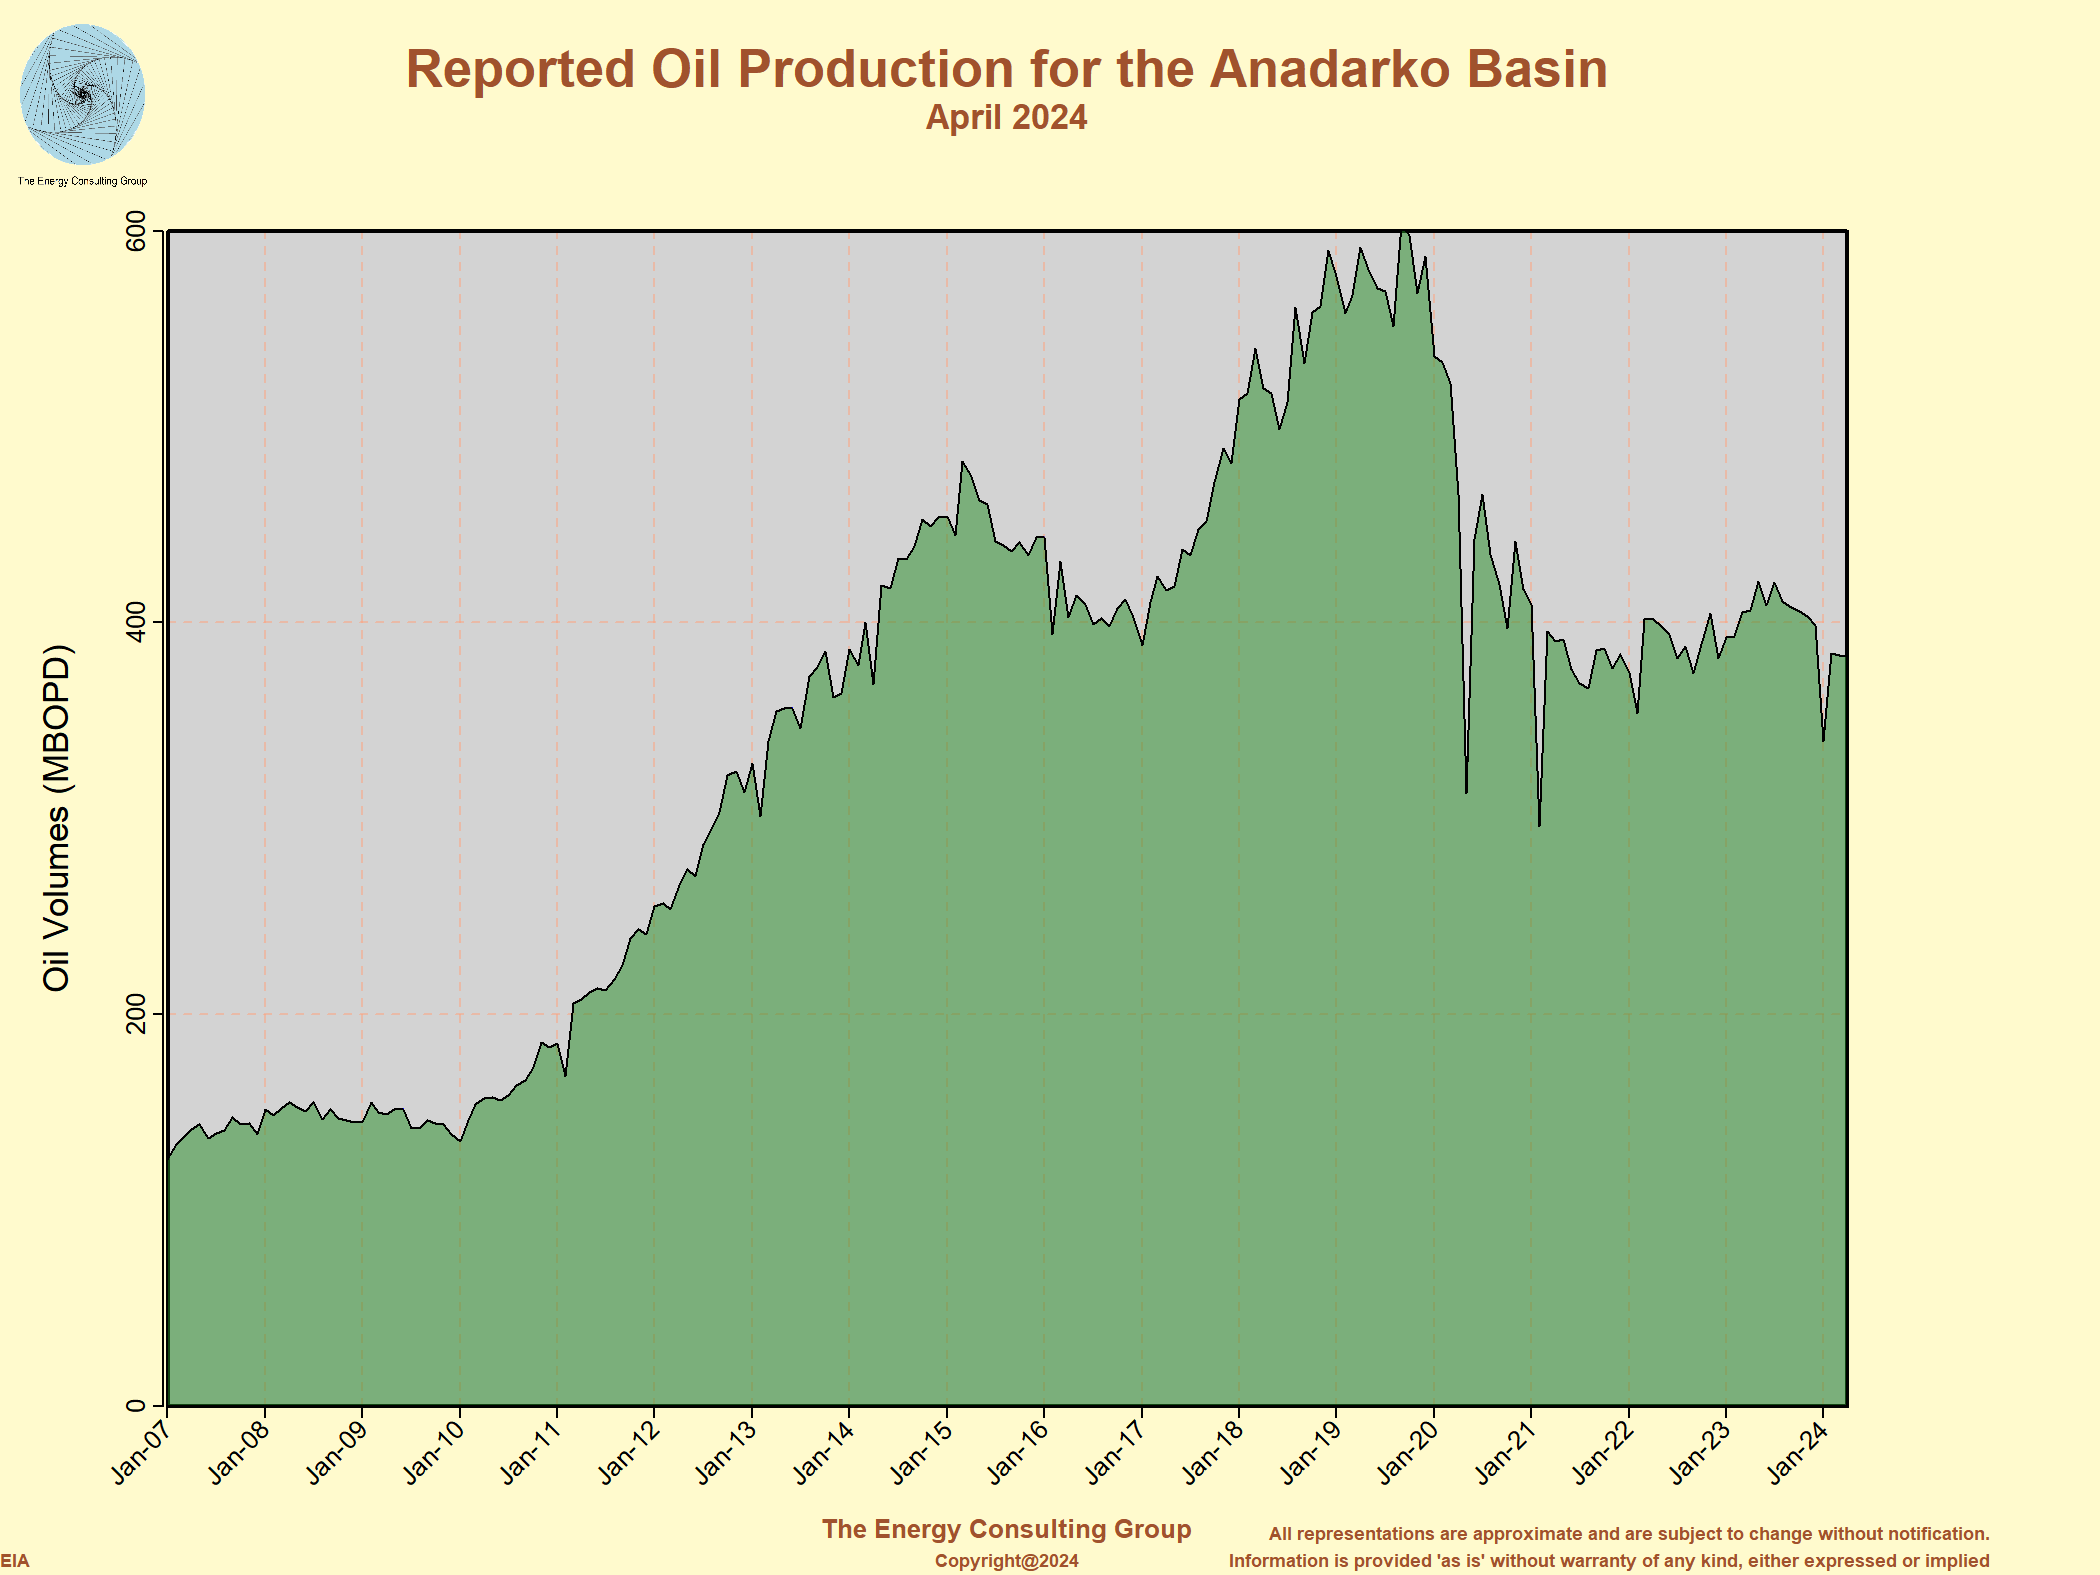
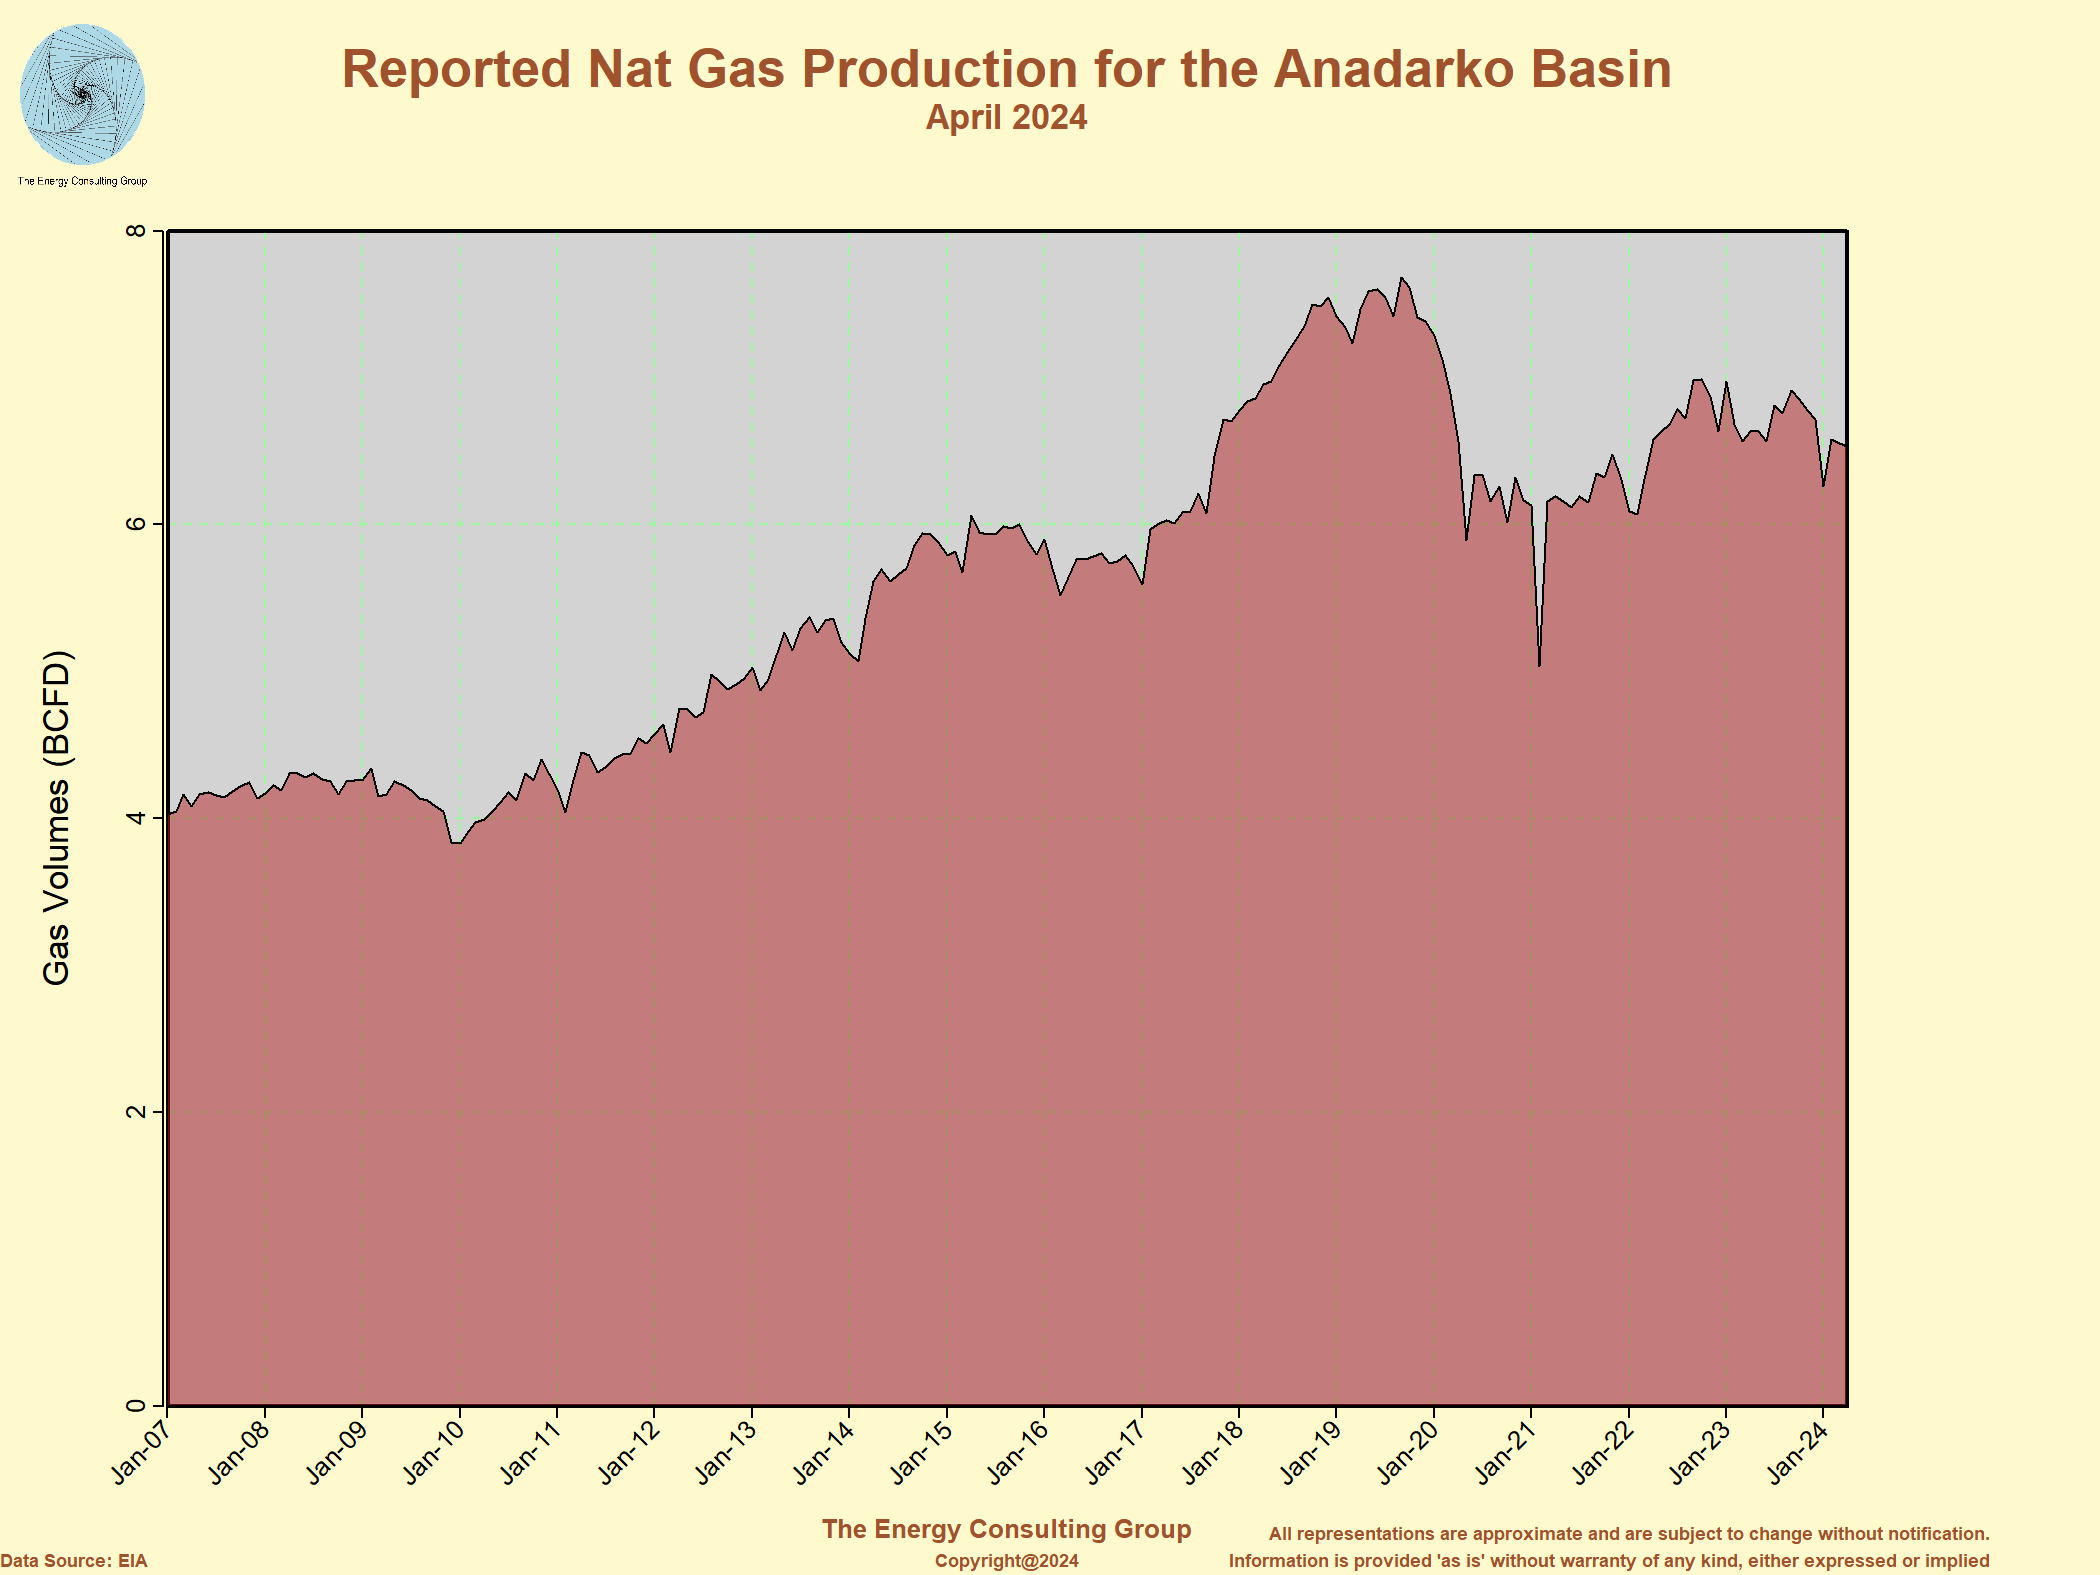
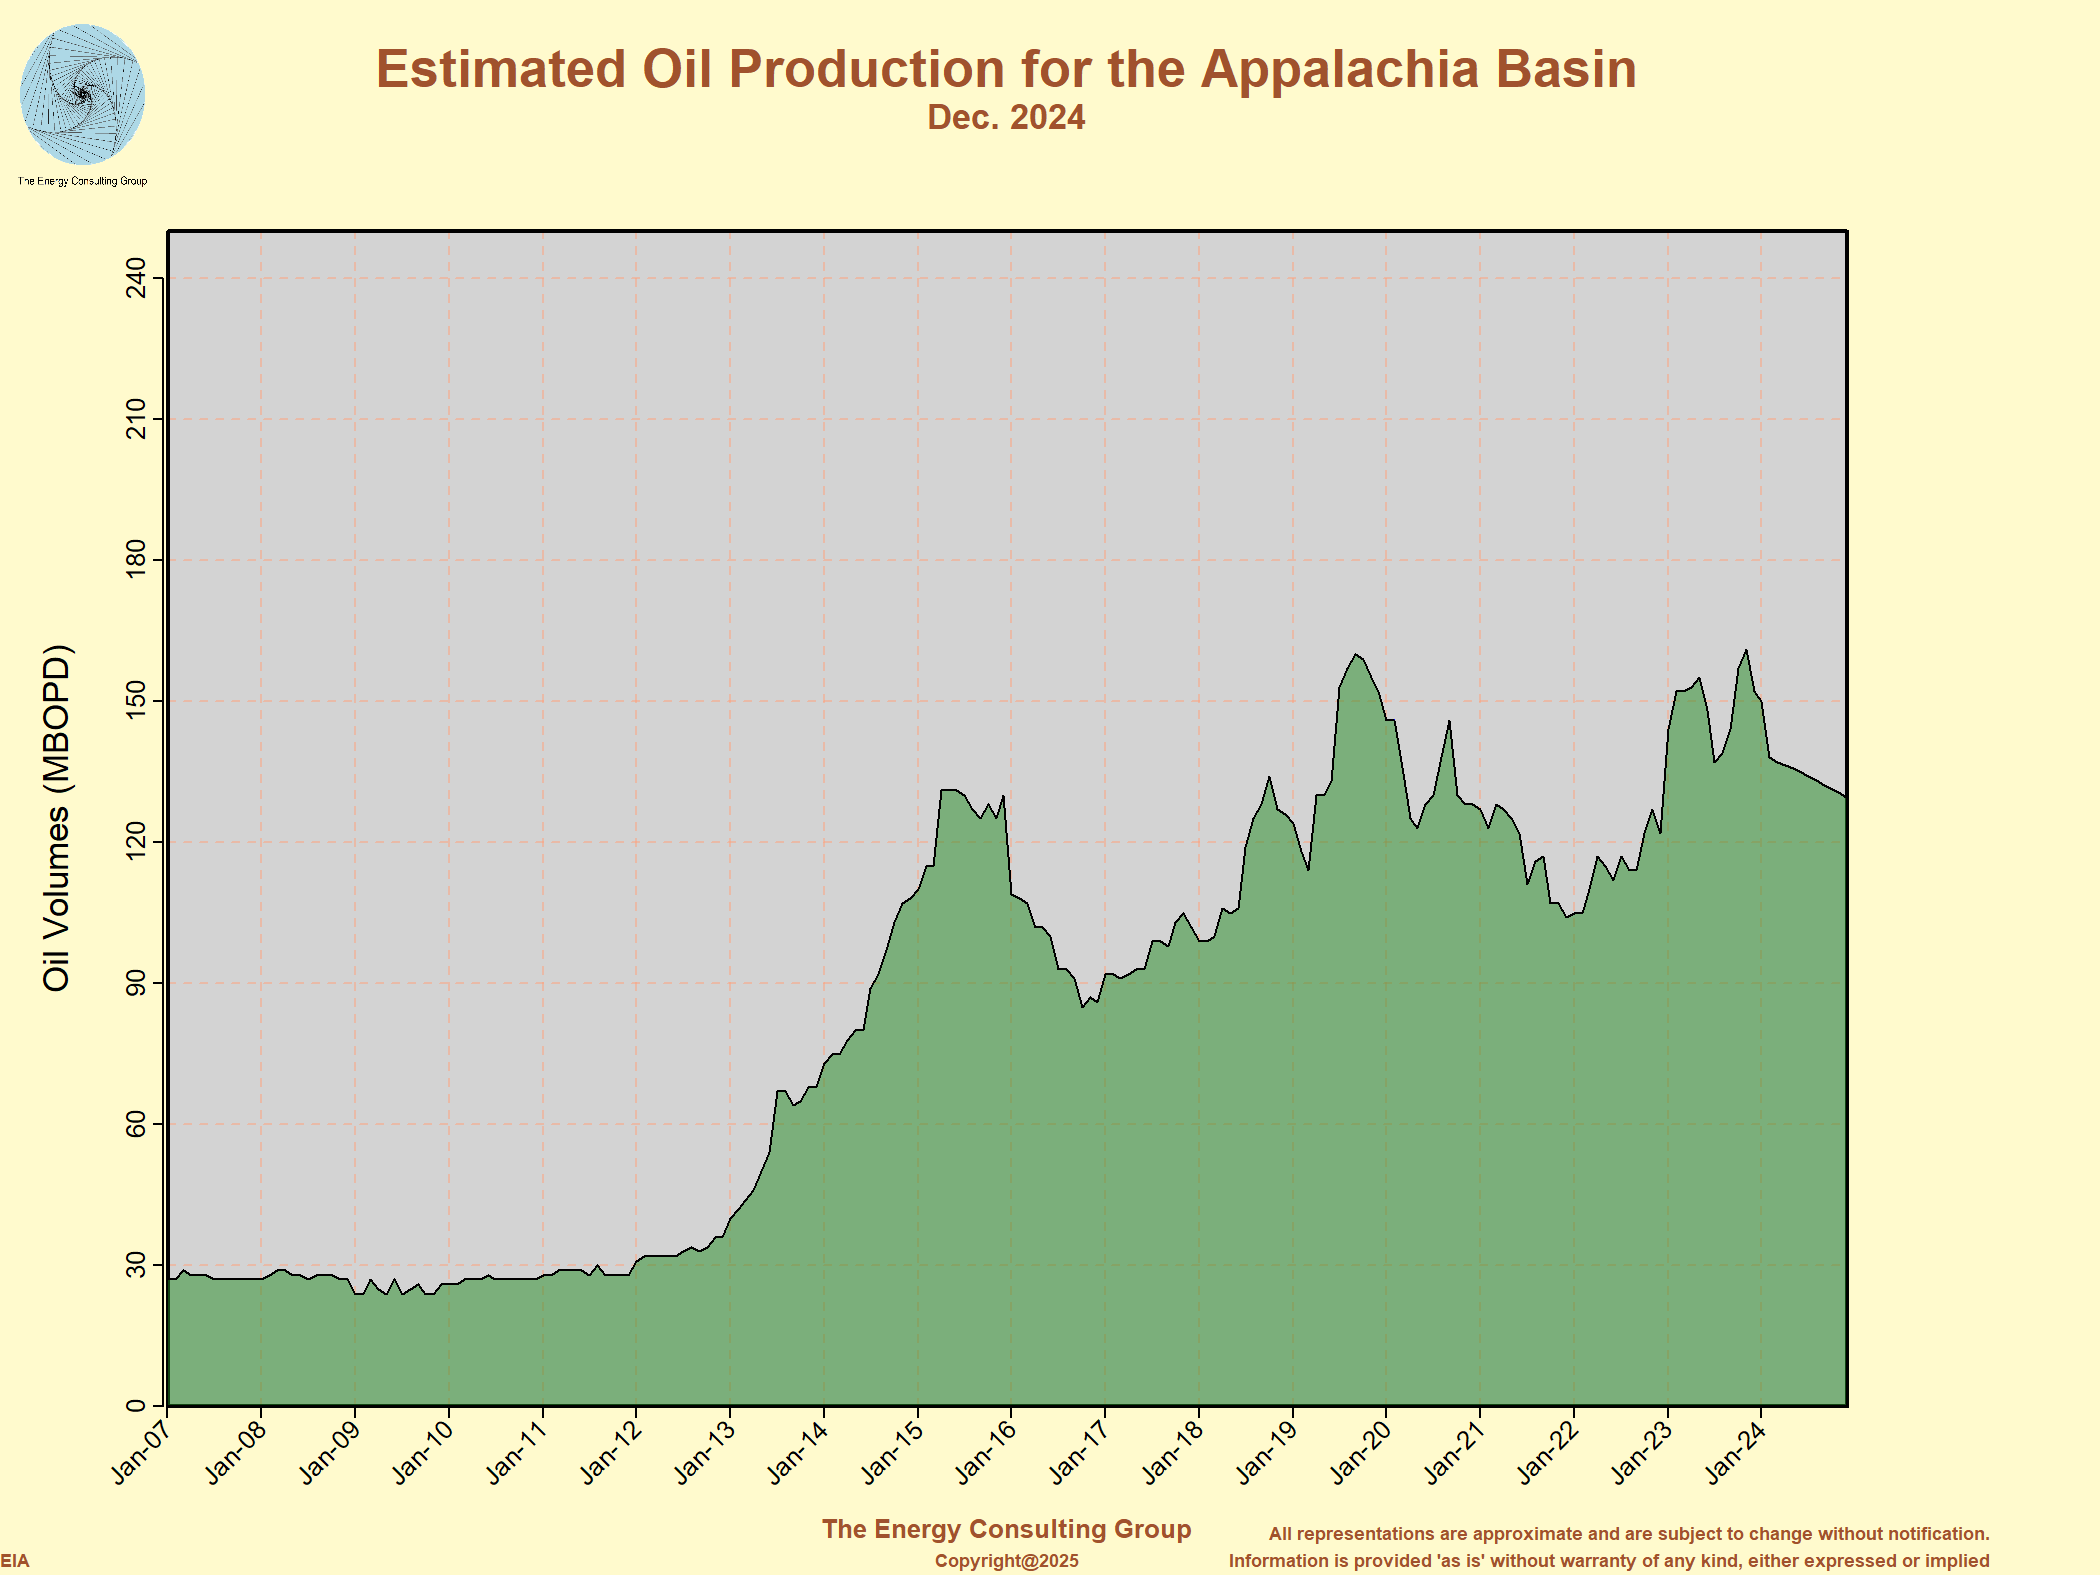
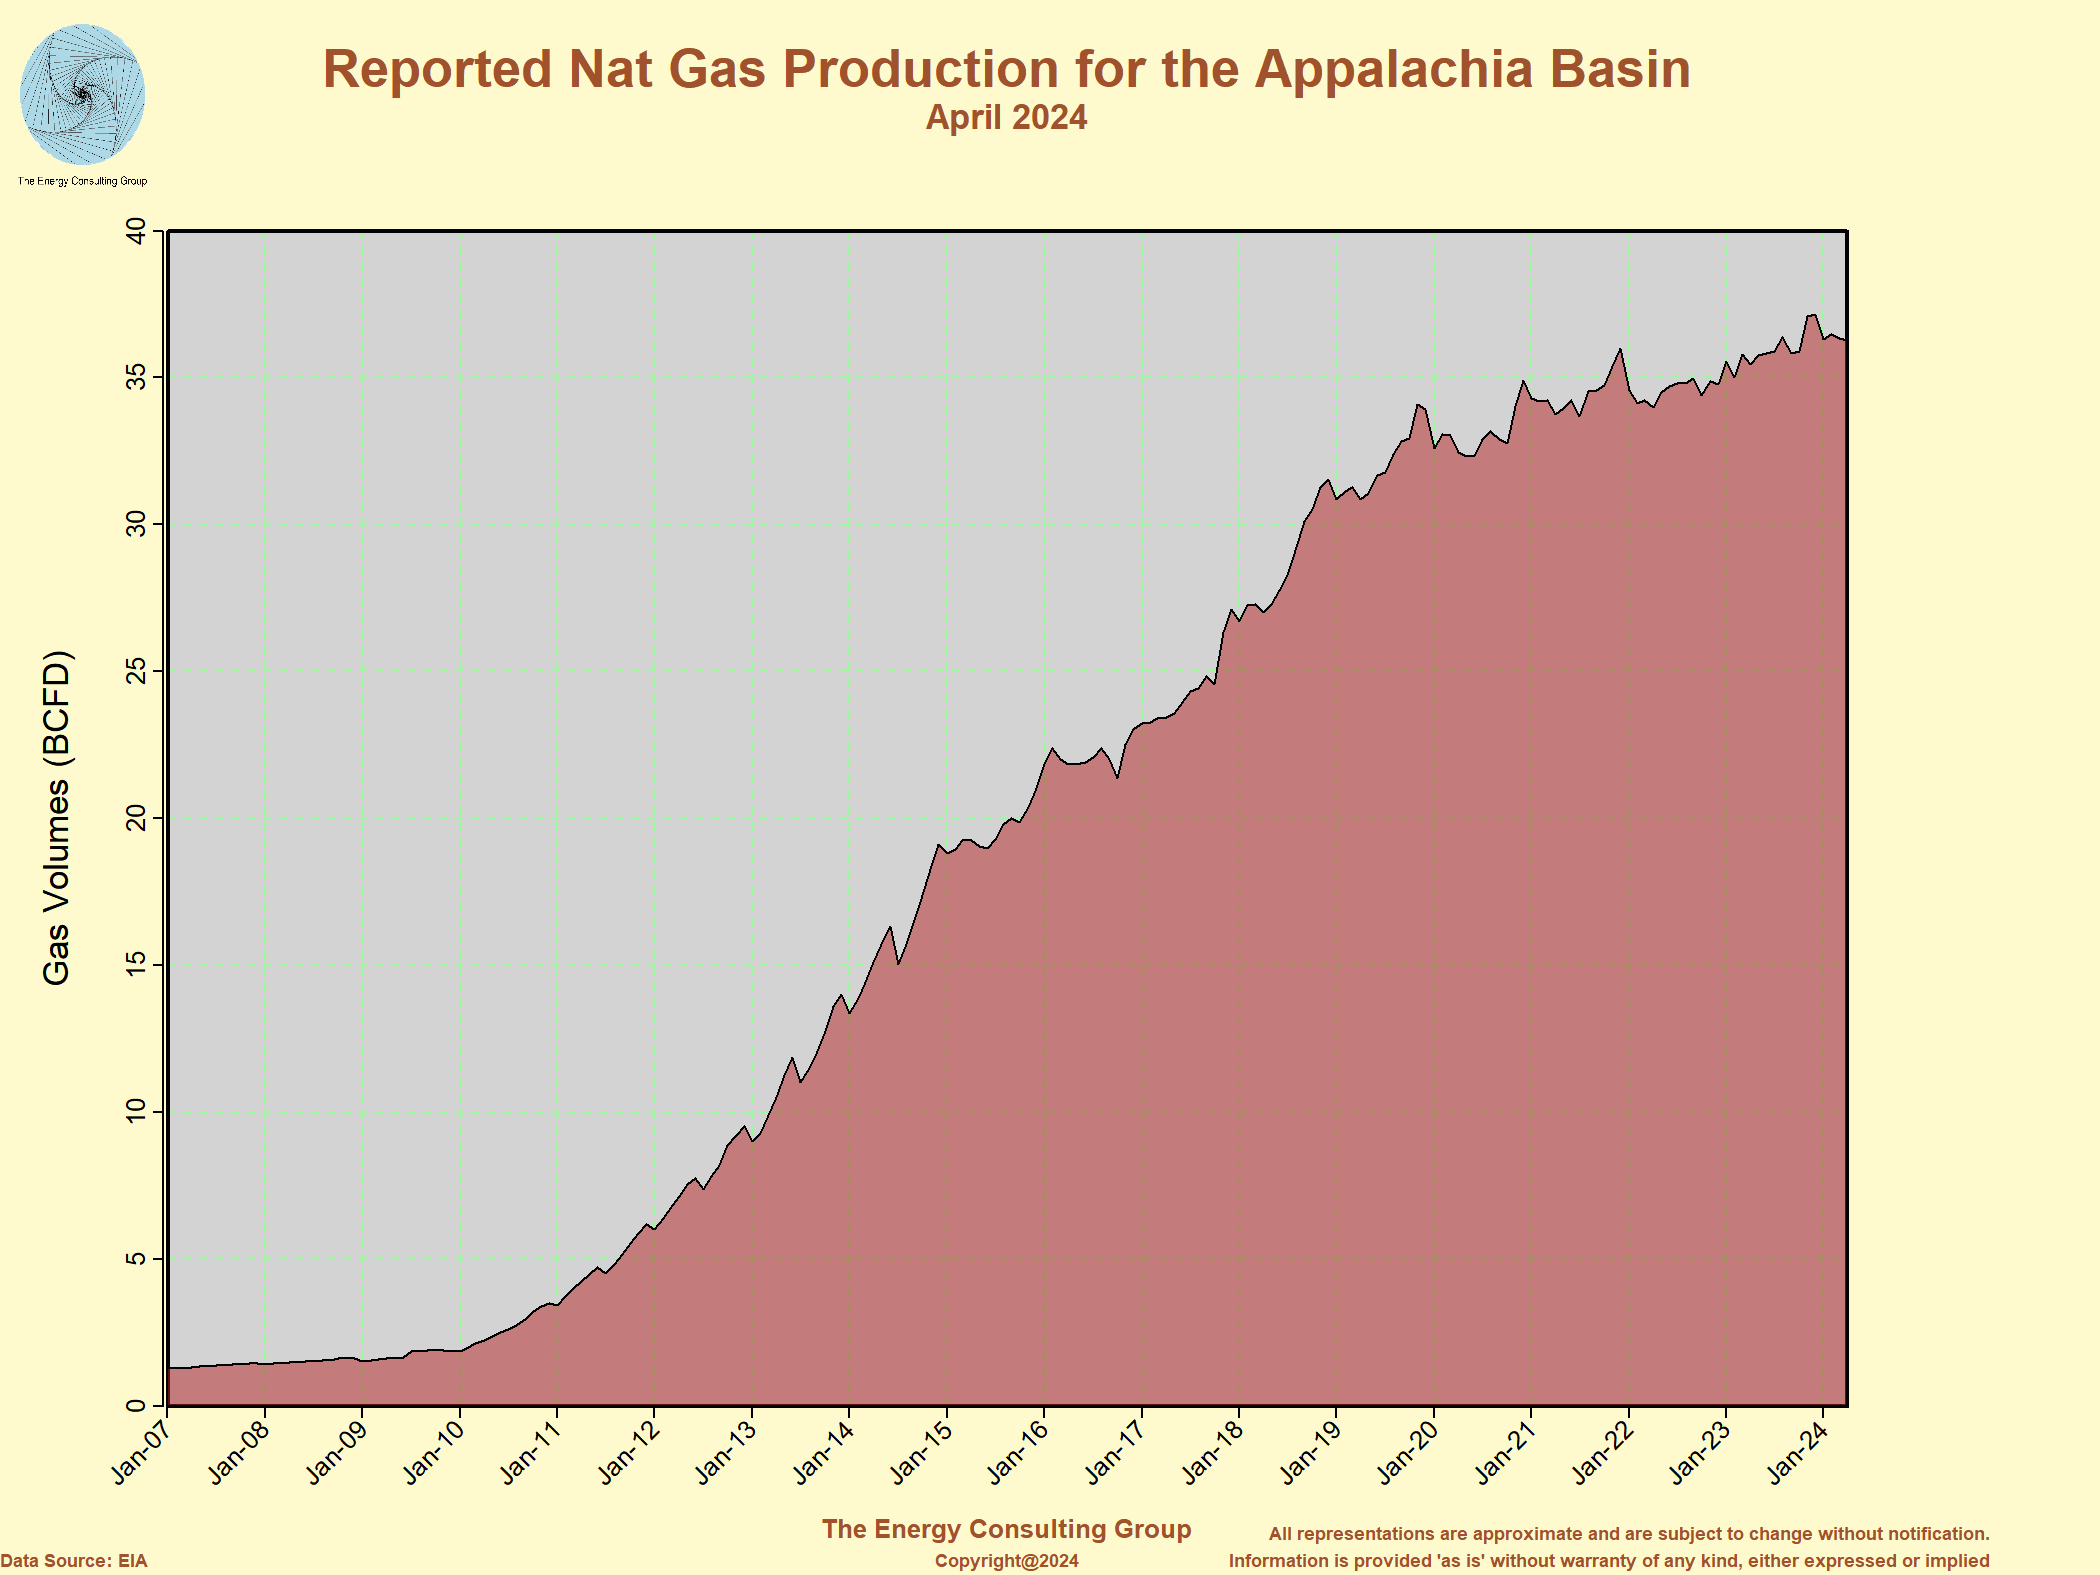
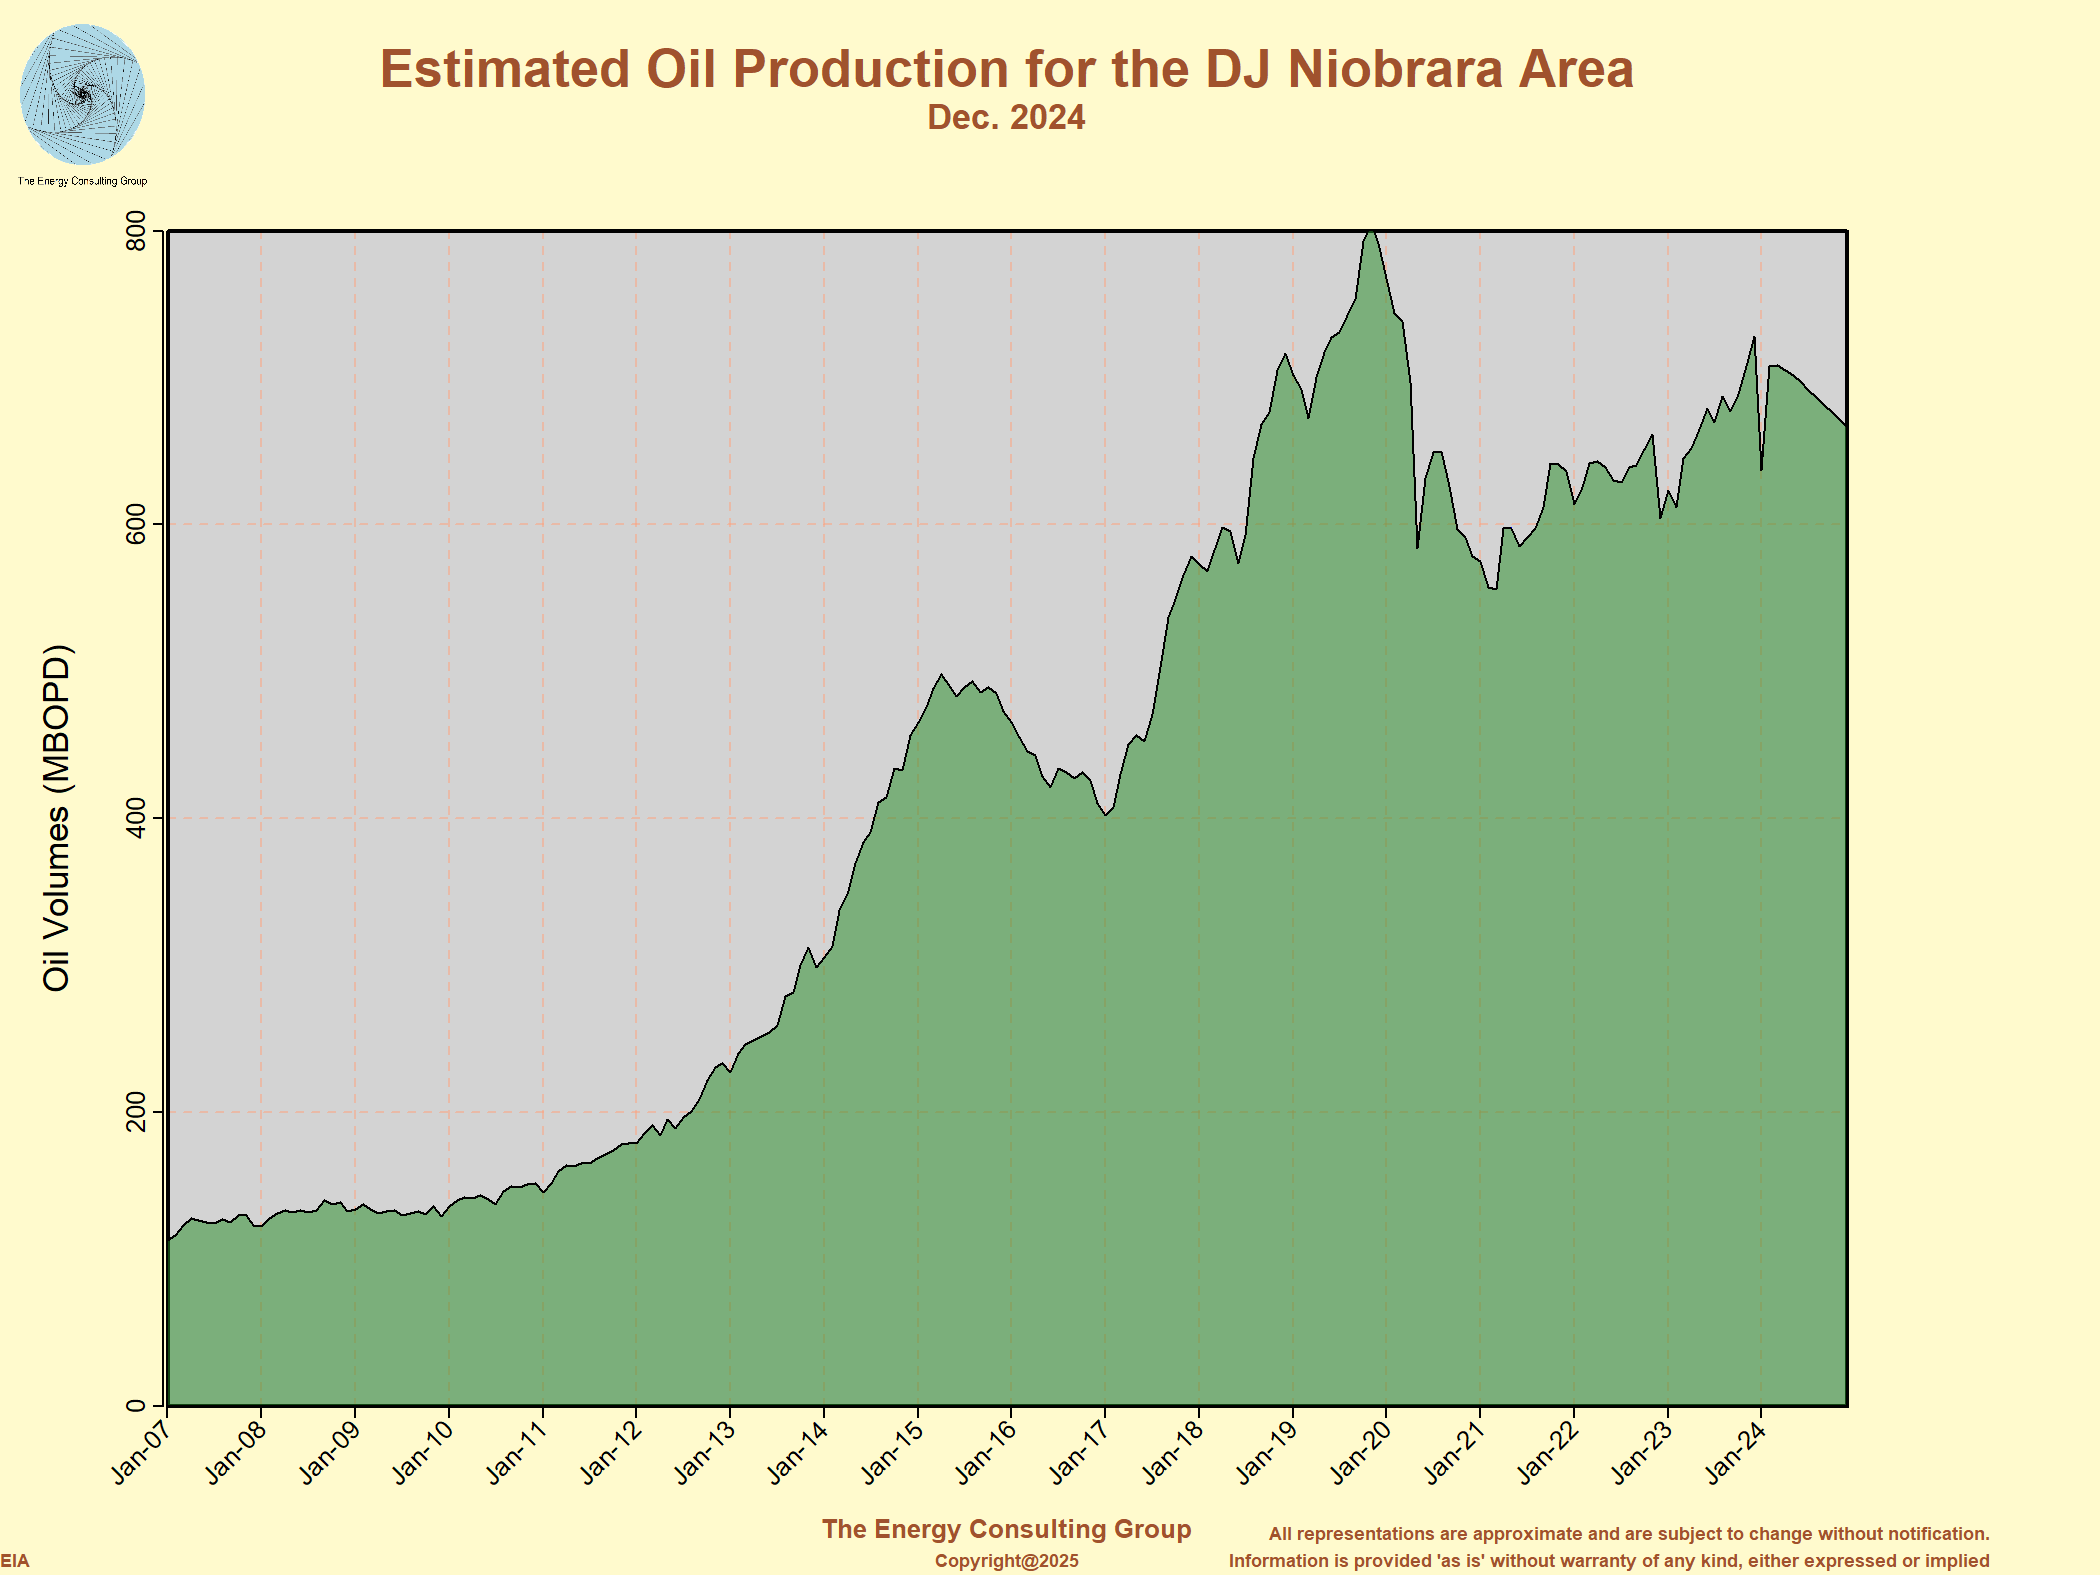
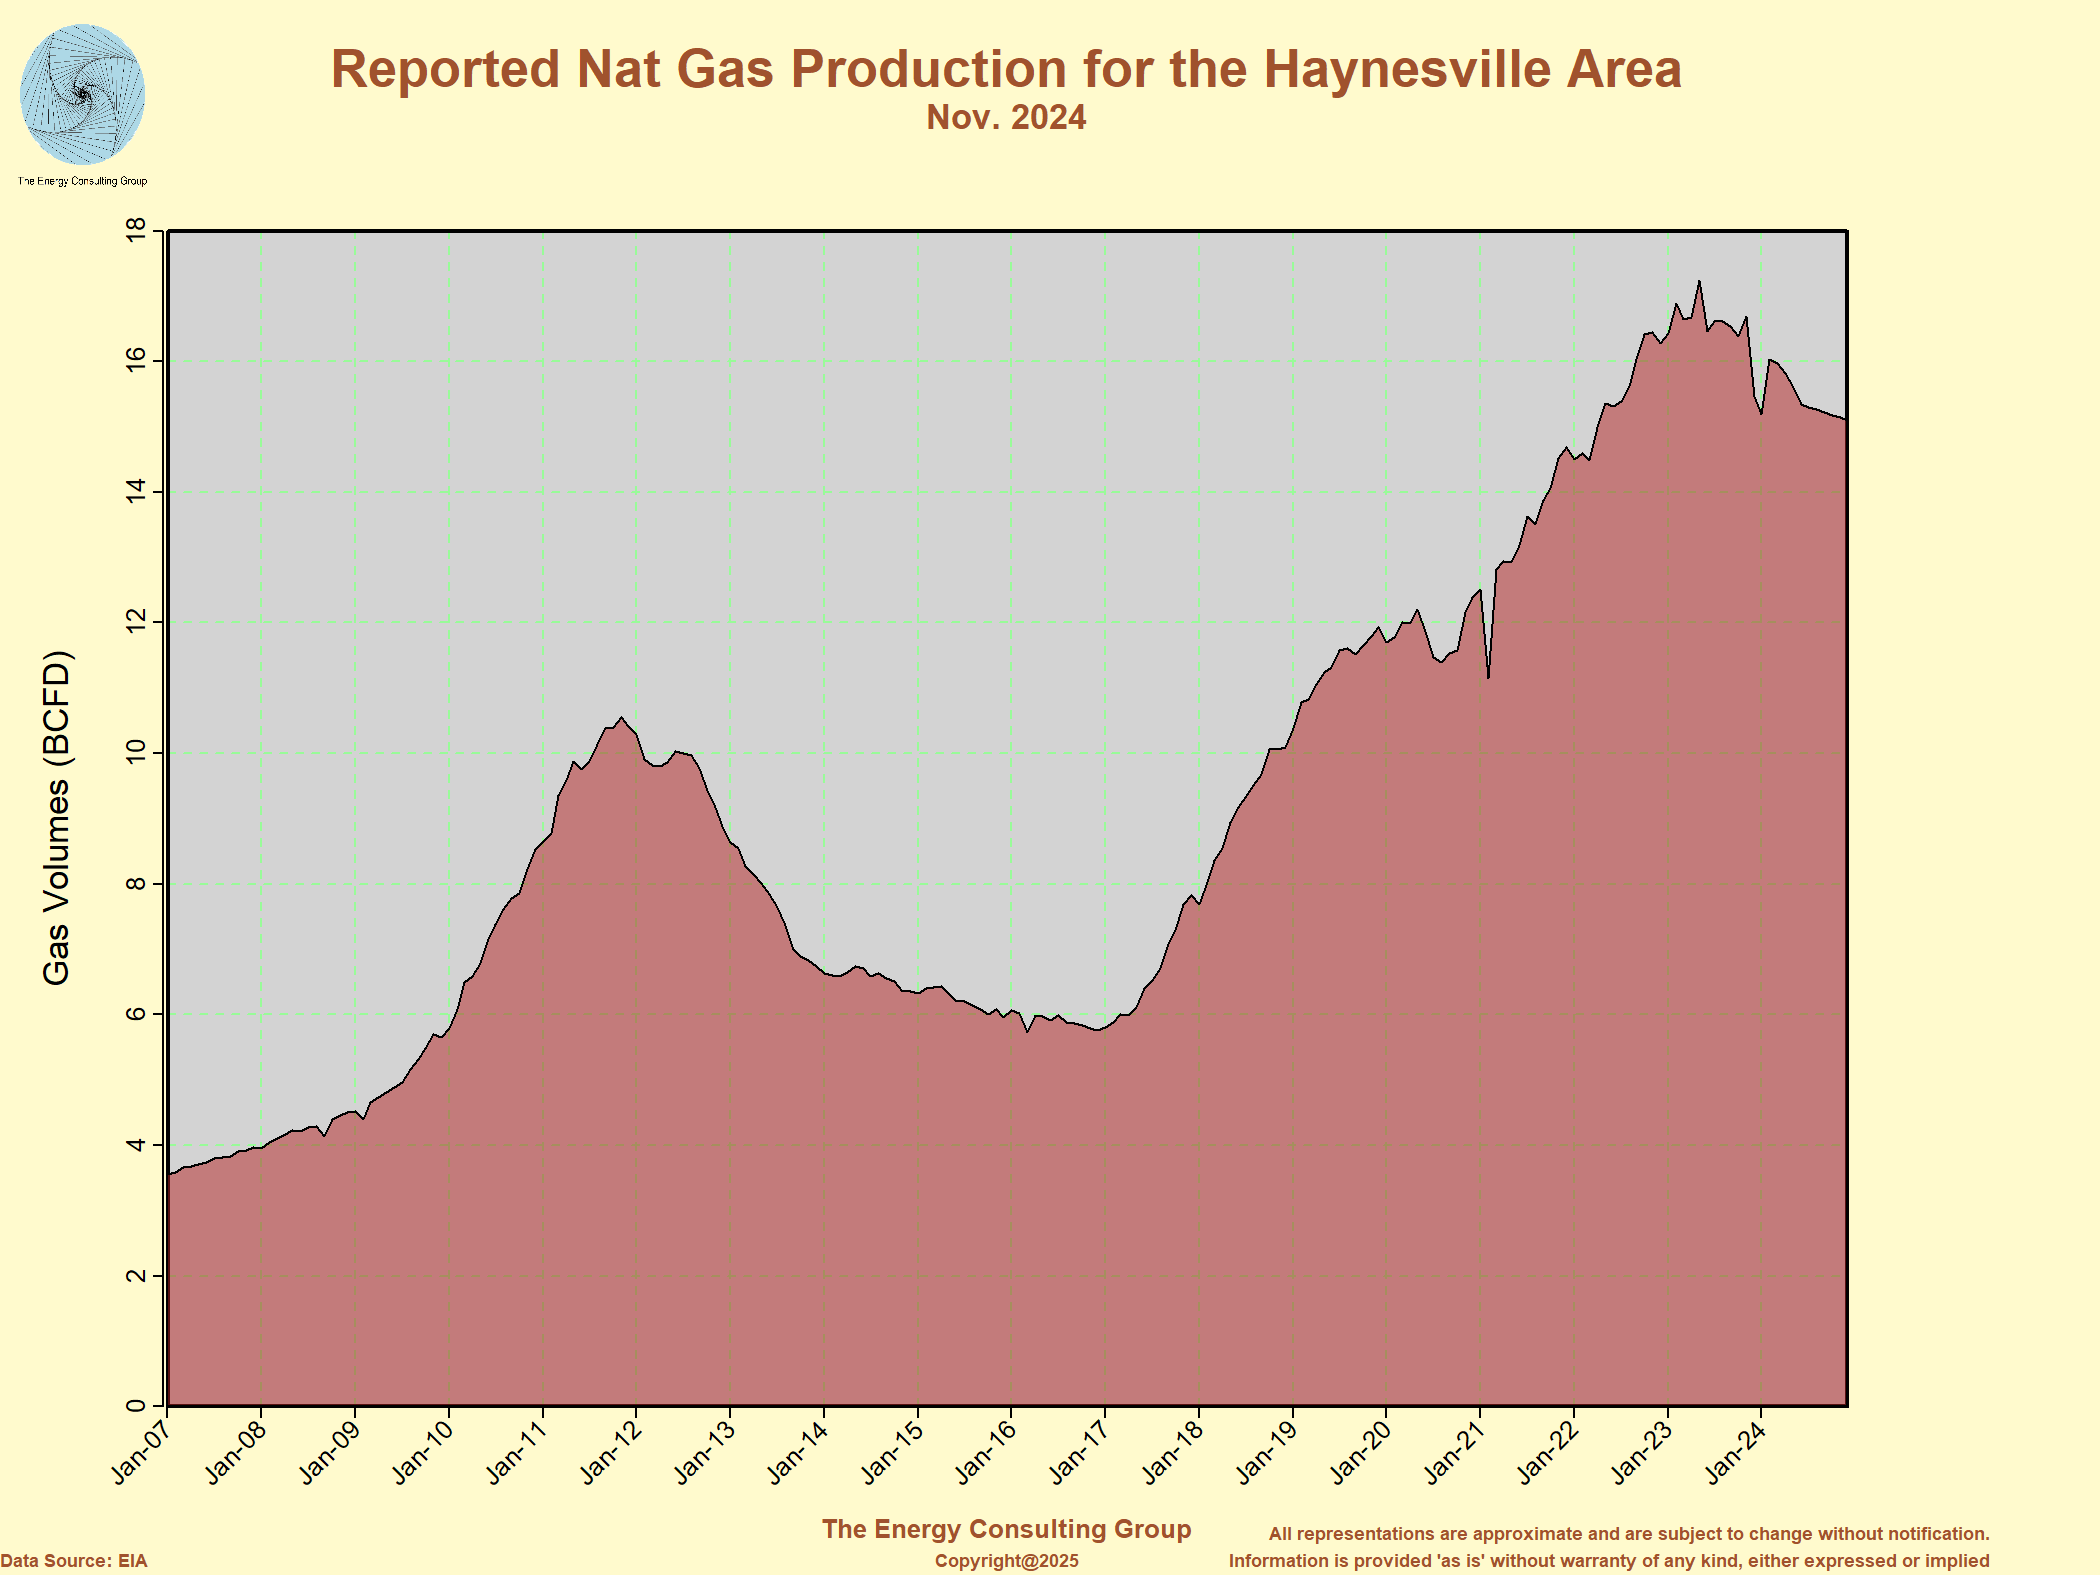
Permian-oilLinks to specific shale area oil and gas production graphs Permian-gas Bakken-oil Bakken-gas EagleFord-oil Eagleford-gas Anadarko-oil Anadarko-gas Appalachia-oil Appalachia-gas DJ_PowderRiver-oil Marcellus and Utica-gas Haynesville-gas |
February 2023
Permian DelawareLinks to area specific graphs and charts showing current and past oil and gas directed drilling rig counts and trends Eddy County, NM Lea County, NM TX part of Del. Permian Midland Bakken EagleFord Marcellus/Utica (STACK/SCOOP) Haynesville Rocky Mountains Powder Riv/DJ Offshore USA onshore oil USA onshore gas USA Hori+Vert_Rigs |
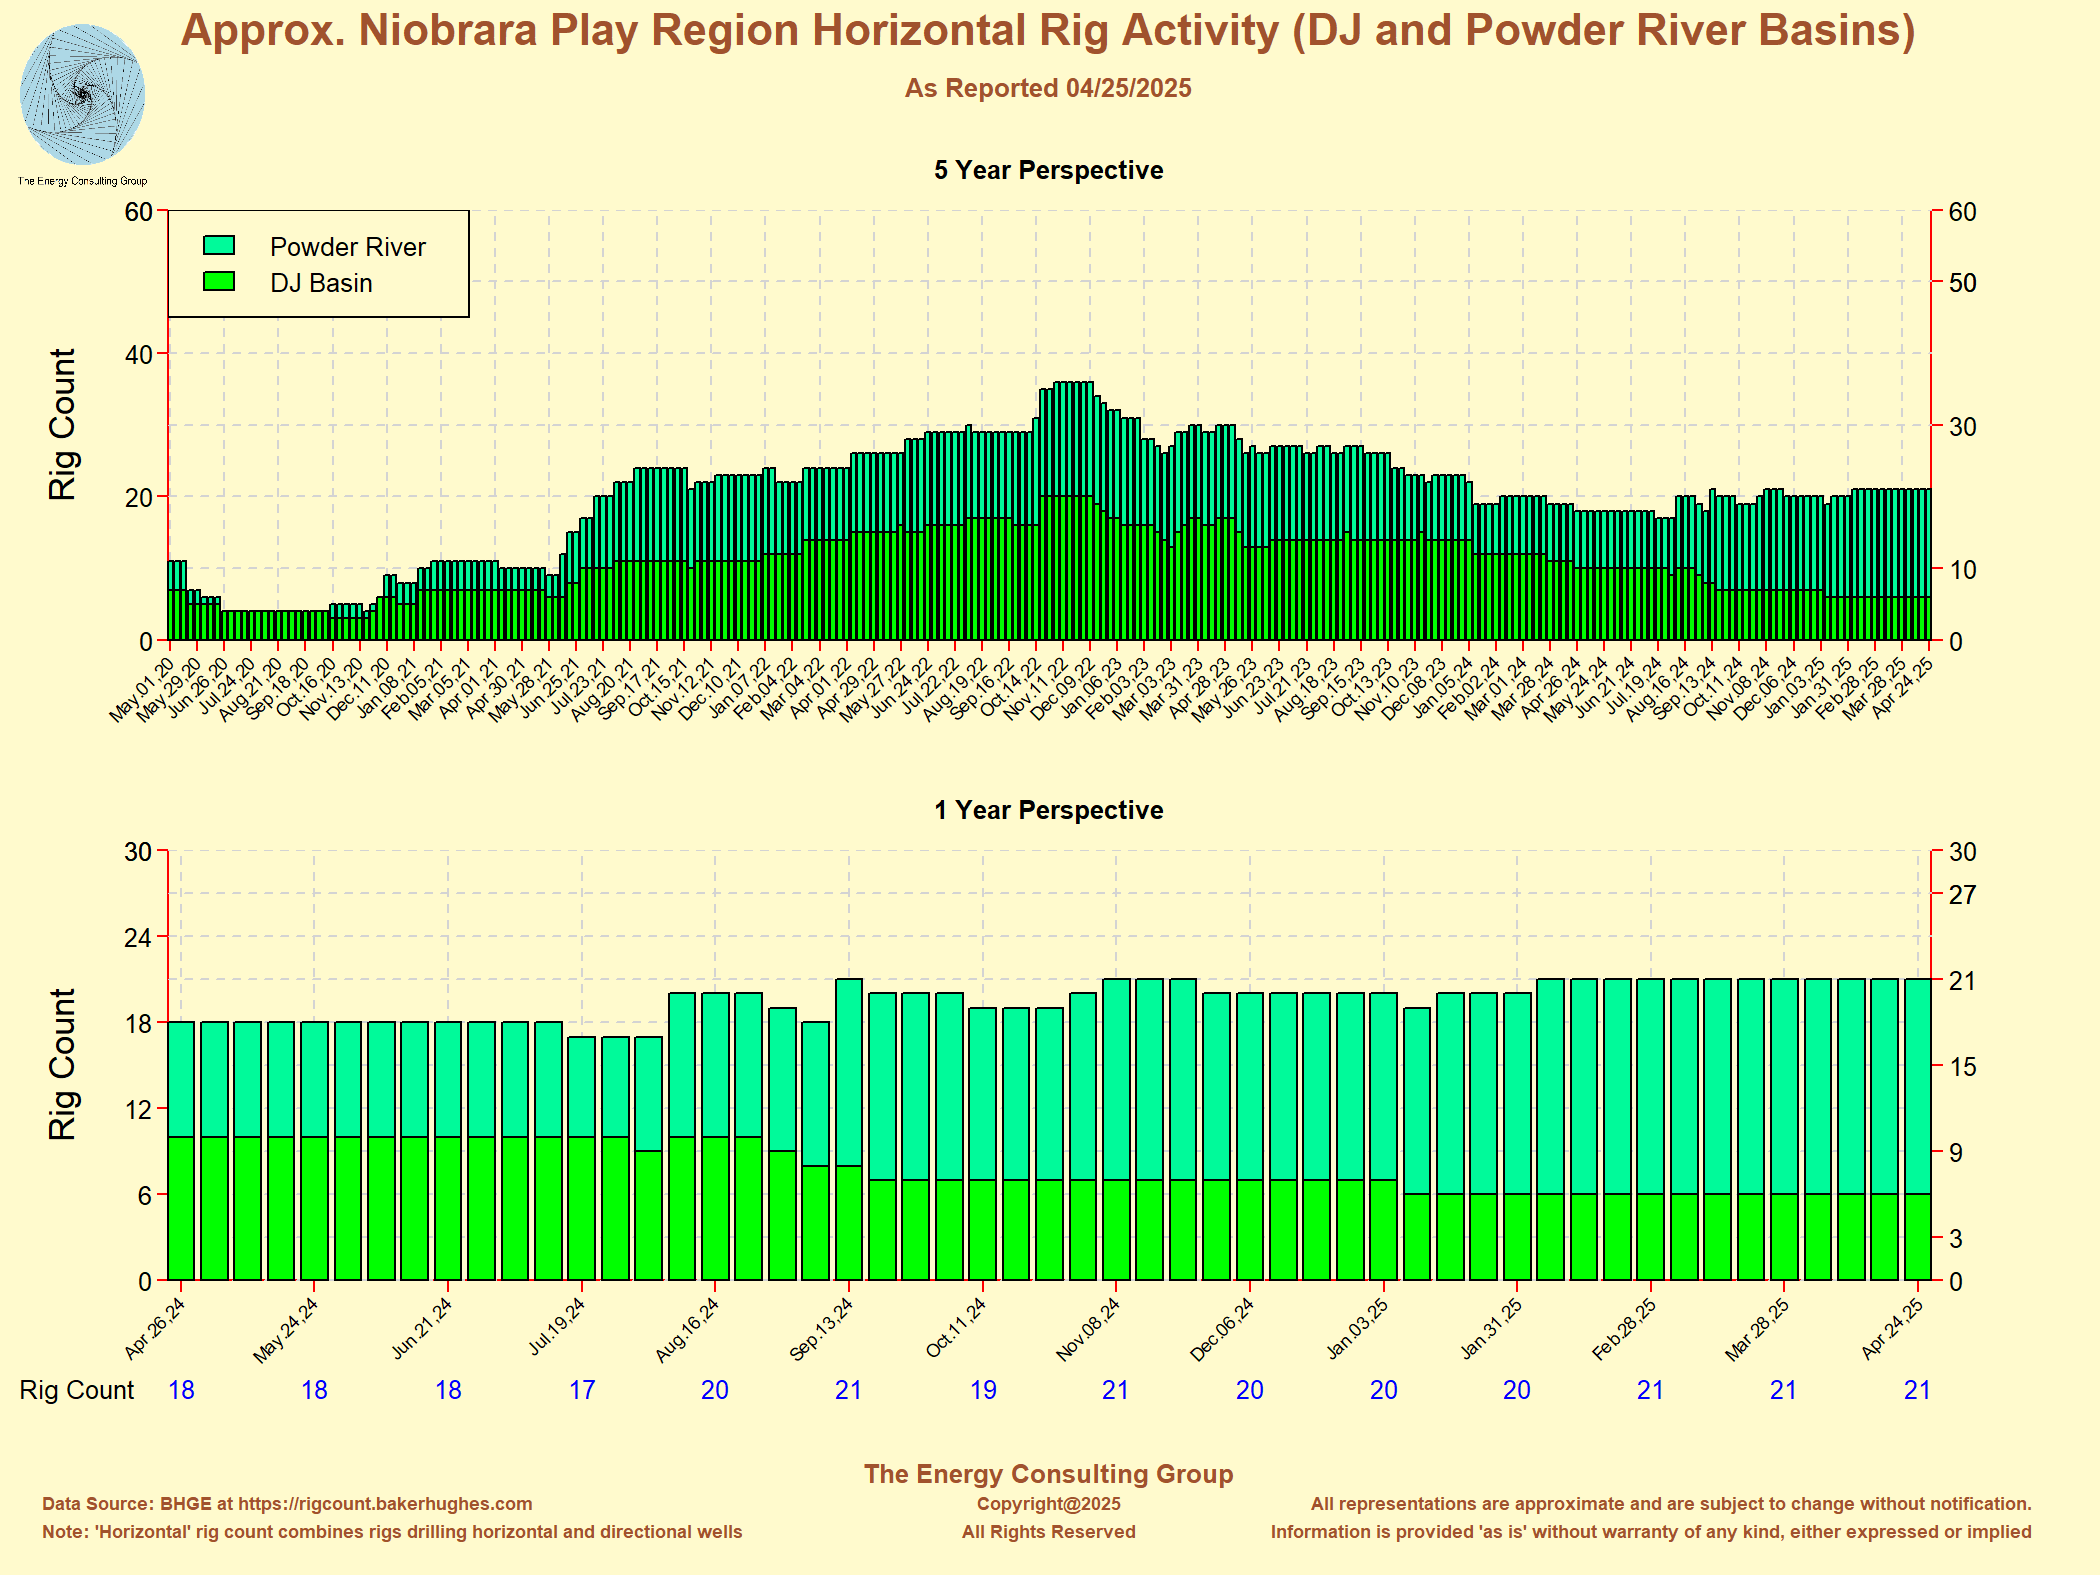
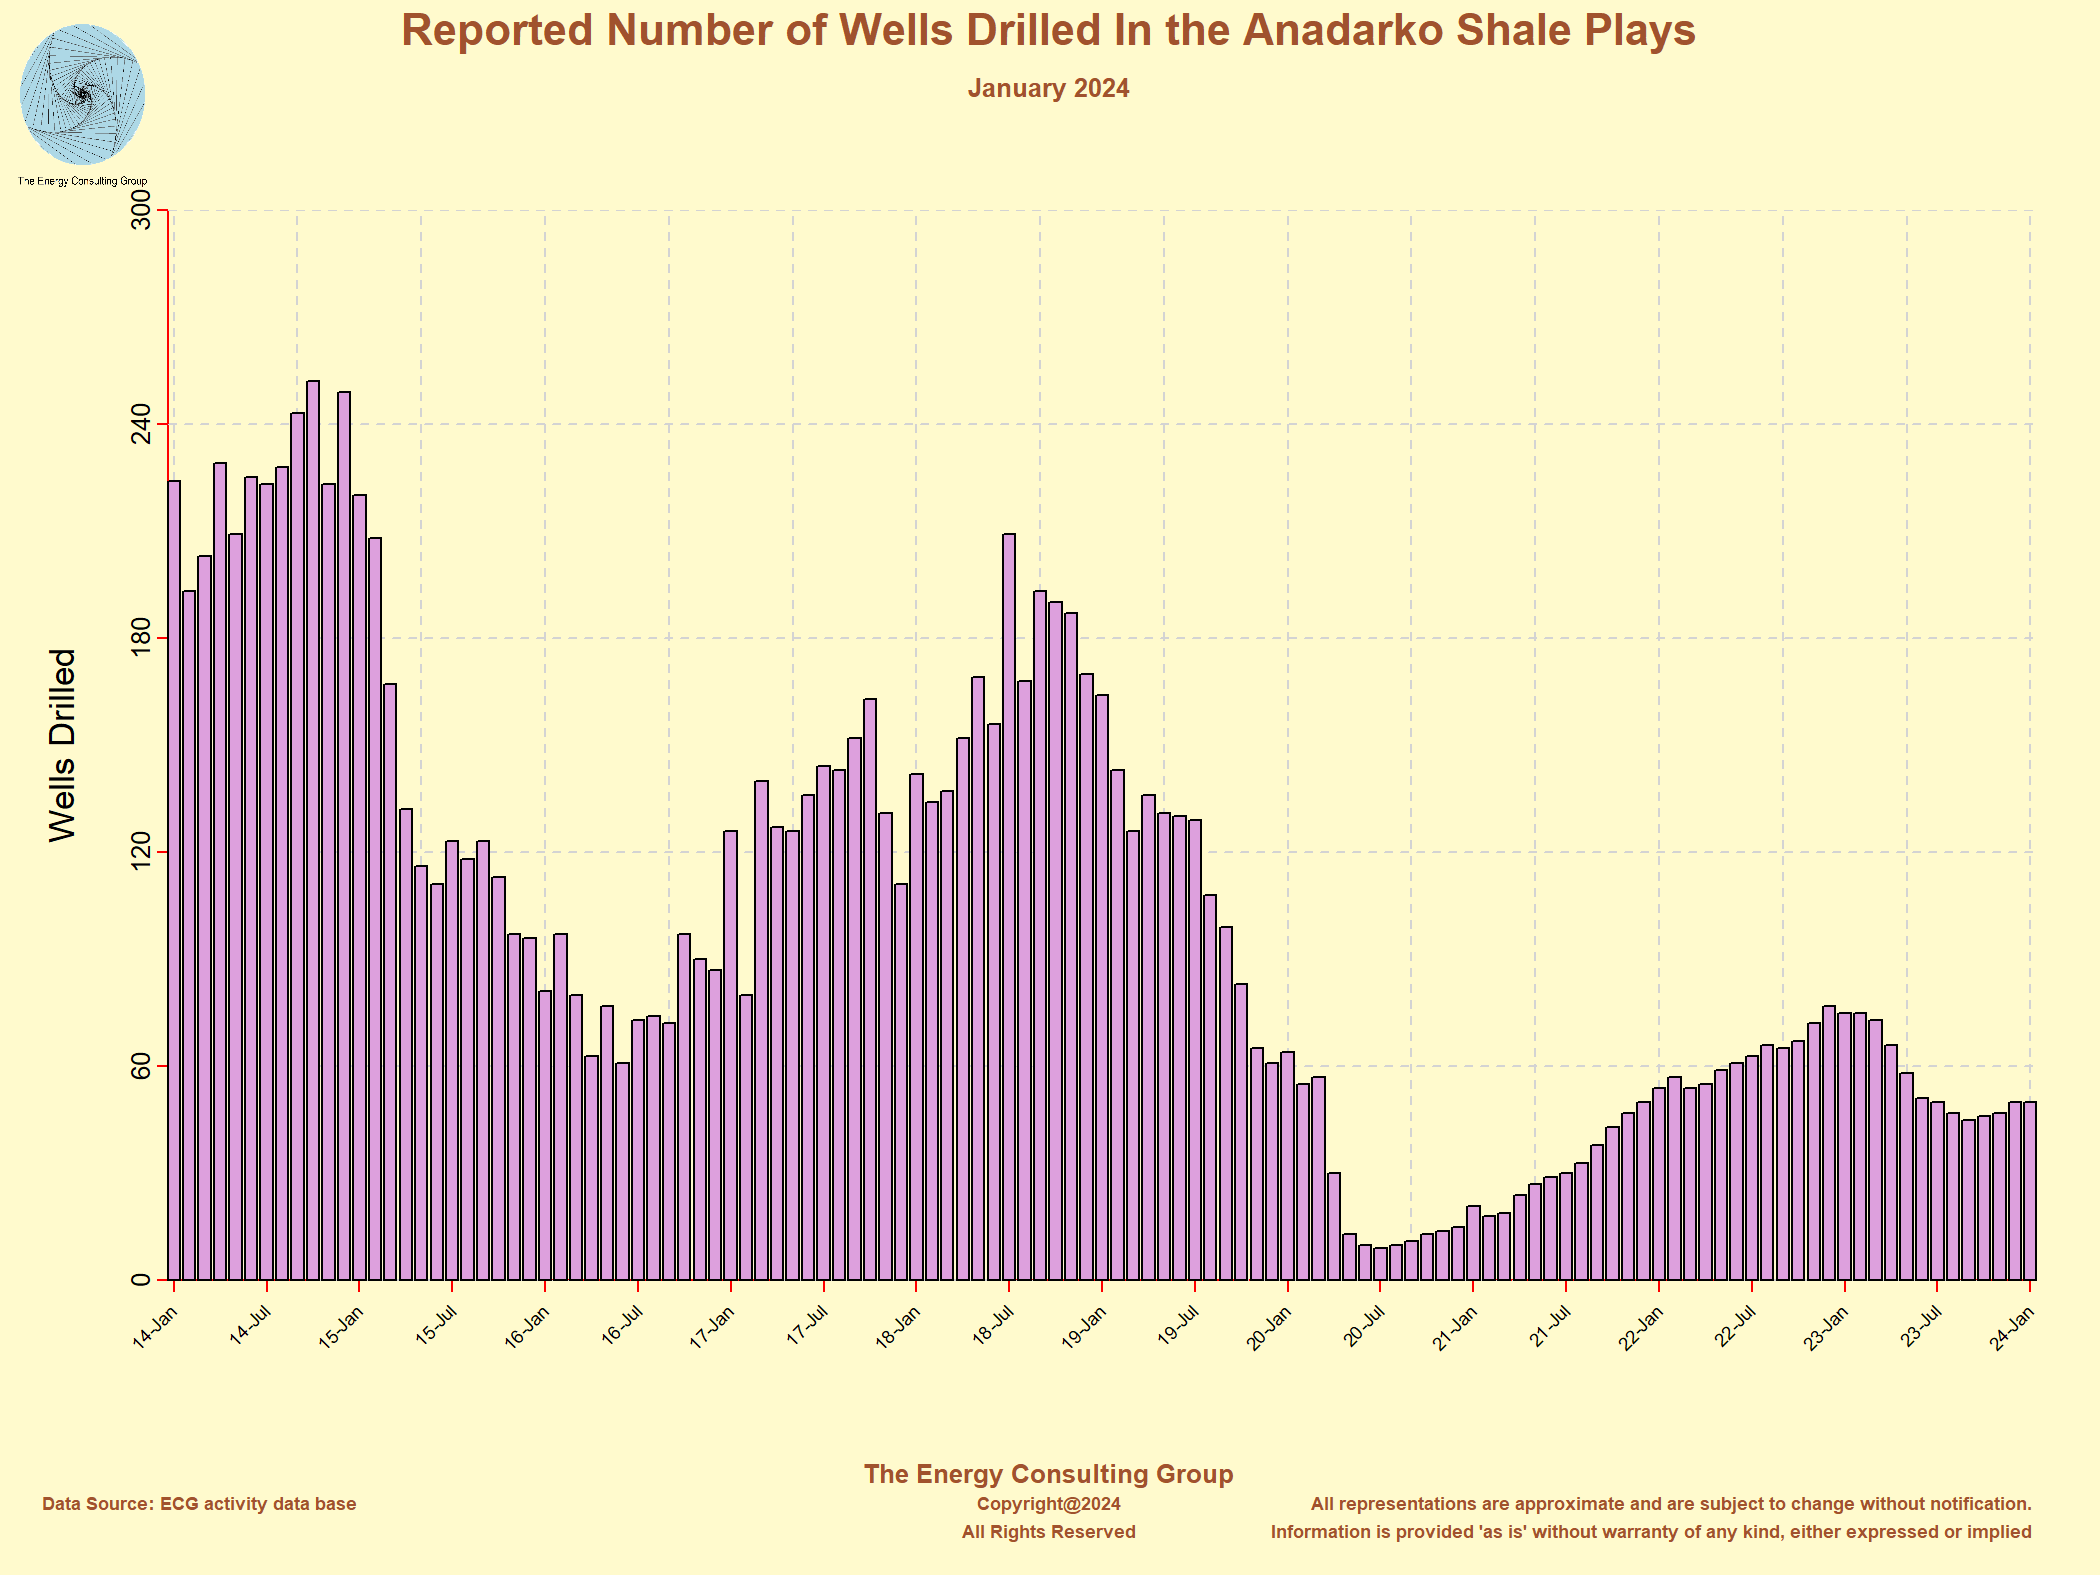
February 2023 Links to area specific graphs and charts showing the monthly number of oil and gas wells drilled in each of those areas. Permian Bakken EagleFord Marcellus/Utica Anadarko Haynesville DJ Niobrara Total |
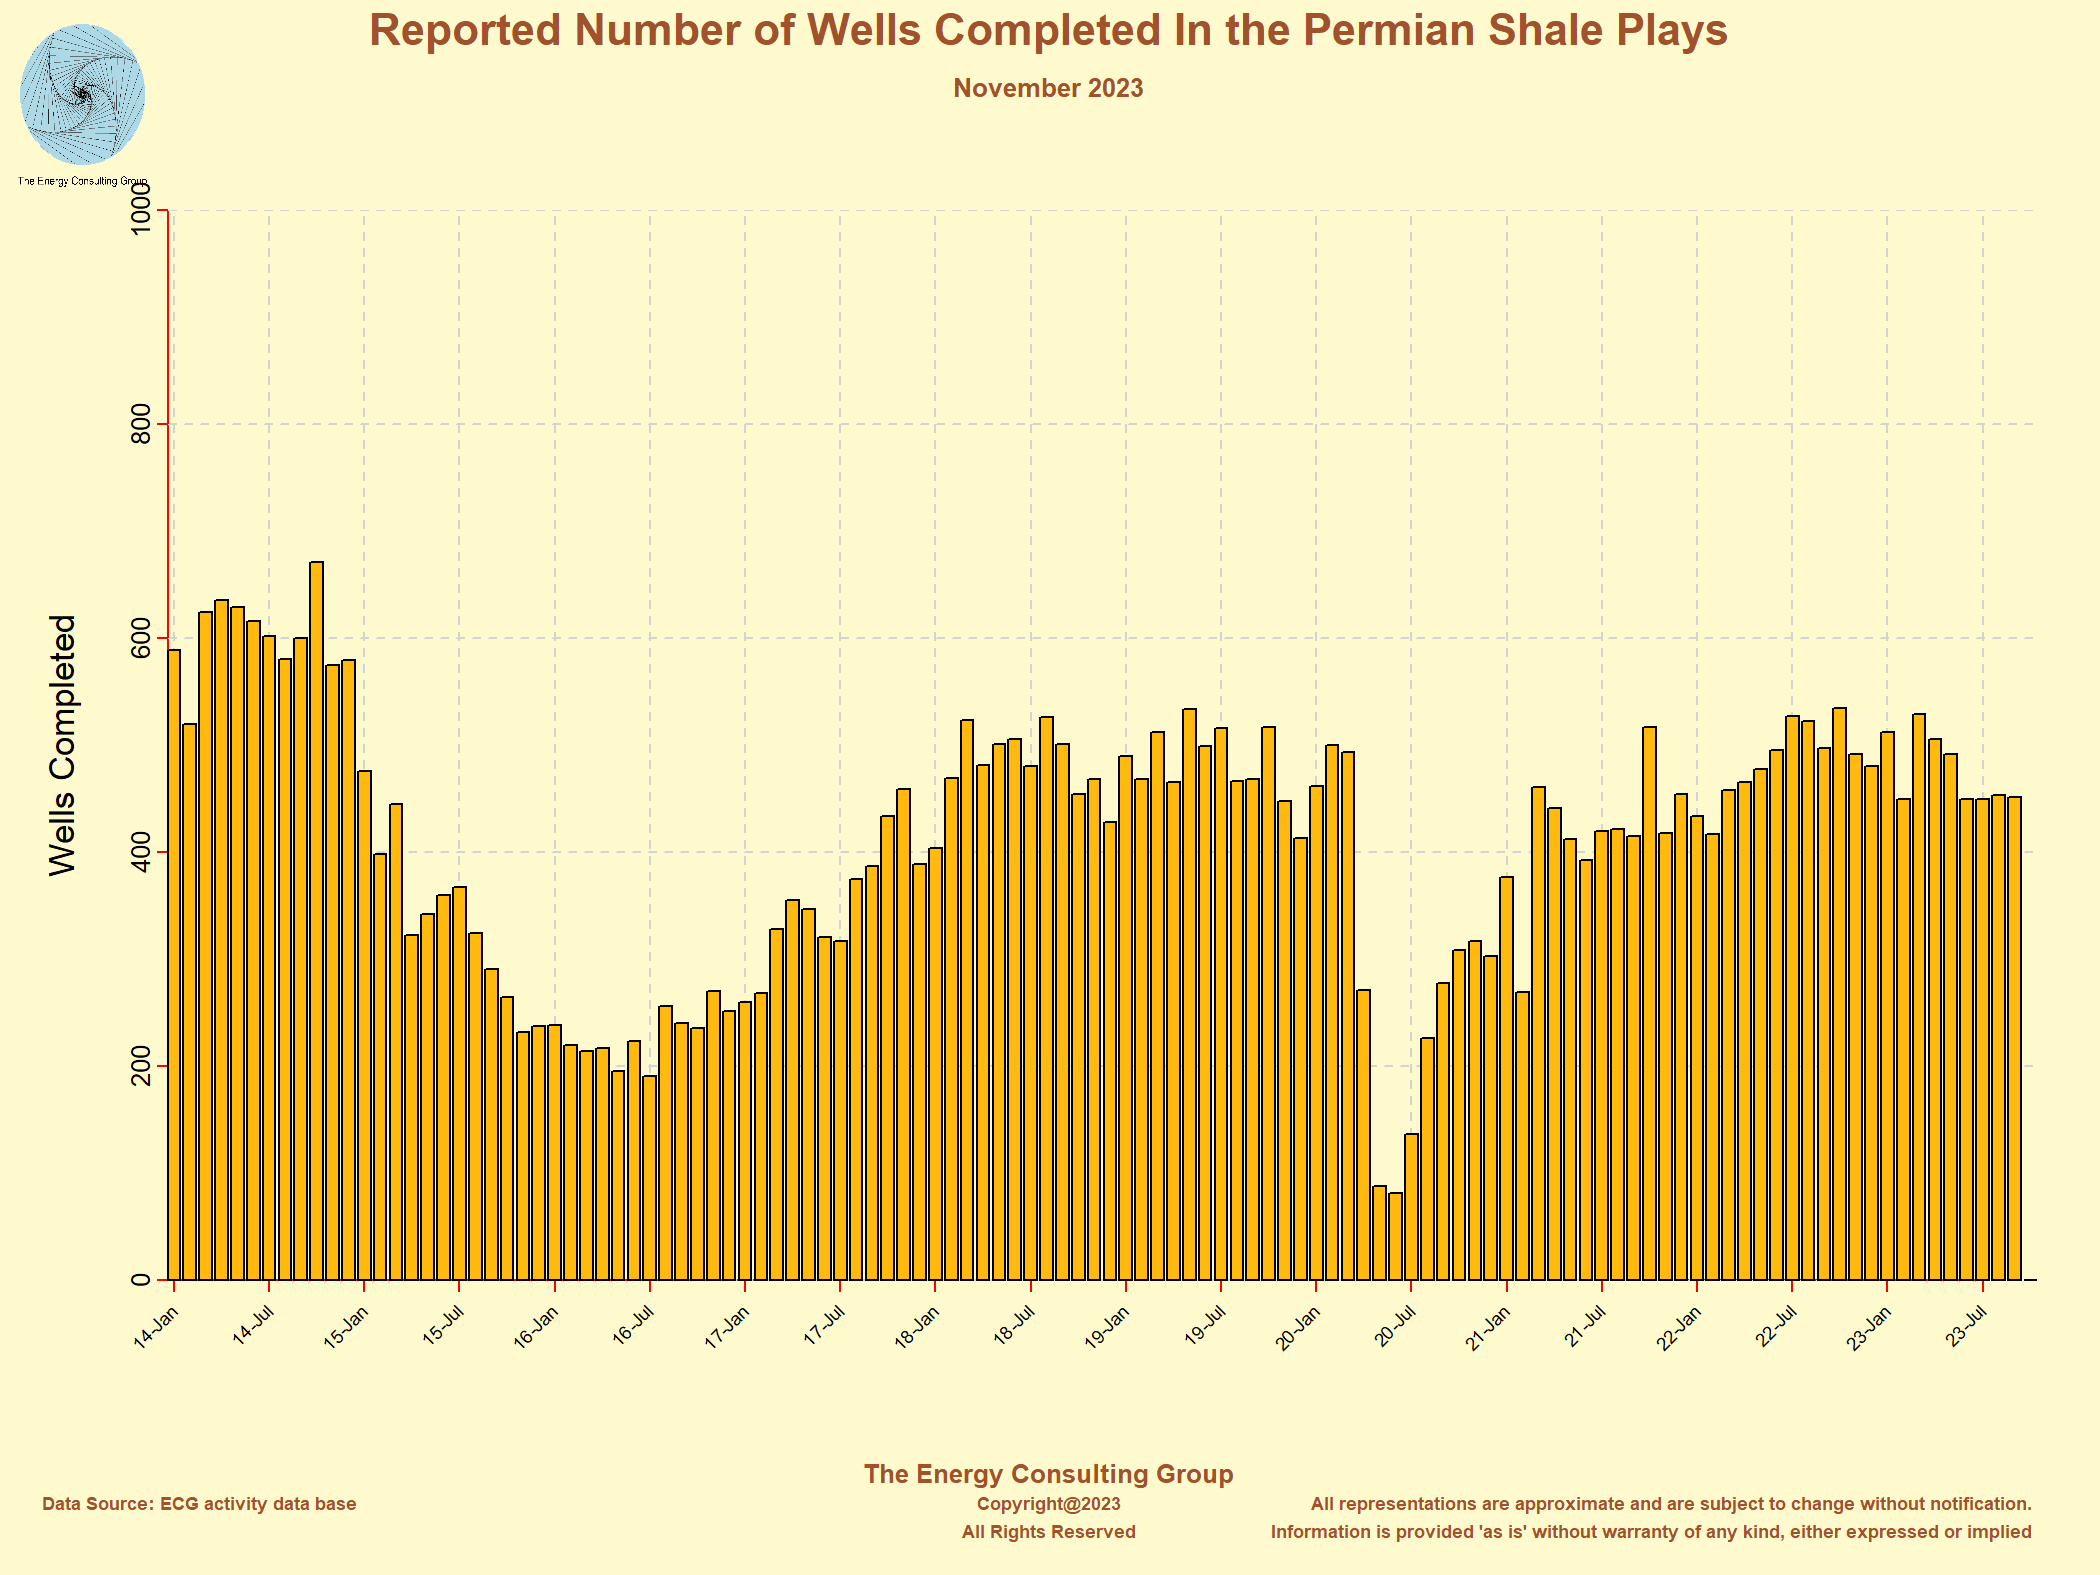
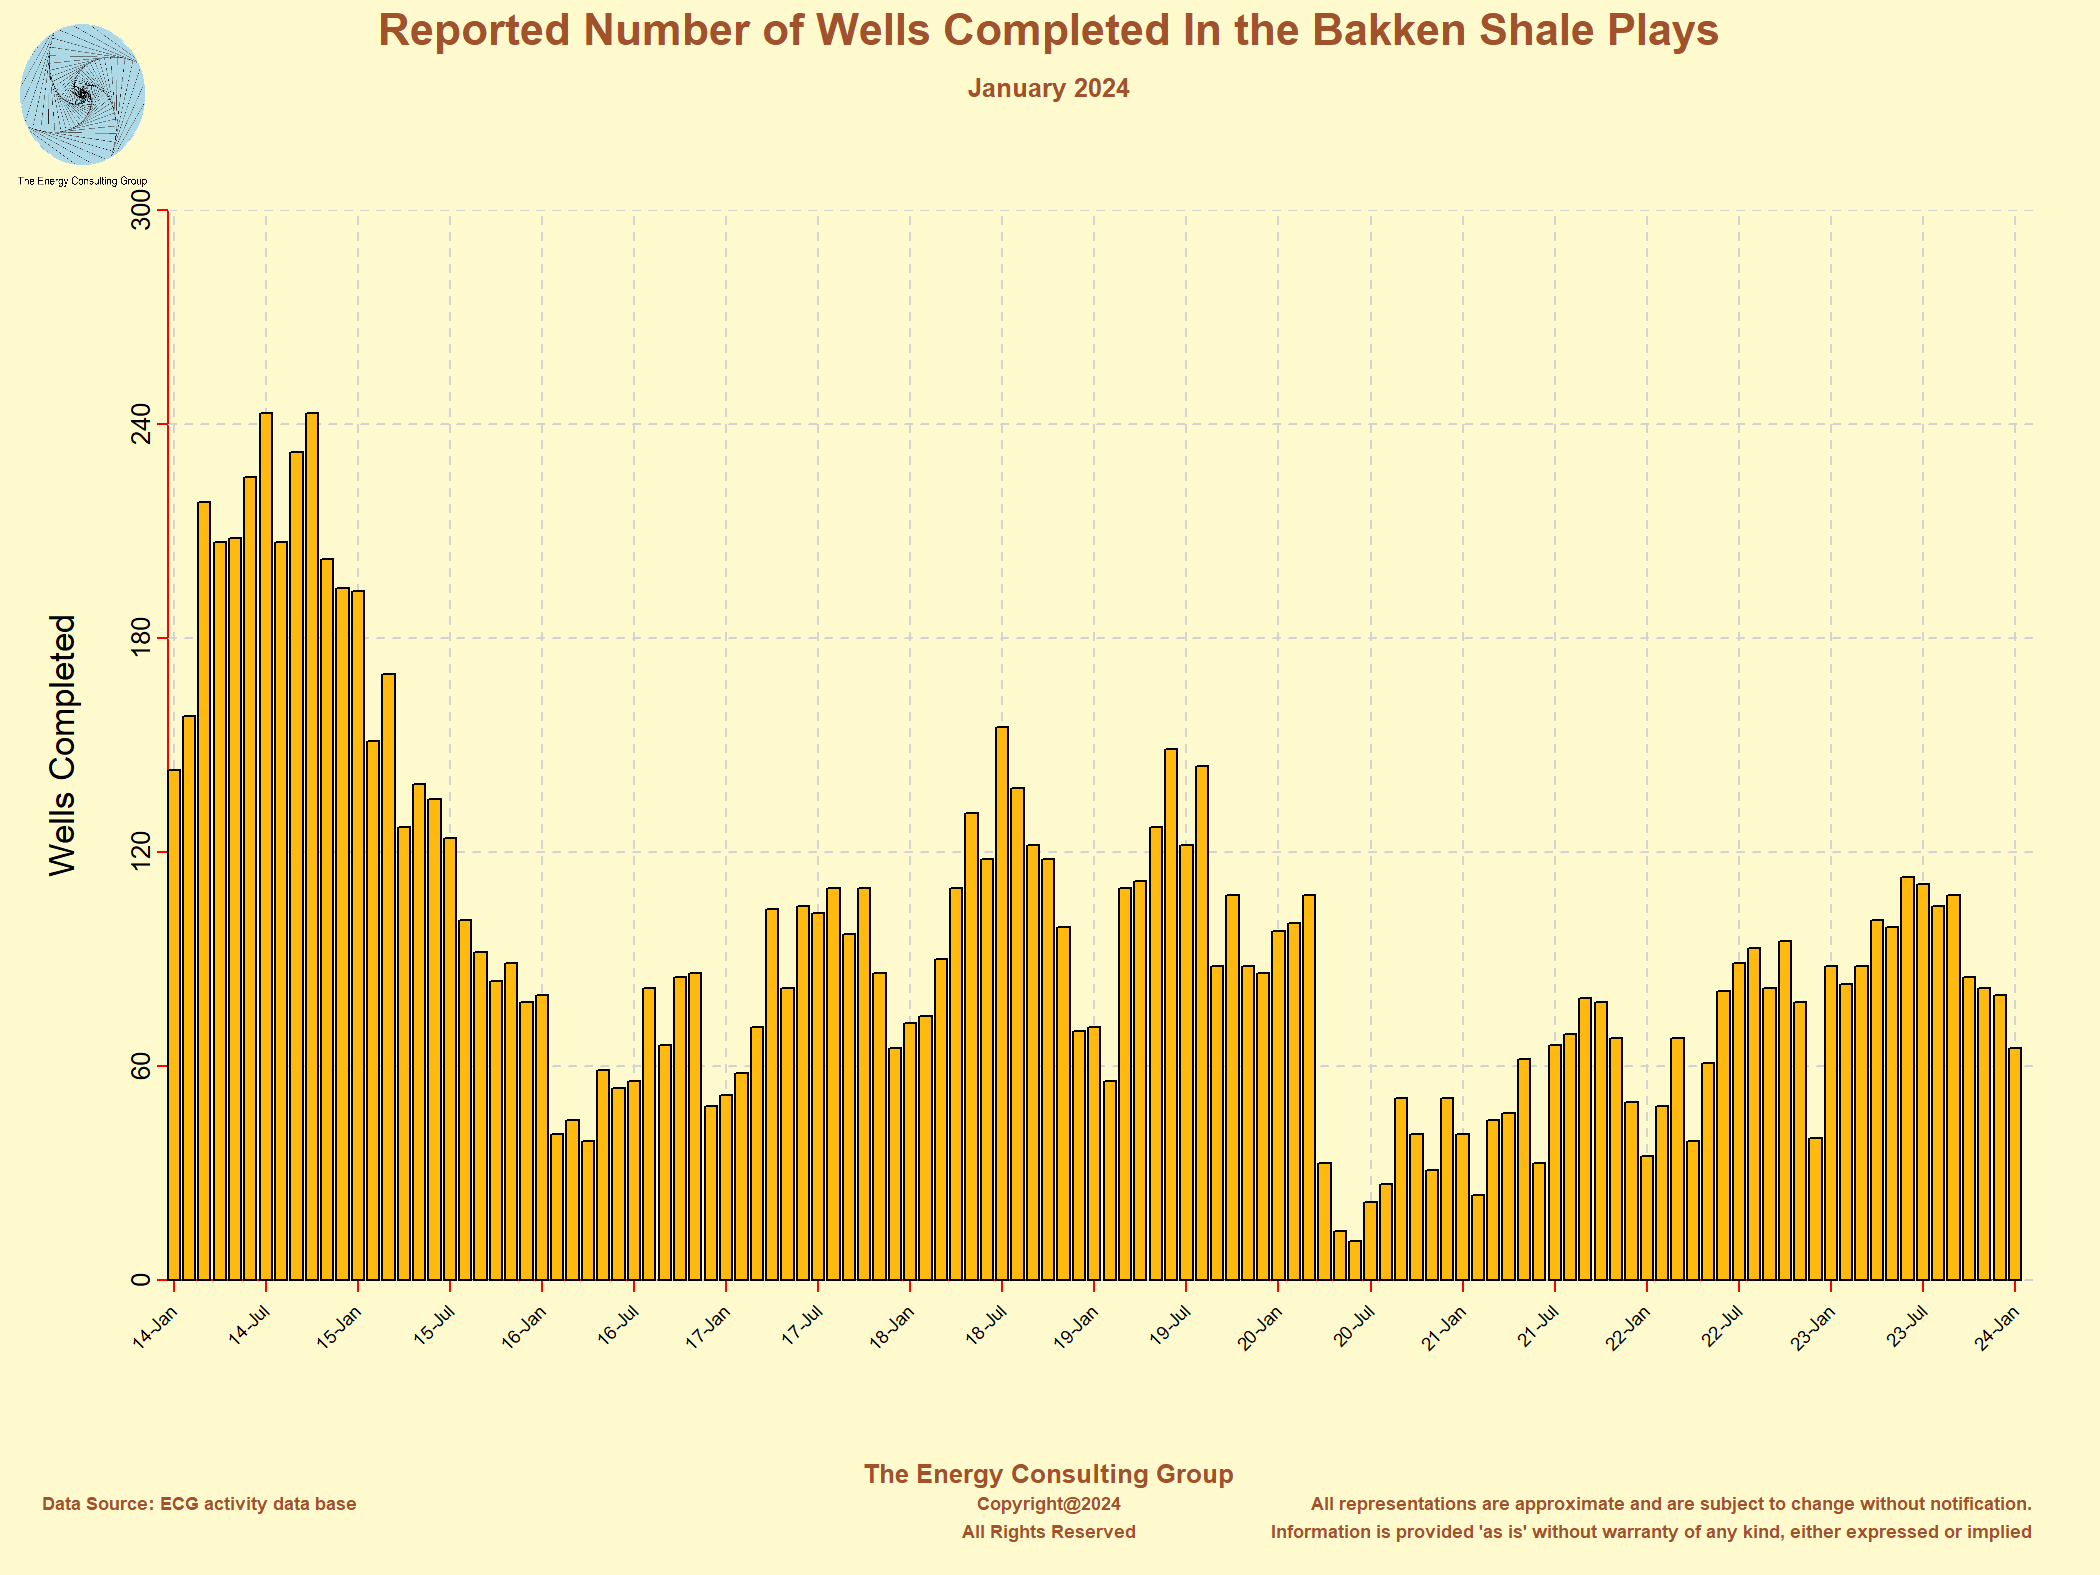
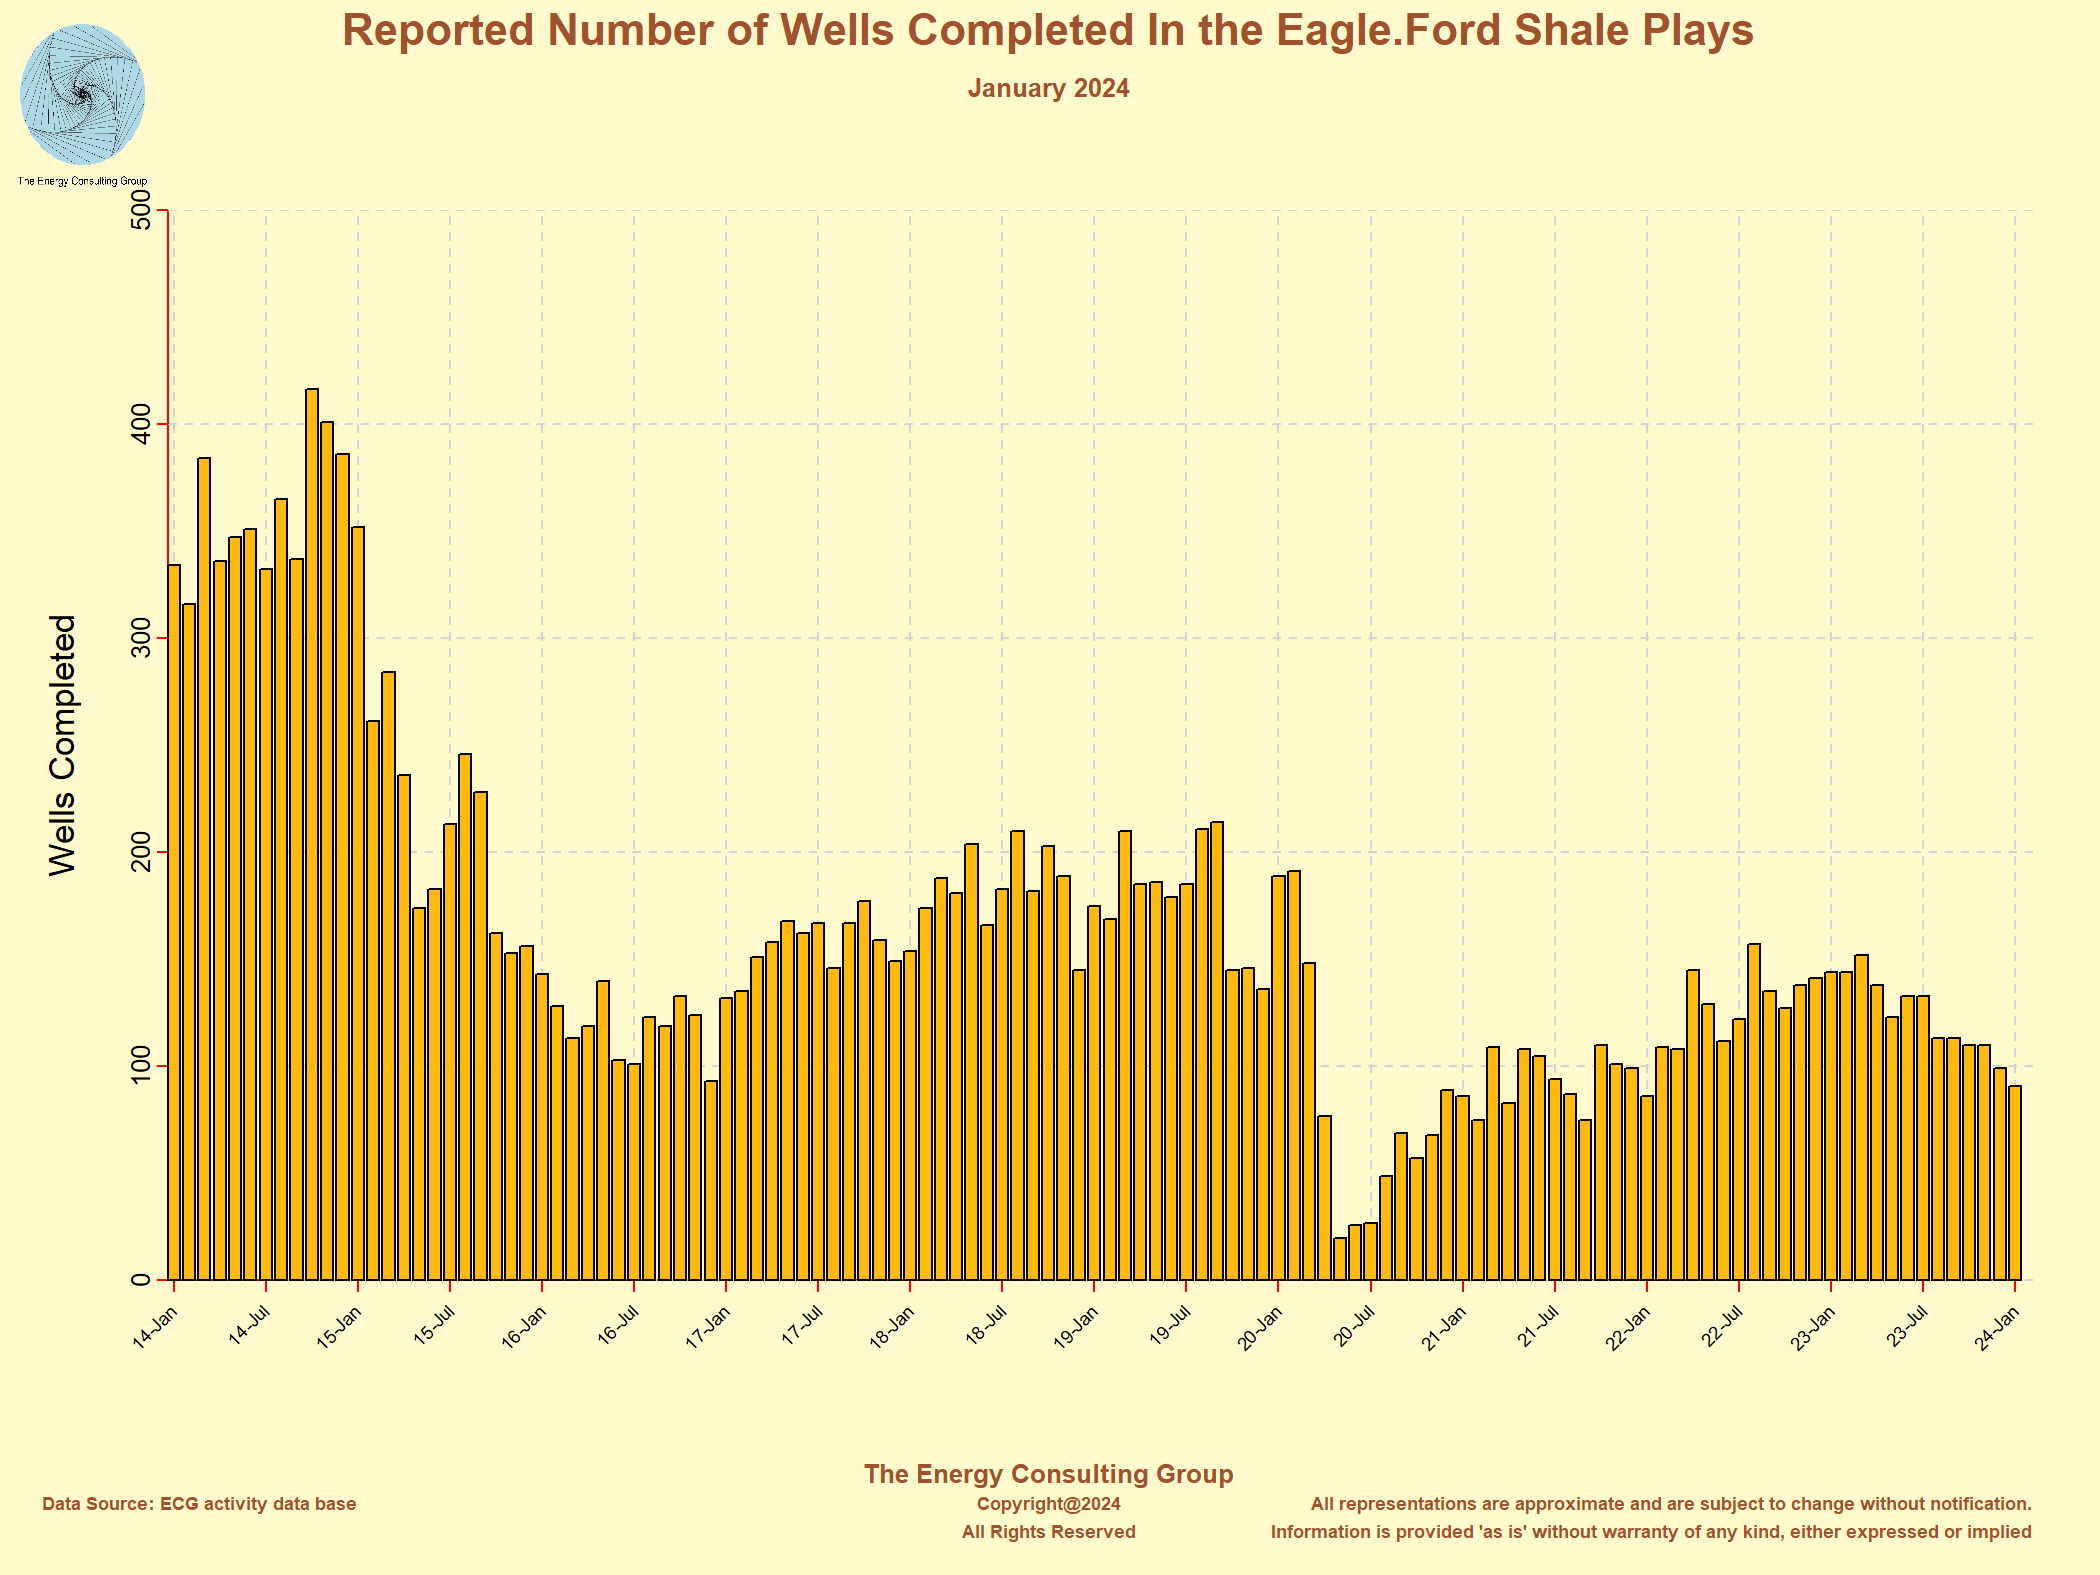
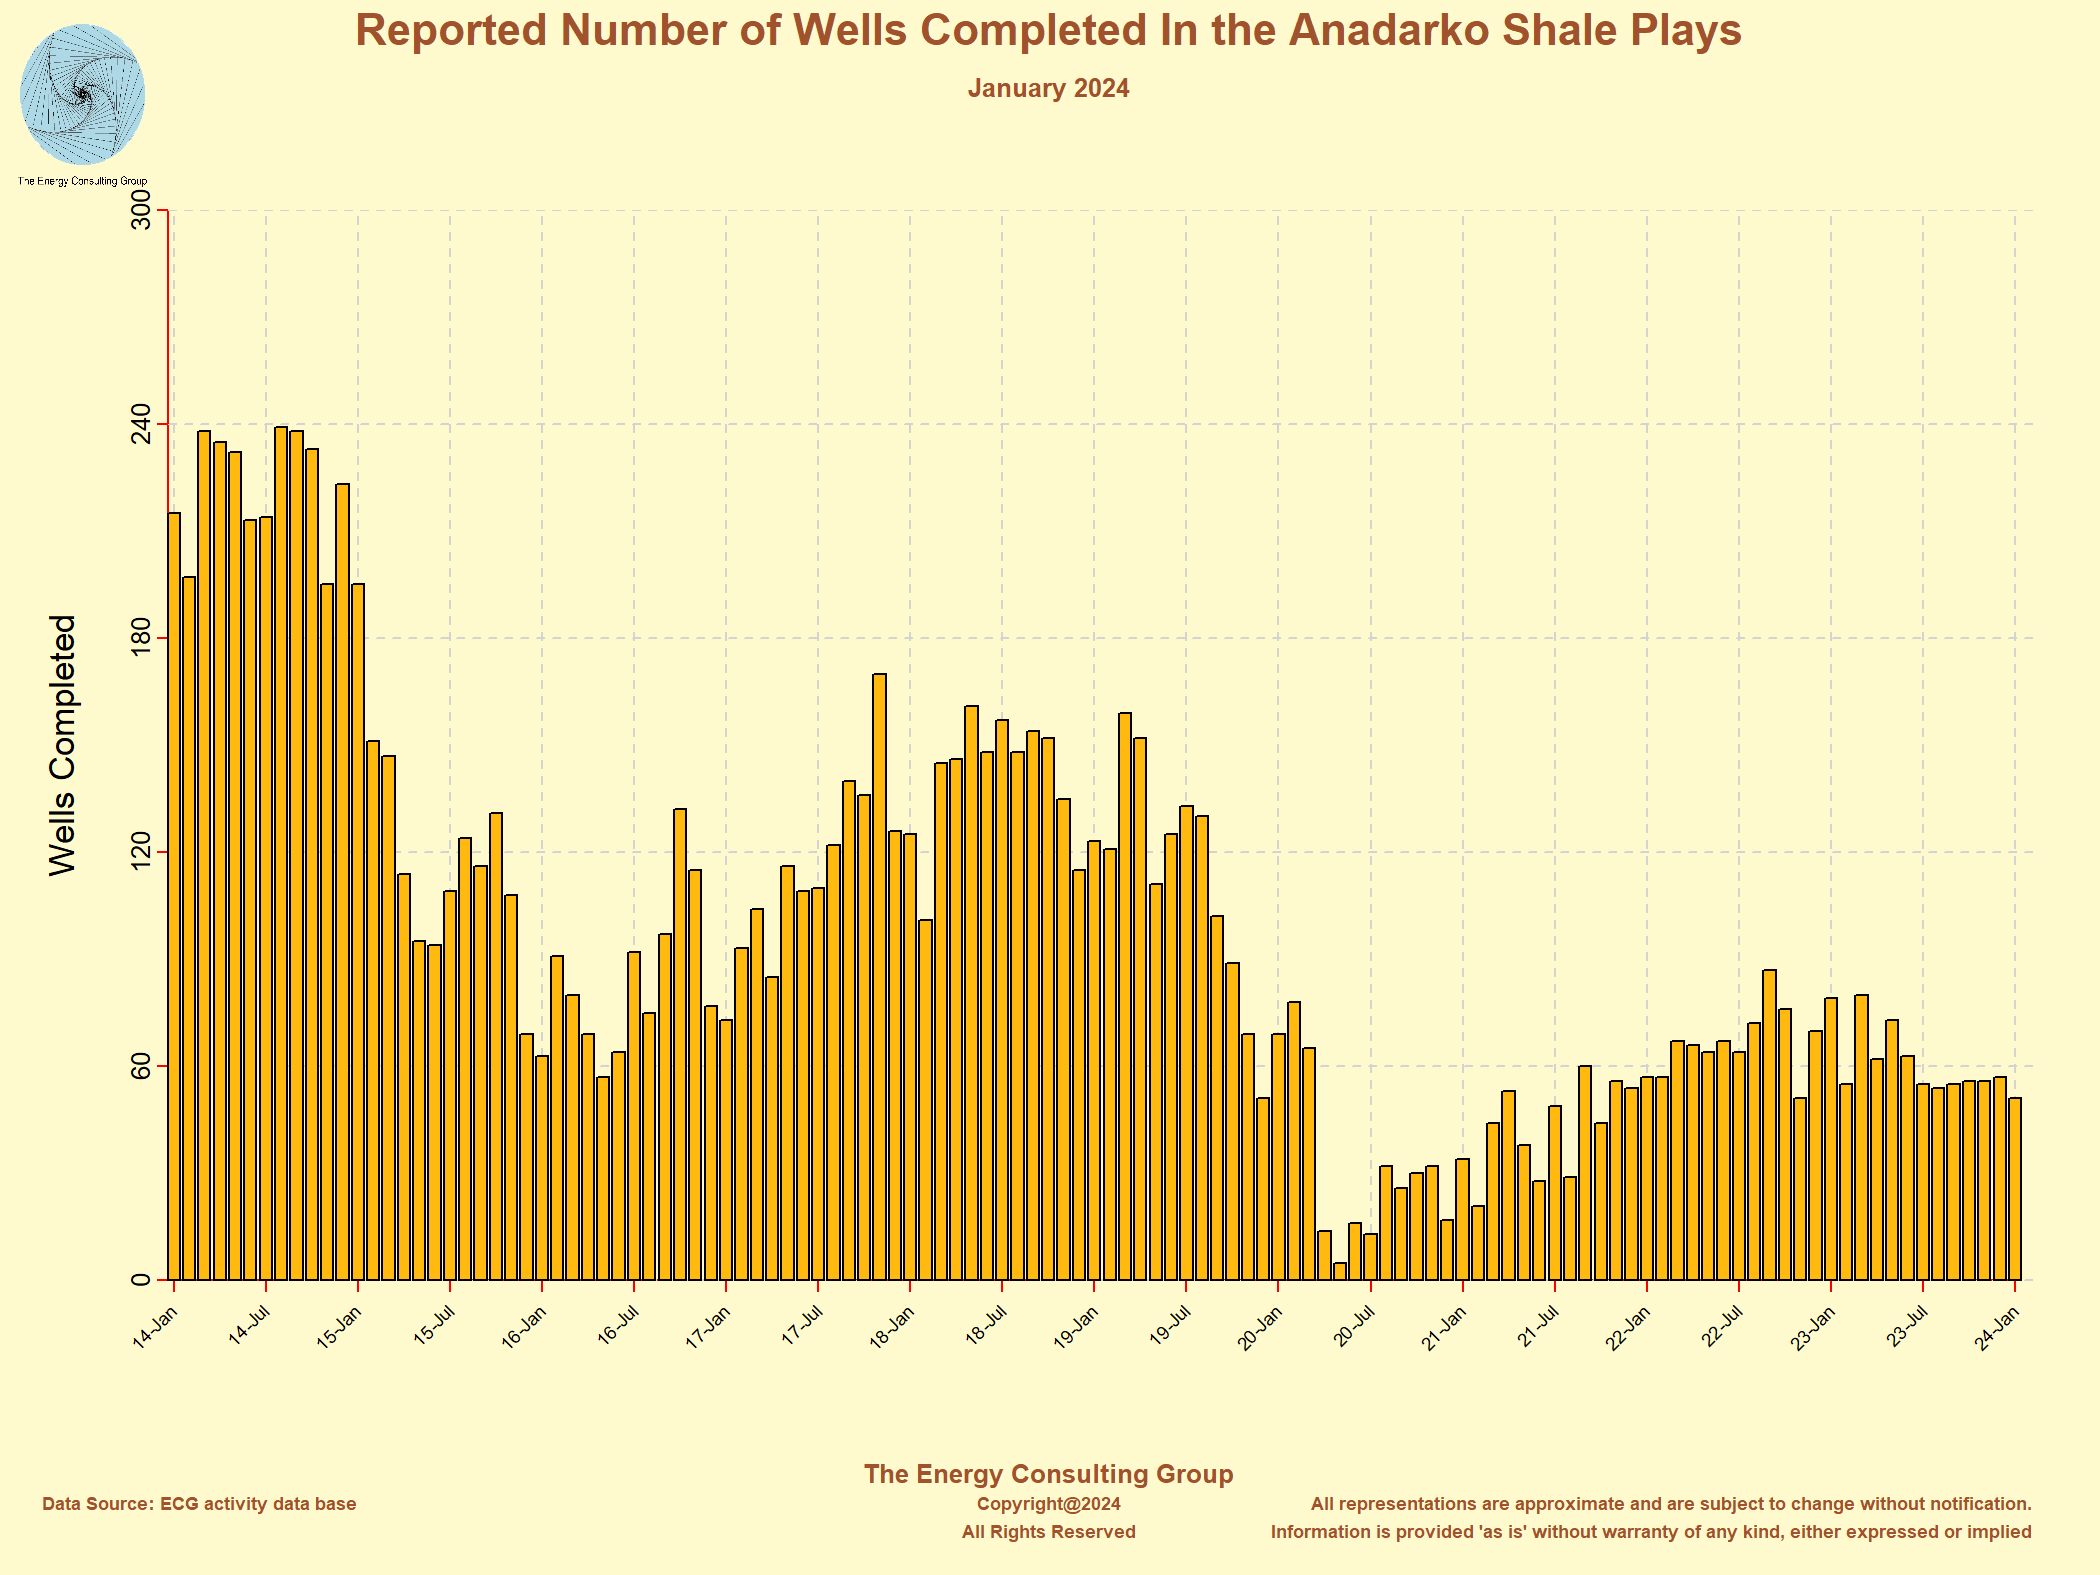
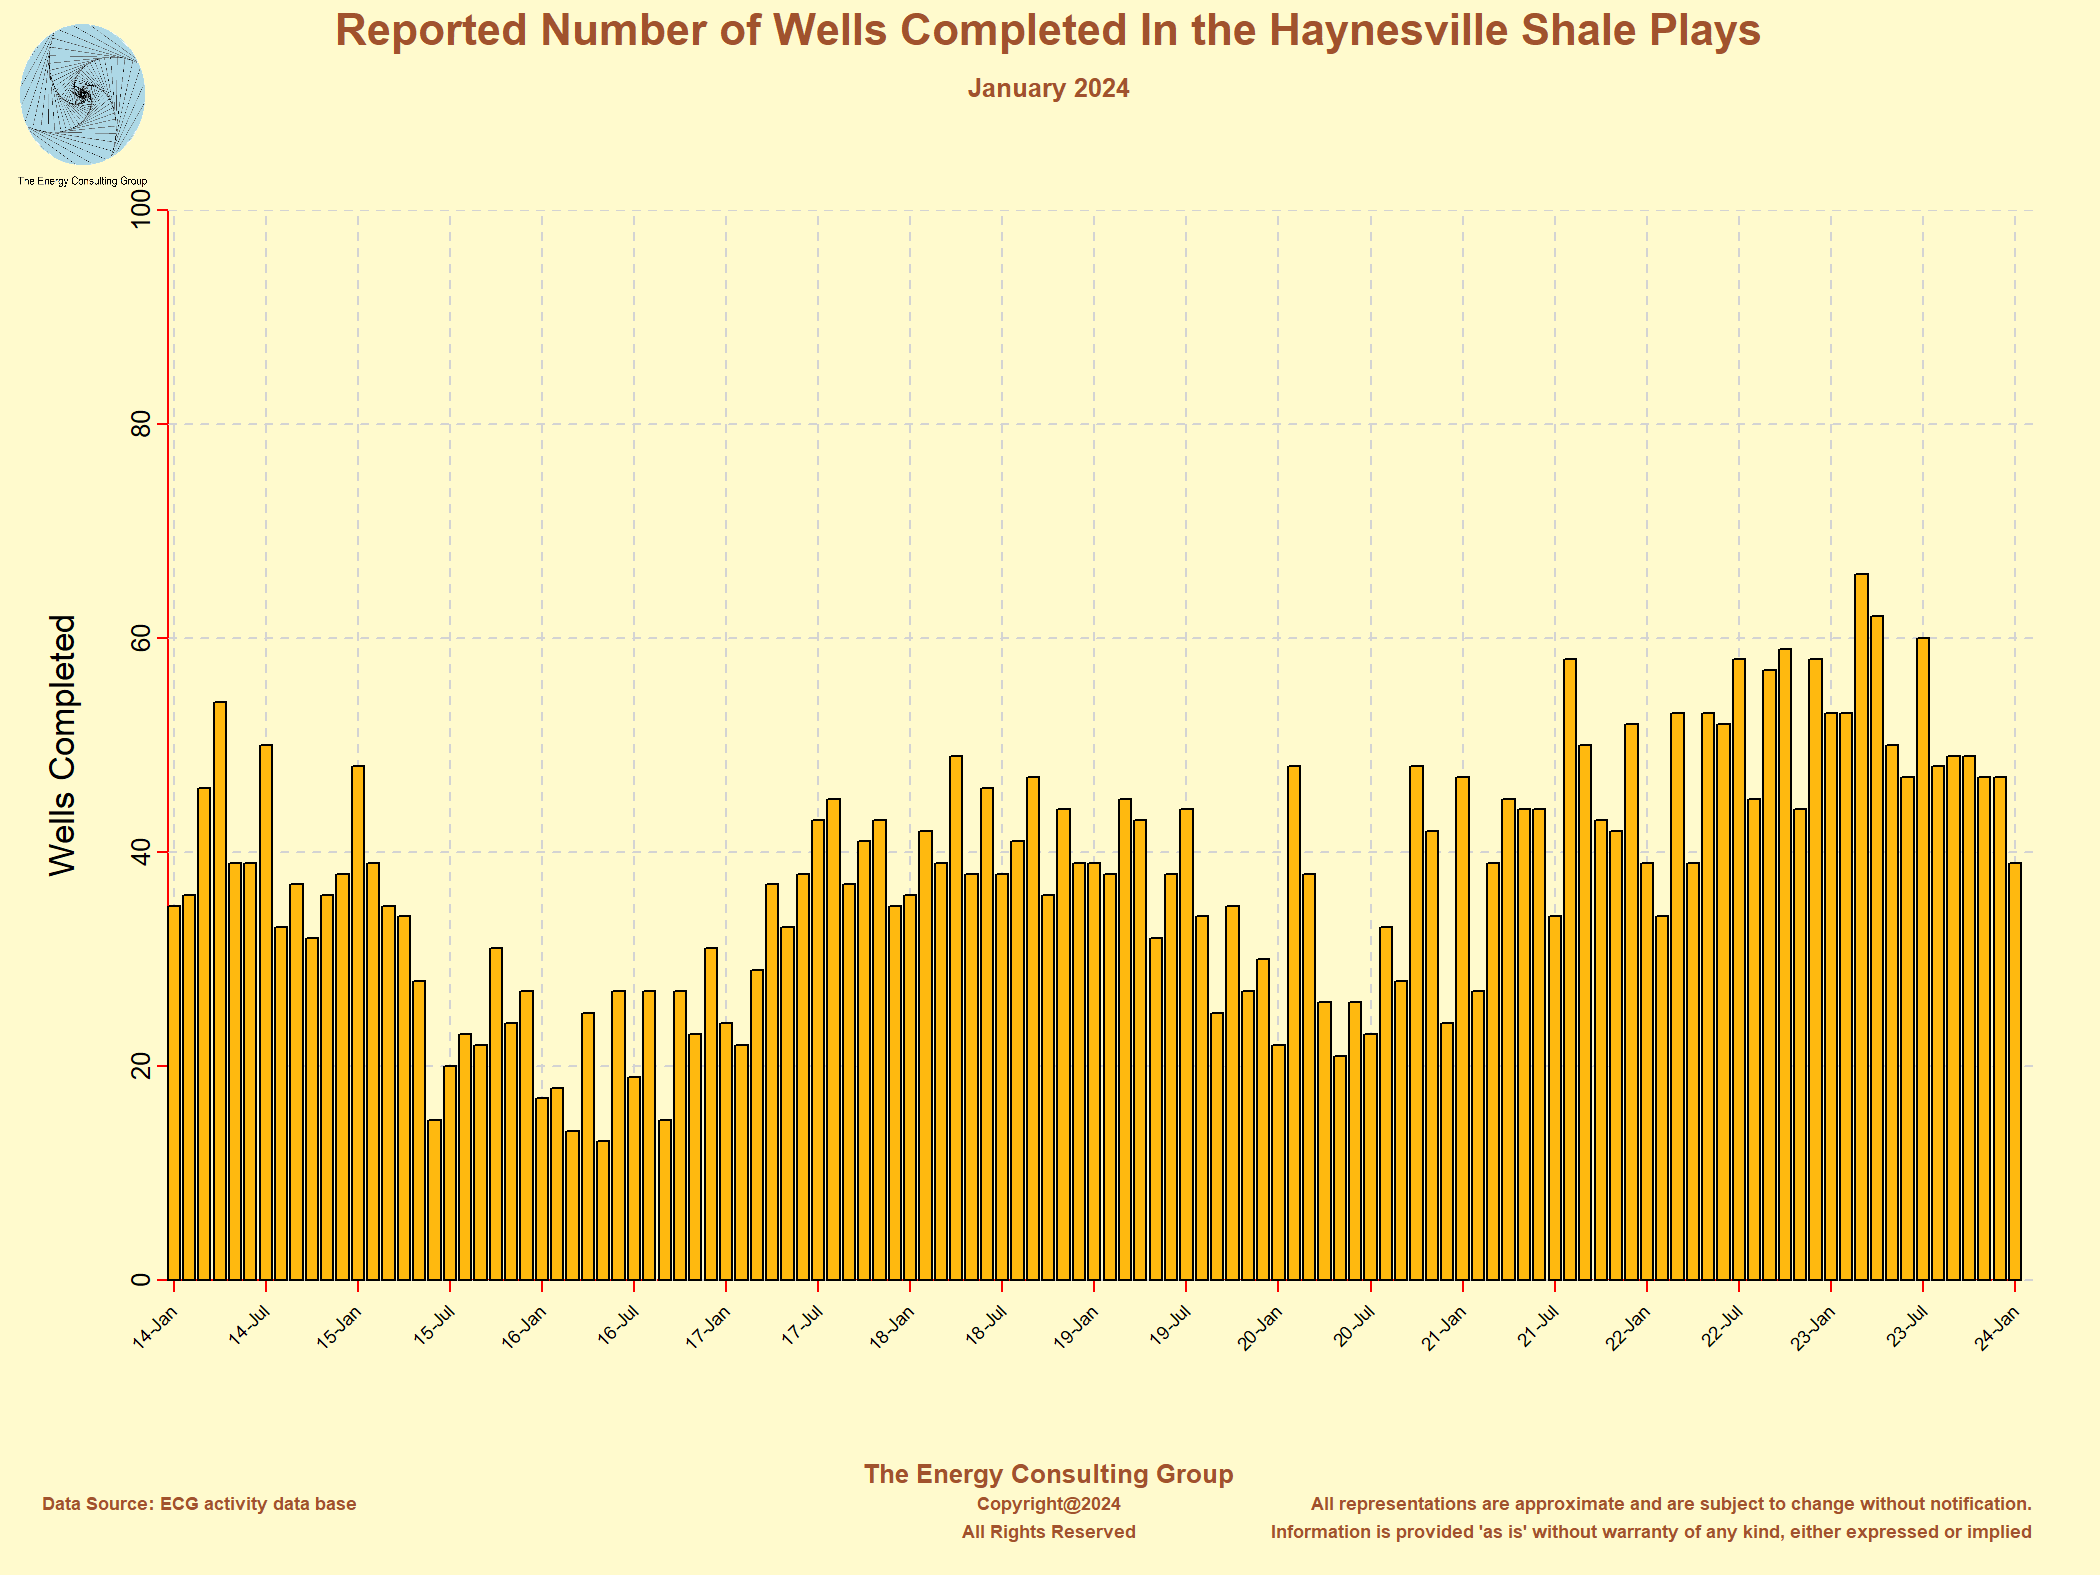
February 2023 Links to area specific graphs and charts showing the monthly number of oil and gas wells completed in each of those areas. Permian Bakken EagleFord Marcellus/Utica Anadarko Haynesville DJ Niobrara Total |
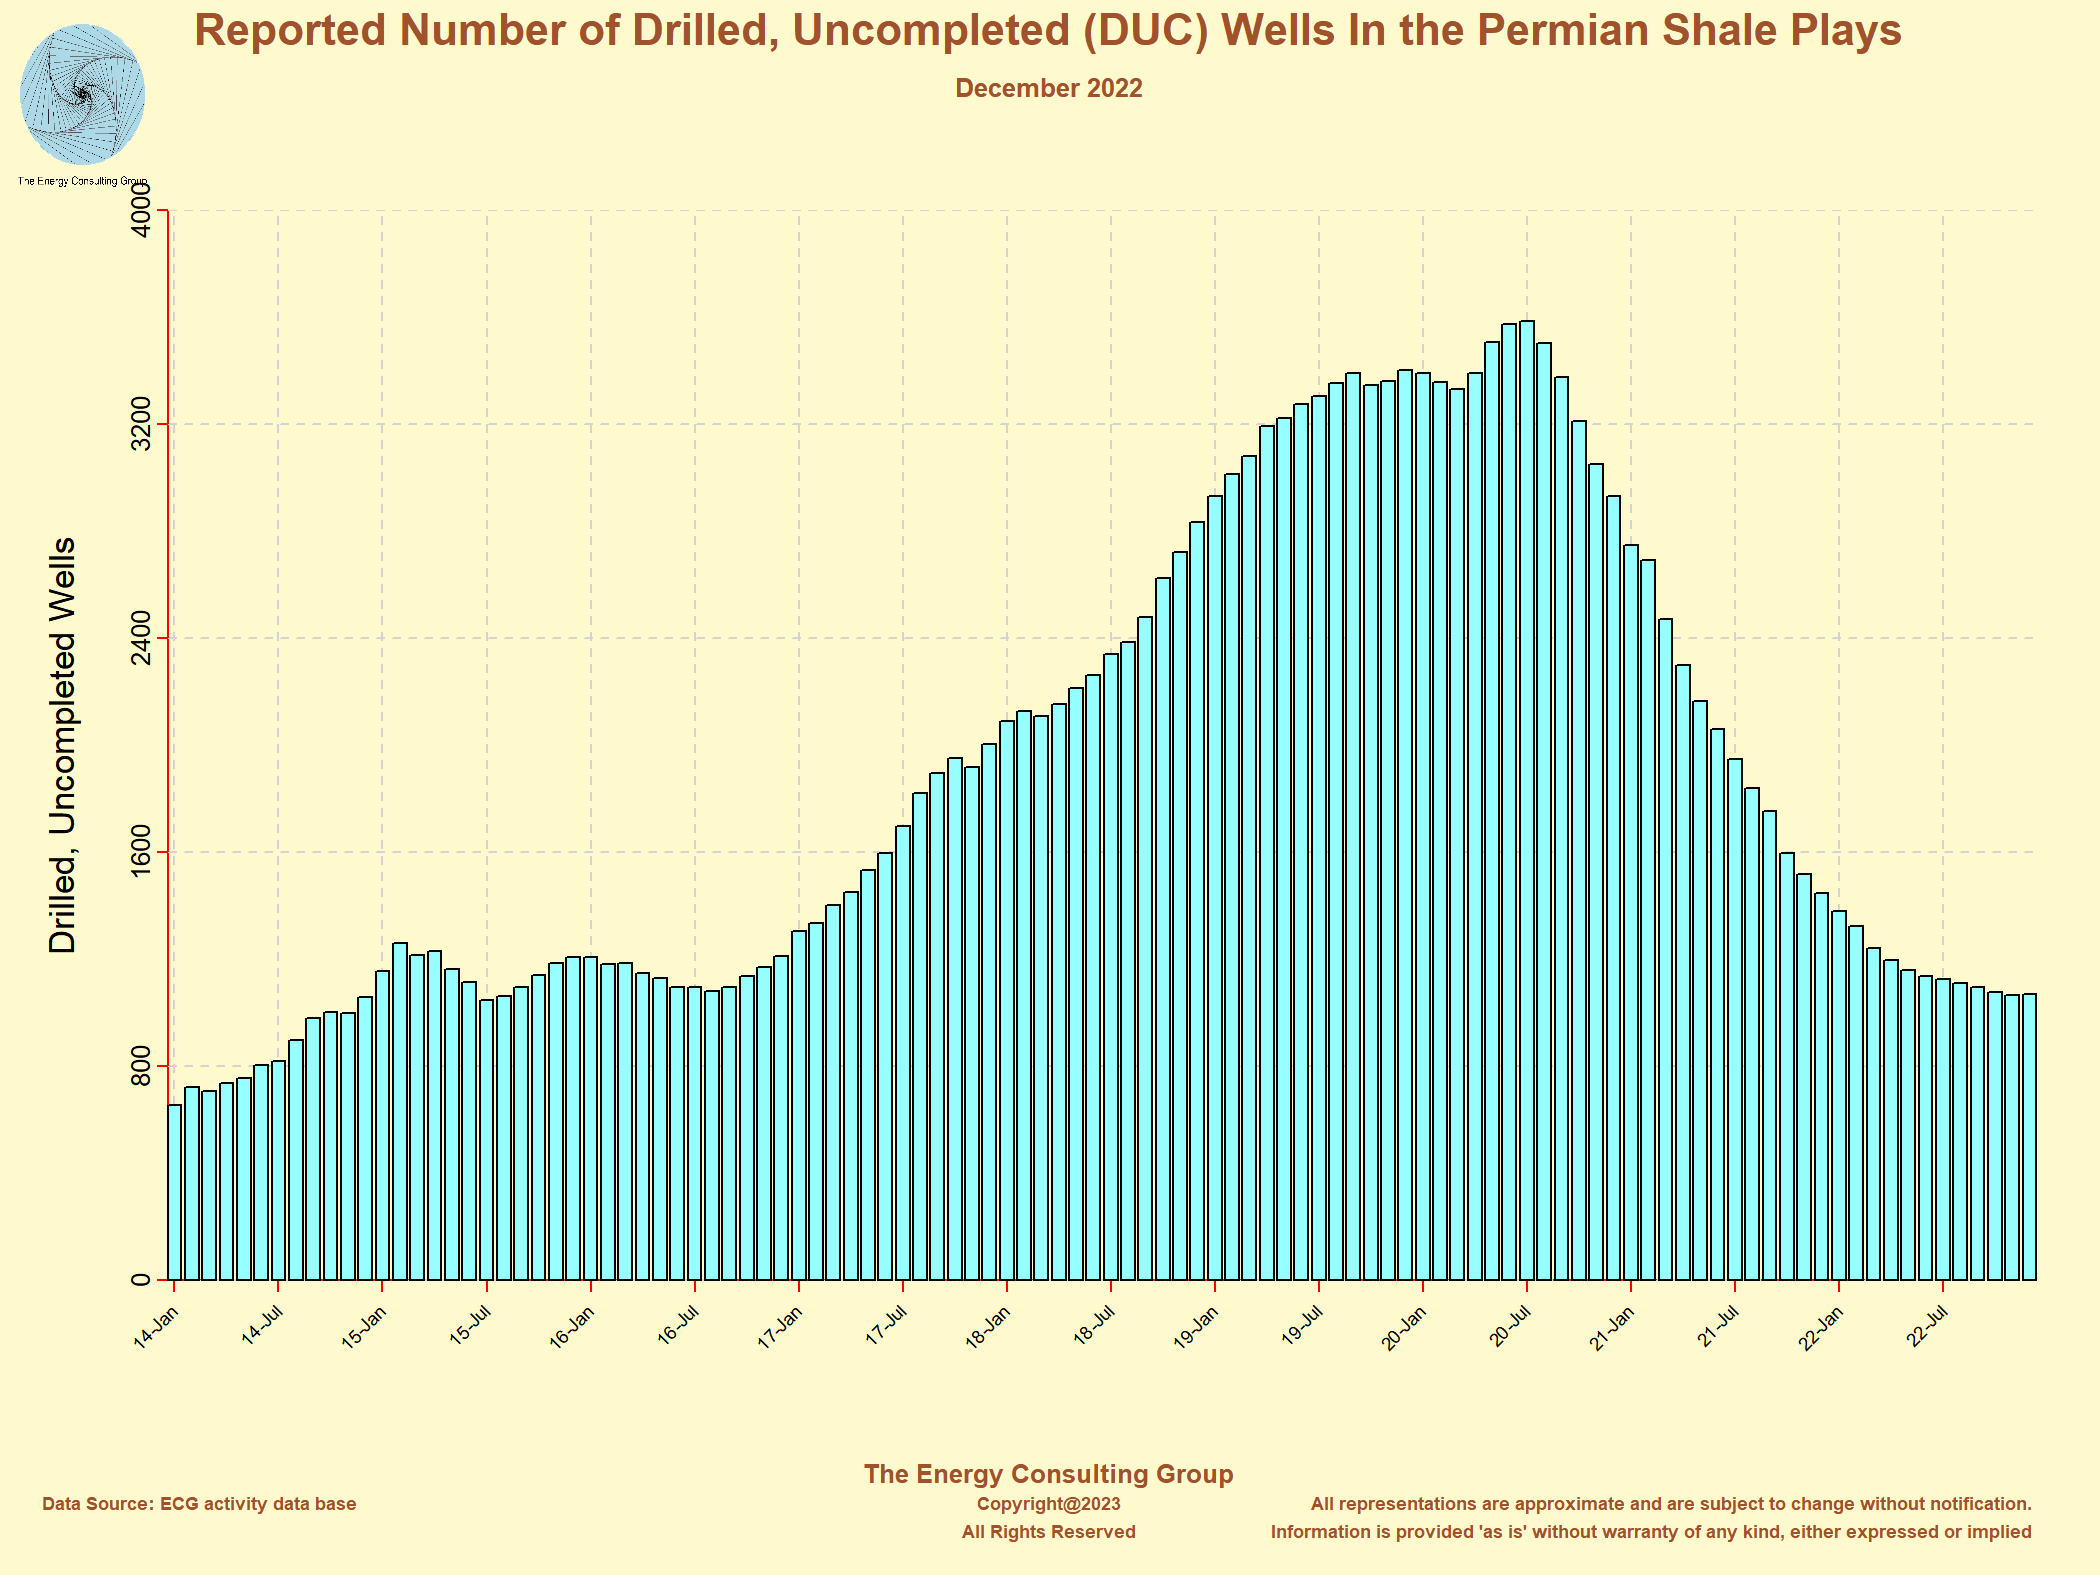
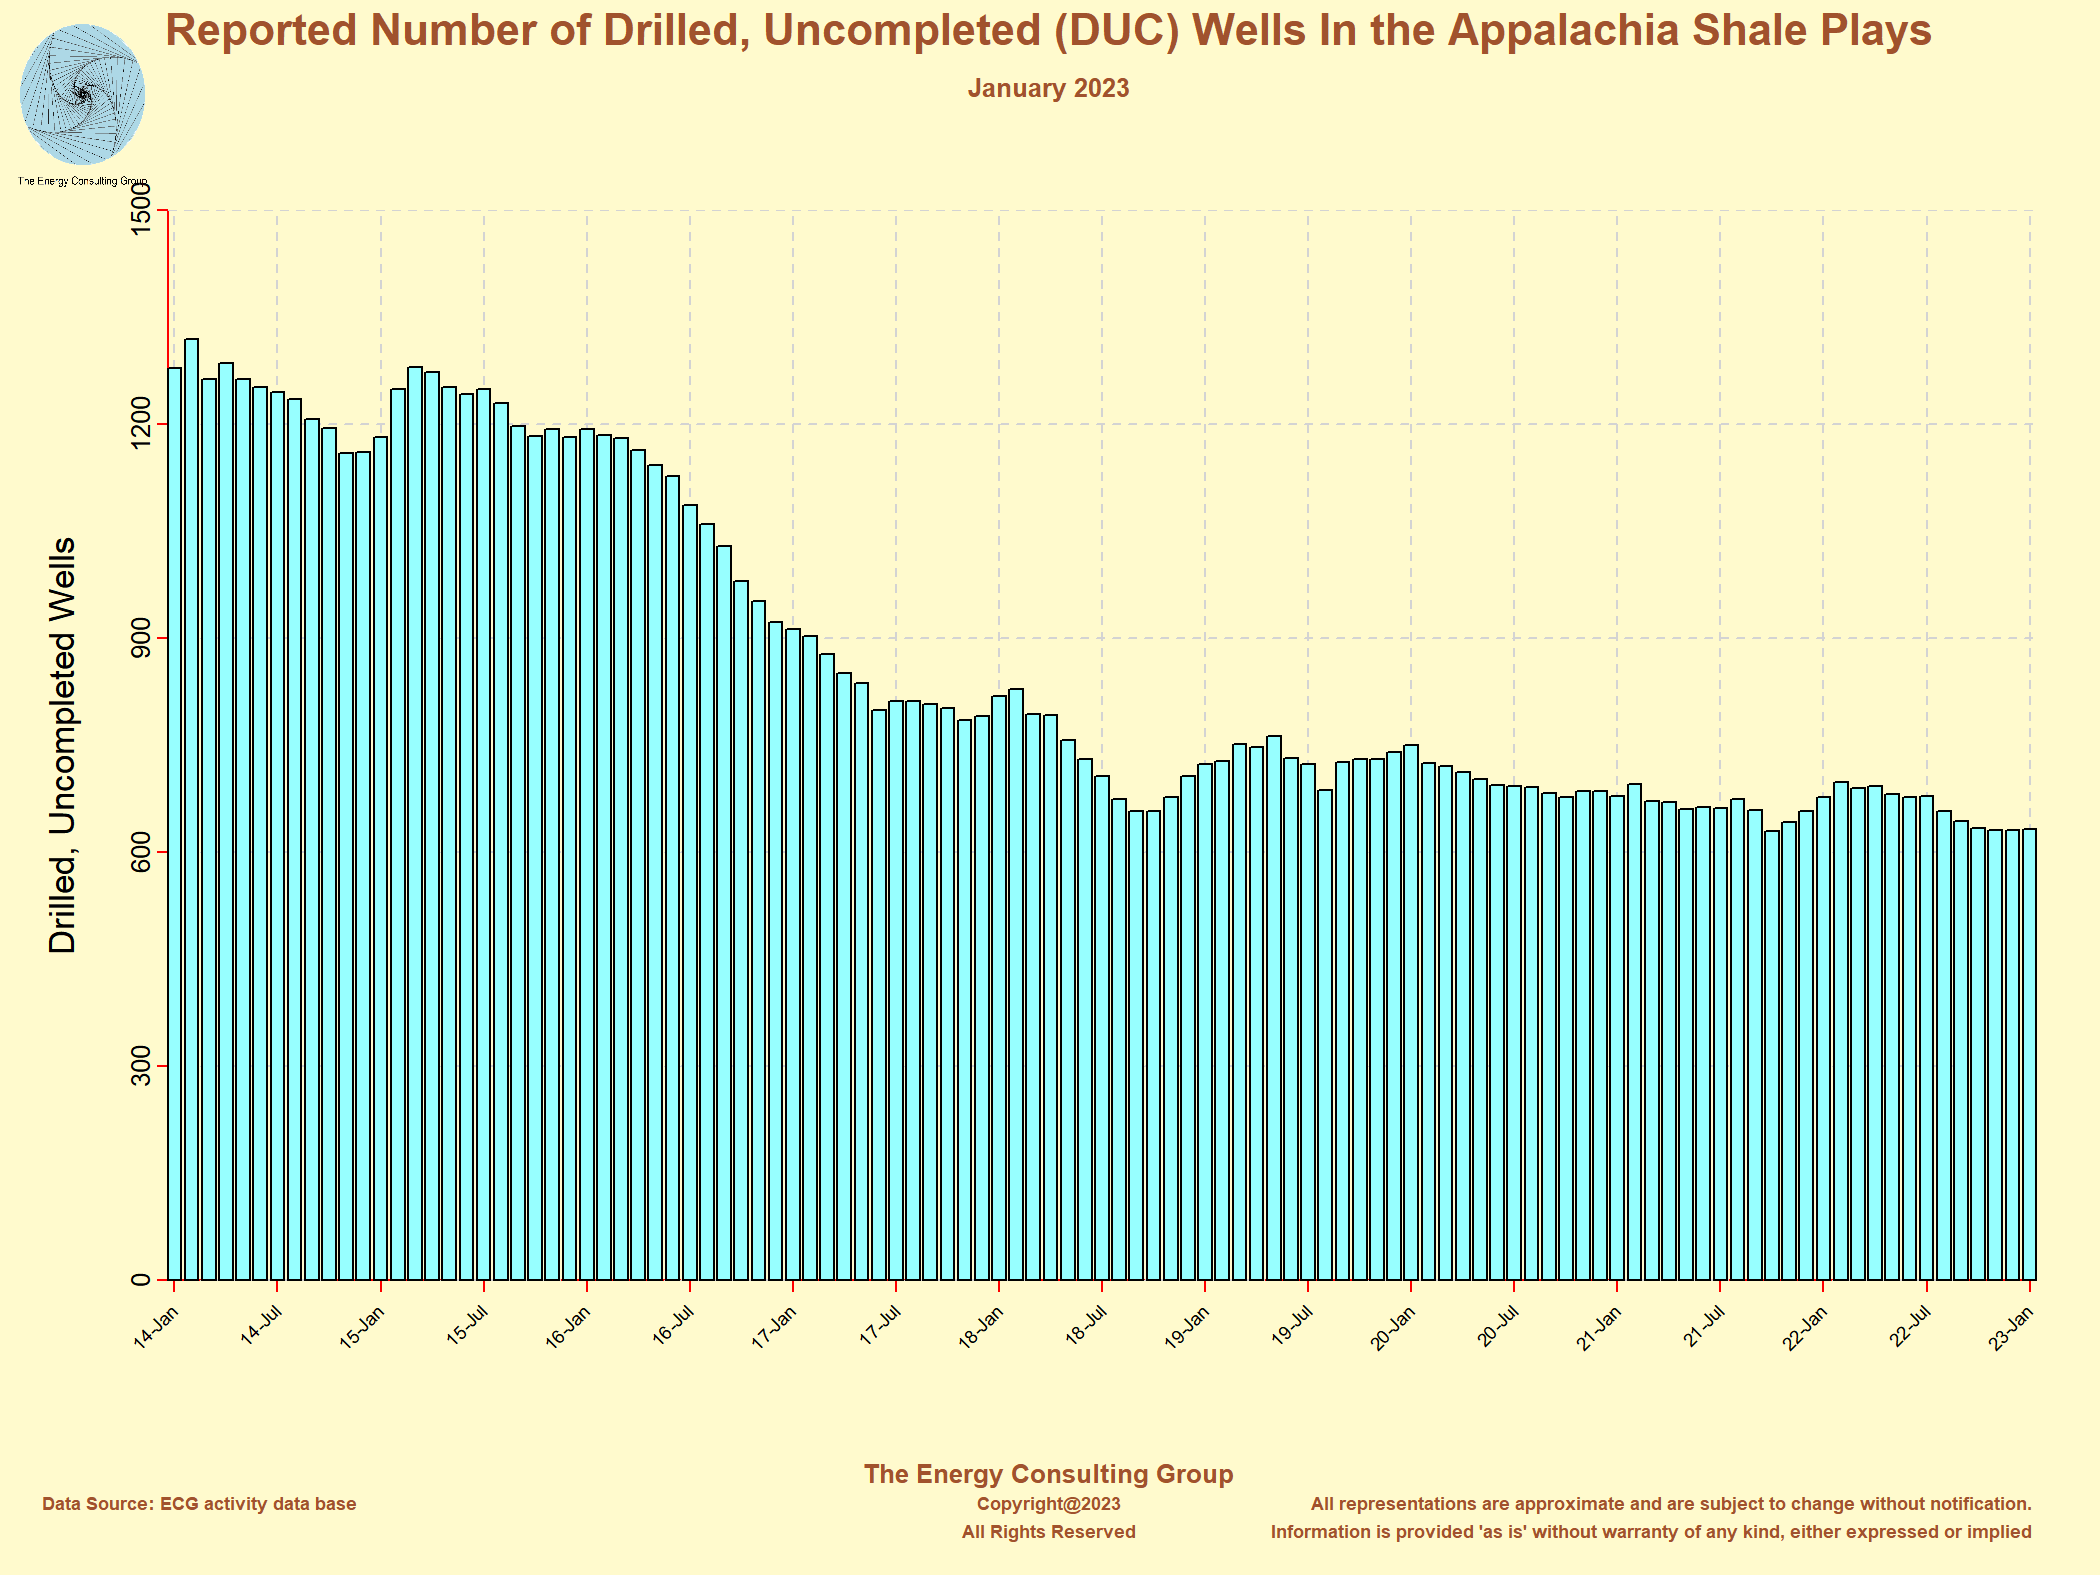
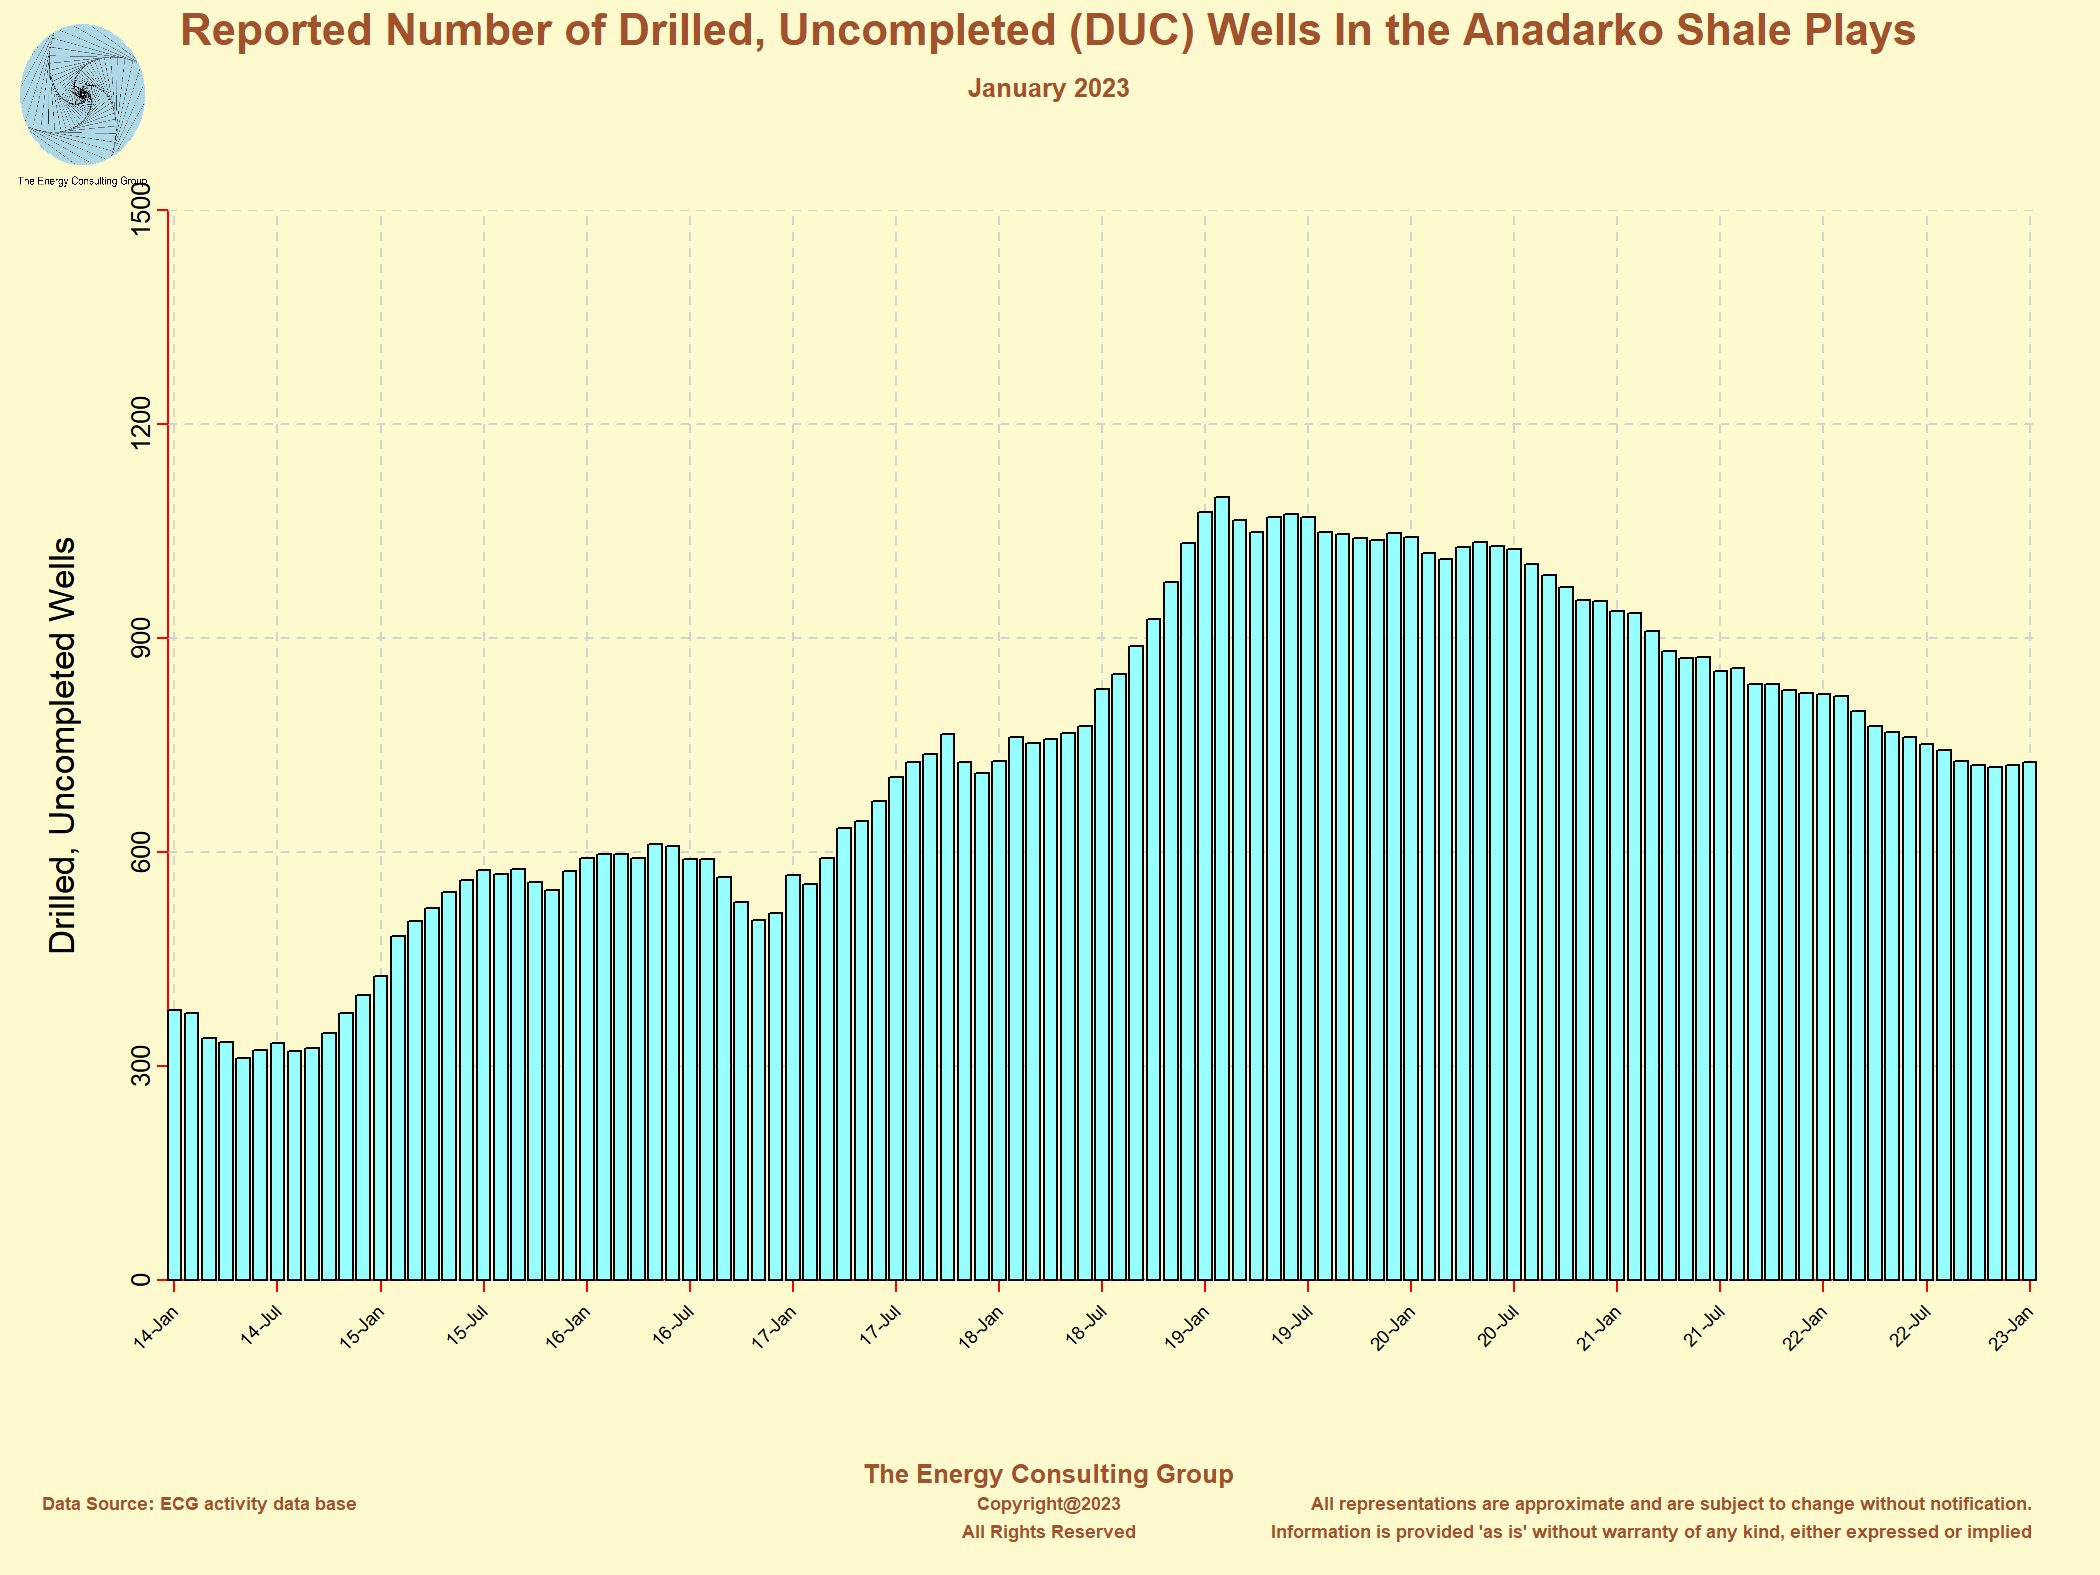
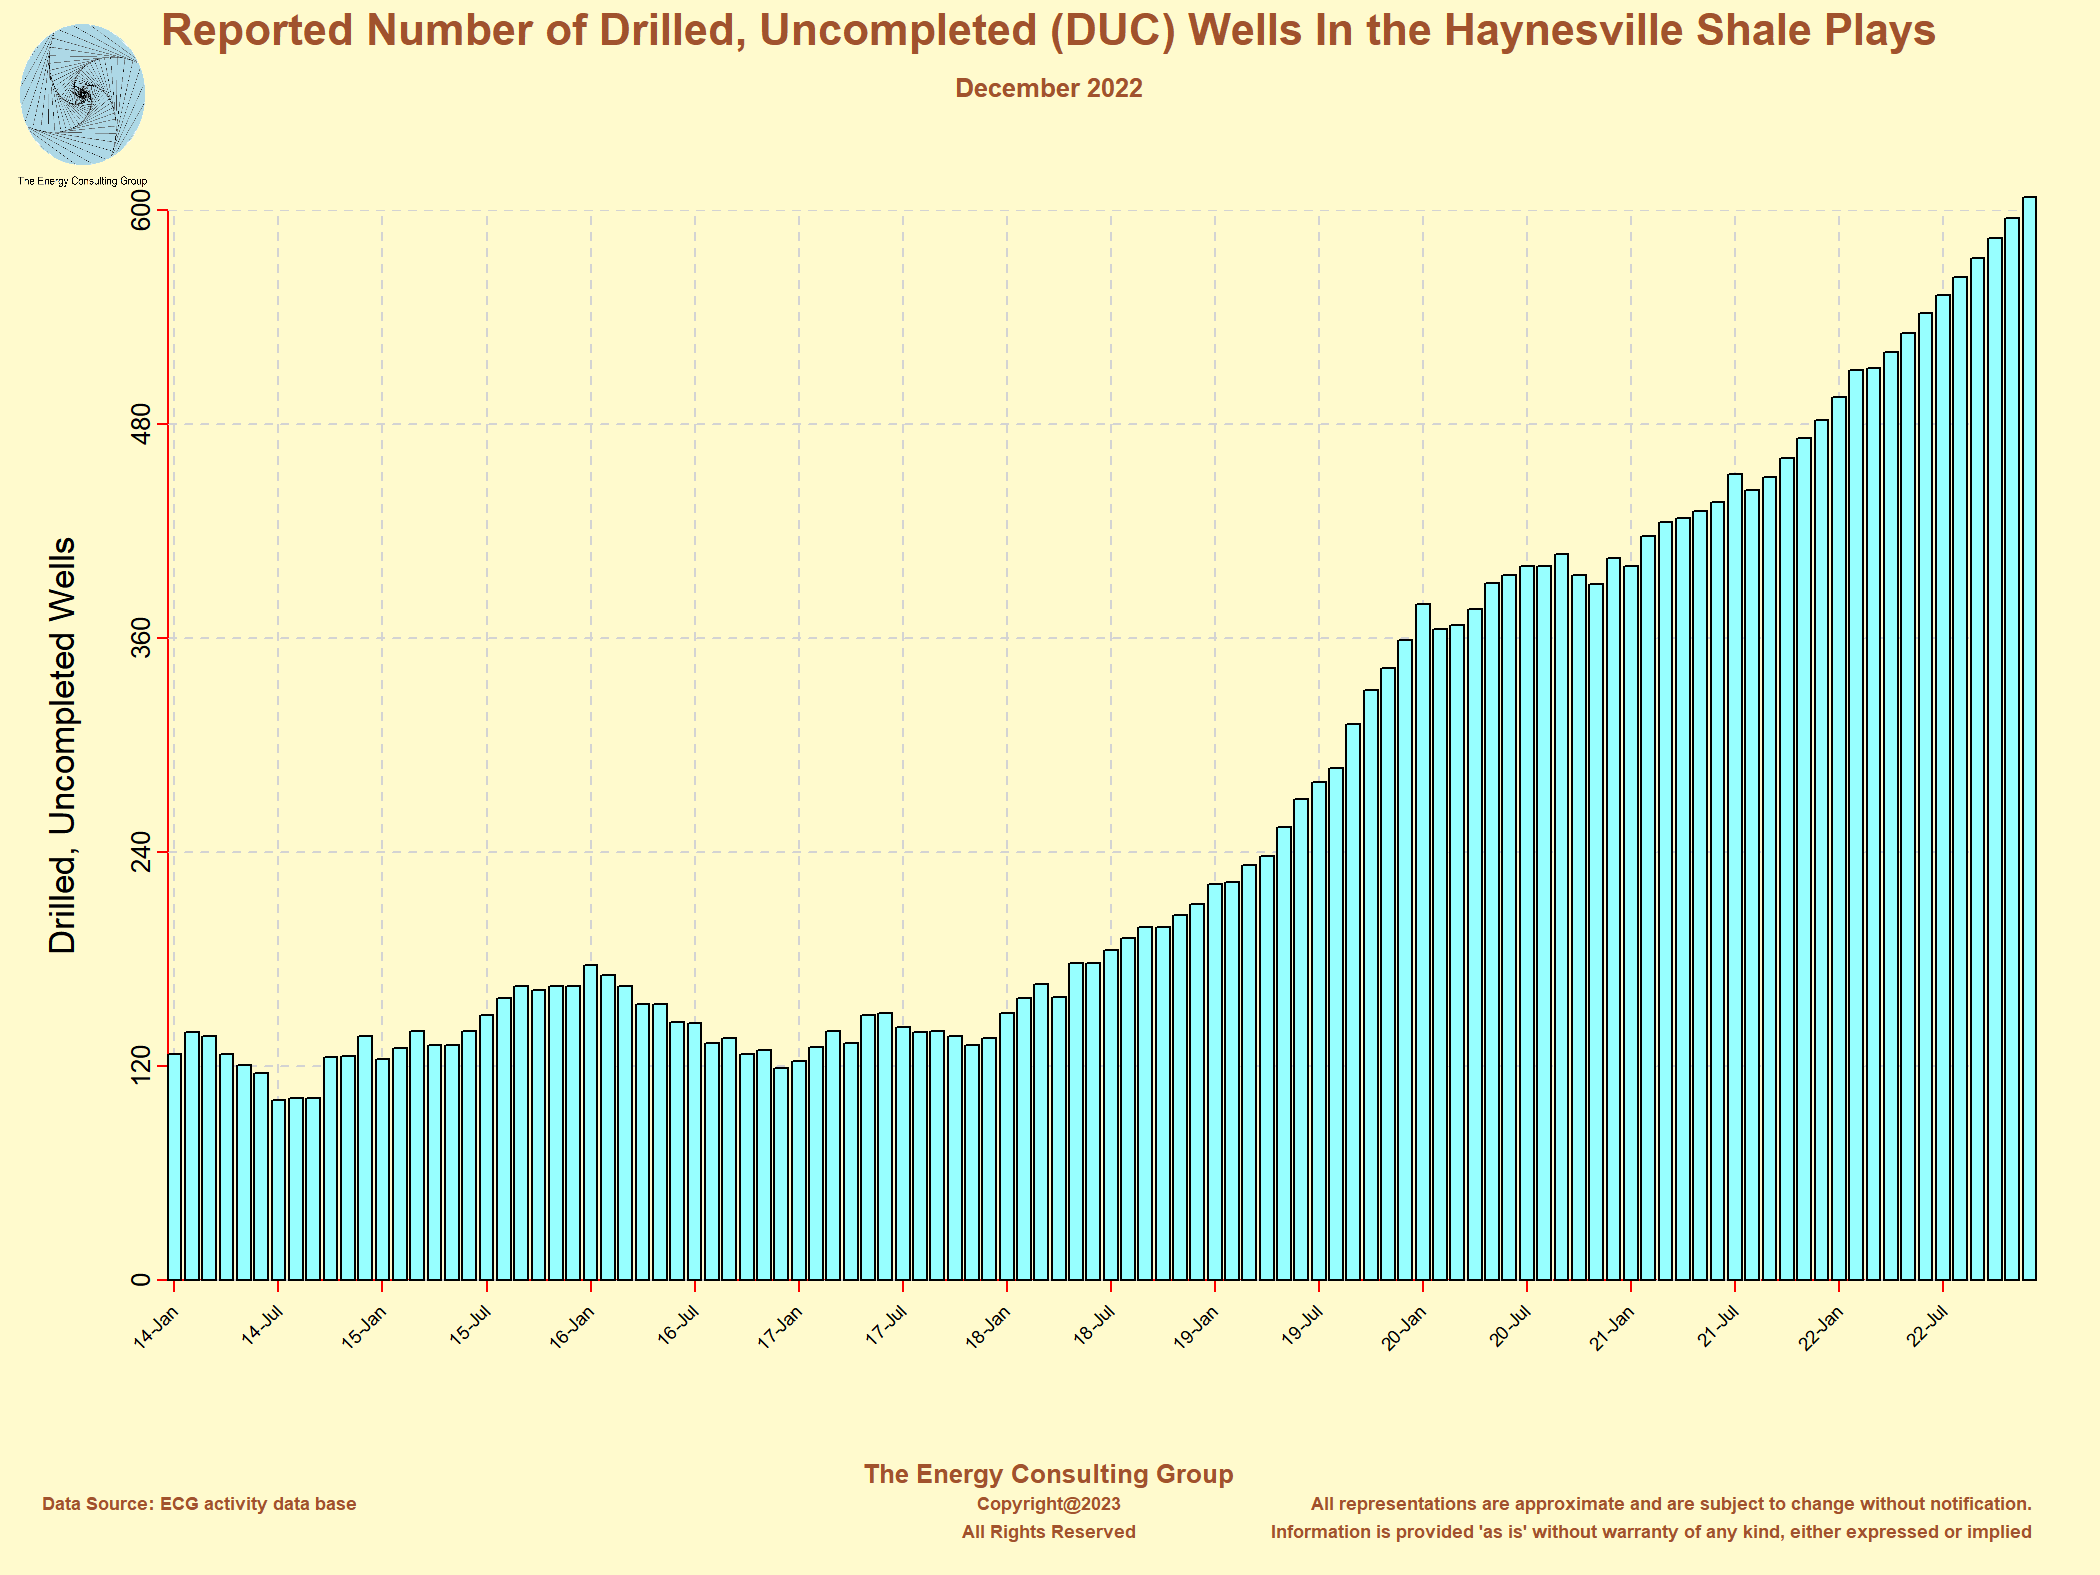
February 2023 Links to area specific graphs and charts showing the monthly number of oil and gas wells drilled, but not completed (DUC's) in each of those areas. Permian Bakken EagleFord Marcellus/Utica Anadarko Haynesville DJ Niobrara Total |
|
This
link takes you to an interactive 3D portal of the USA oil and
gas drilling activity, heat map shown to the left, "Recent USA Oil and
Gas Drilling Activity Map. In the interest of impoving your
understanding of US shale development activity, our cutting edge
web technology allows the 3D map to be rotated, zoomed and
roamed at will. Also, in the interest of improving visitor
understanding of the US shale industry, we have imbedded live
links, which allow access to historical rig count charts, current drilling activity maps,
as well as monthly estimates of the number of wells
drilled, completed and wells which have been drilled but not
completed (DUC's). In addition, we also supply oil and gas
production charts for these same shale areas.
To call-up this additional information, click on the blue half spheres
on the portal, and on
the resulting pop-up, click the relevant hi-lighted links. The base map
is a US elevation map. To control the 3D map linked above, rotate it by pressing the left mouse button down and moving the mouse, zoom in/out by pressing the mouse wheel down and moving the mouse up and down, and roam it by pressing the right mouse button down and moving the mouse. |
||||||
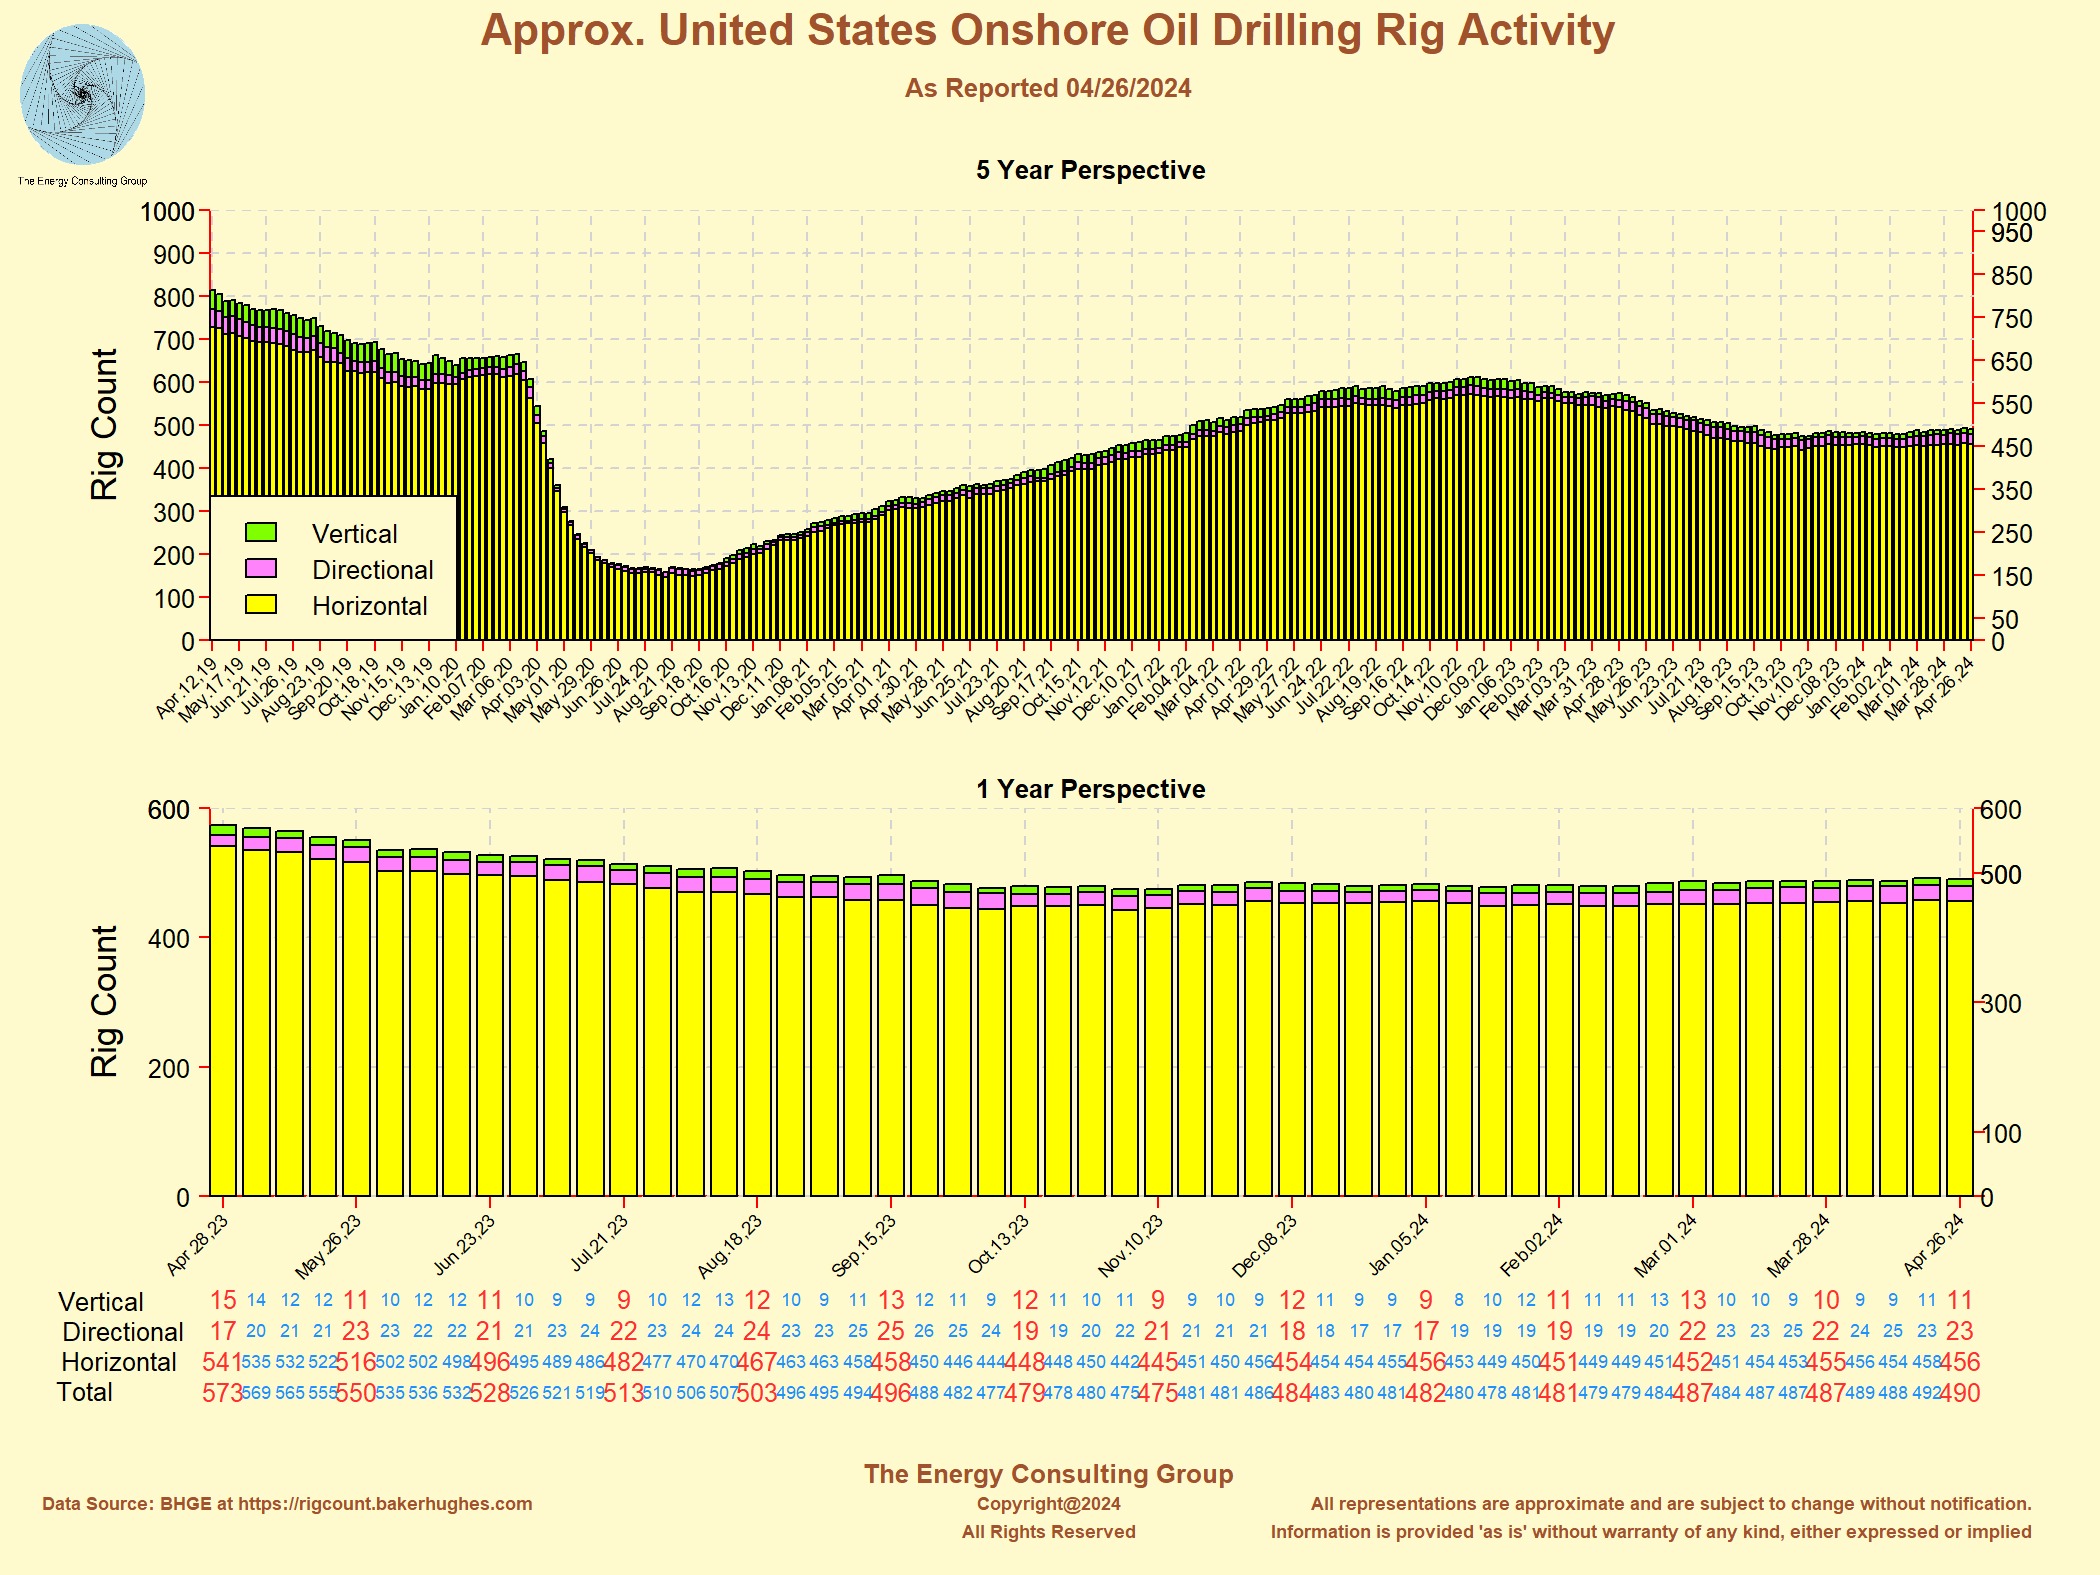
Approximate Oil Related Drilling Rig Activity for the
United States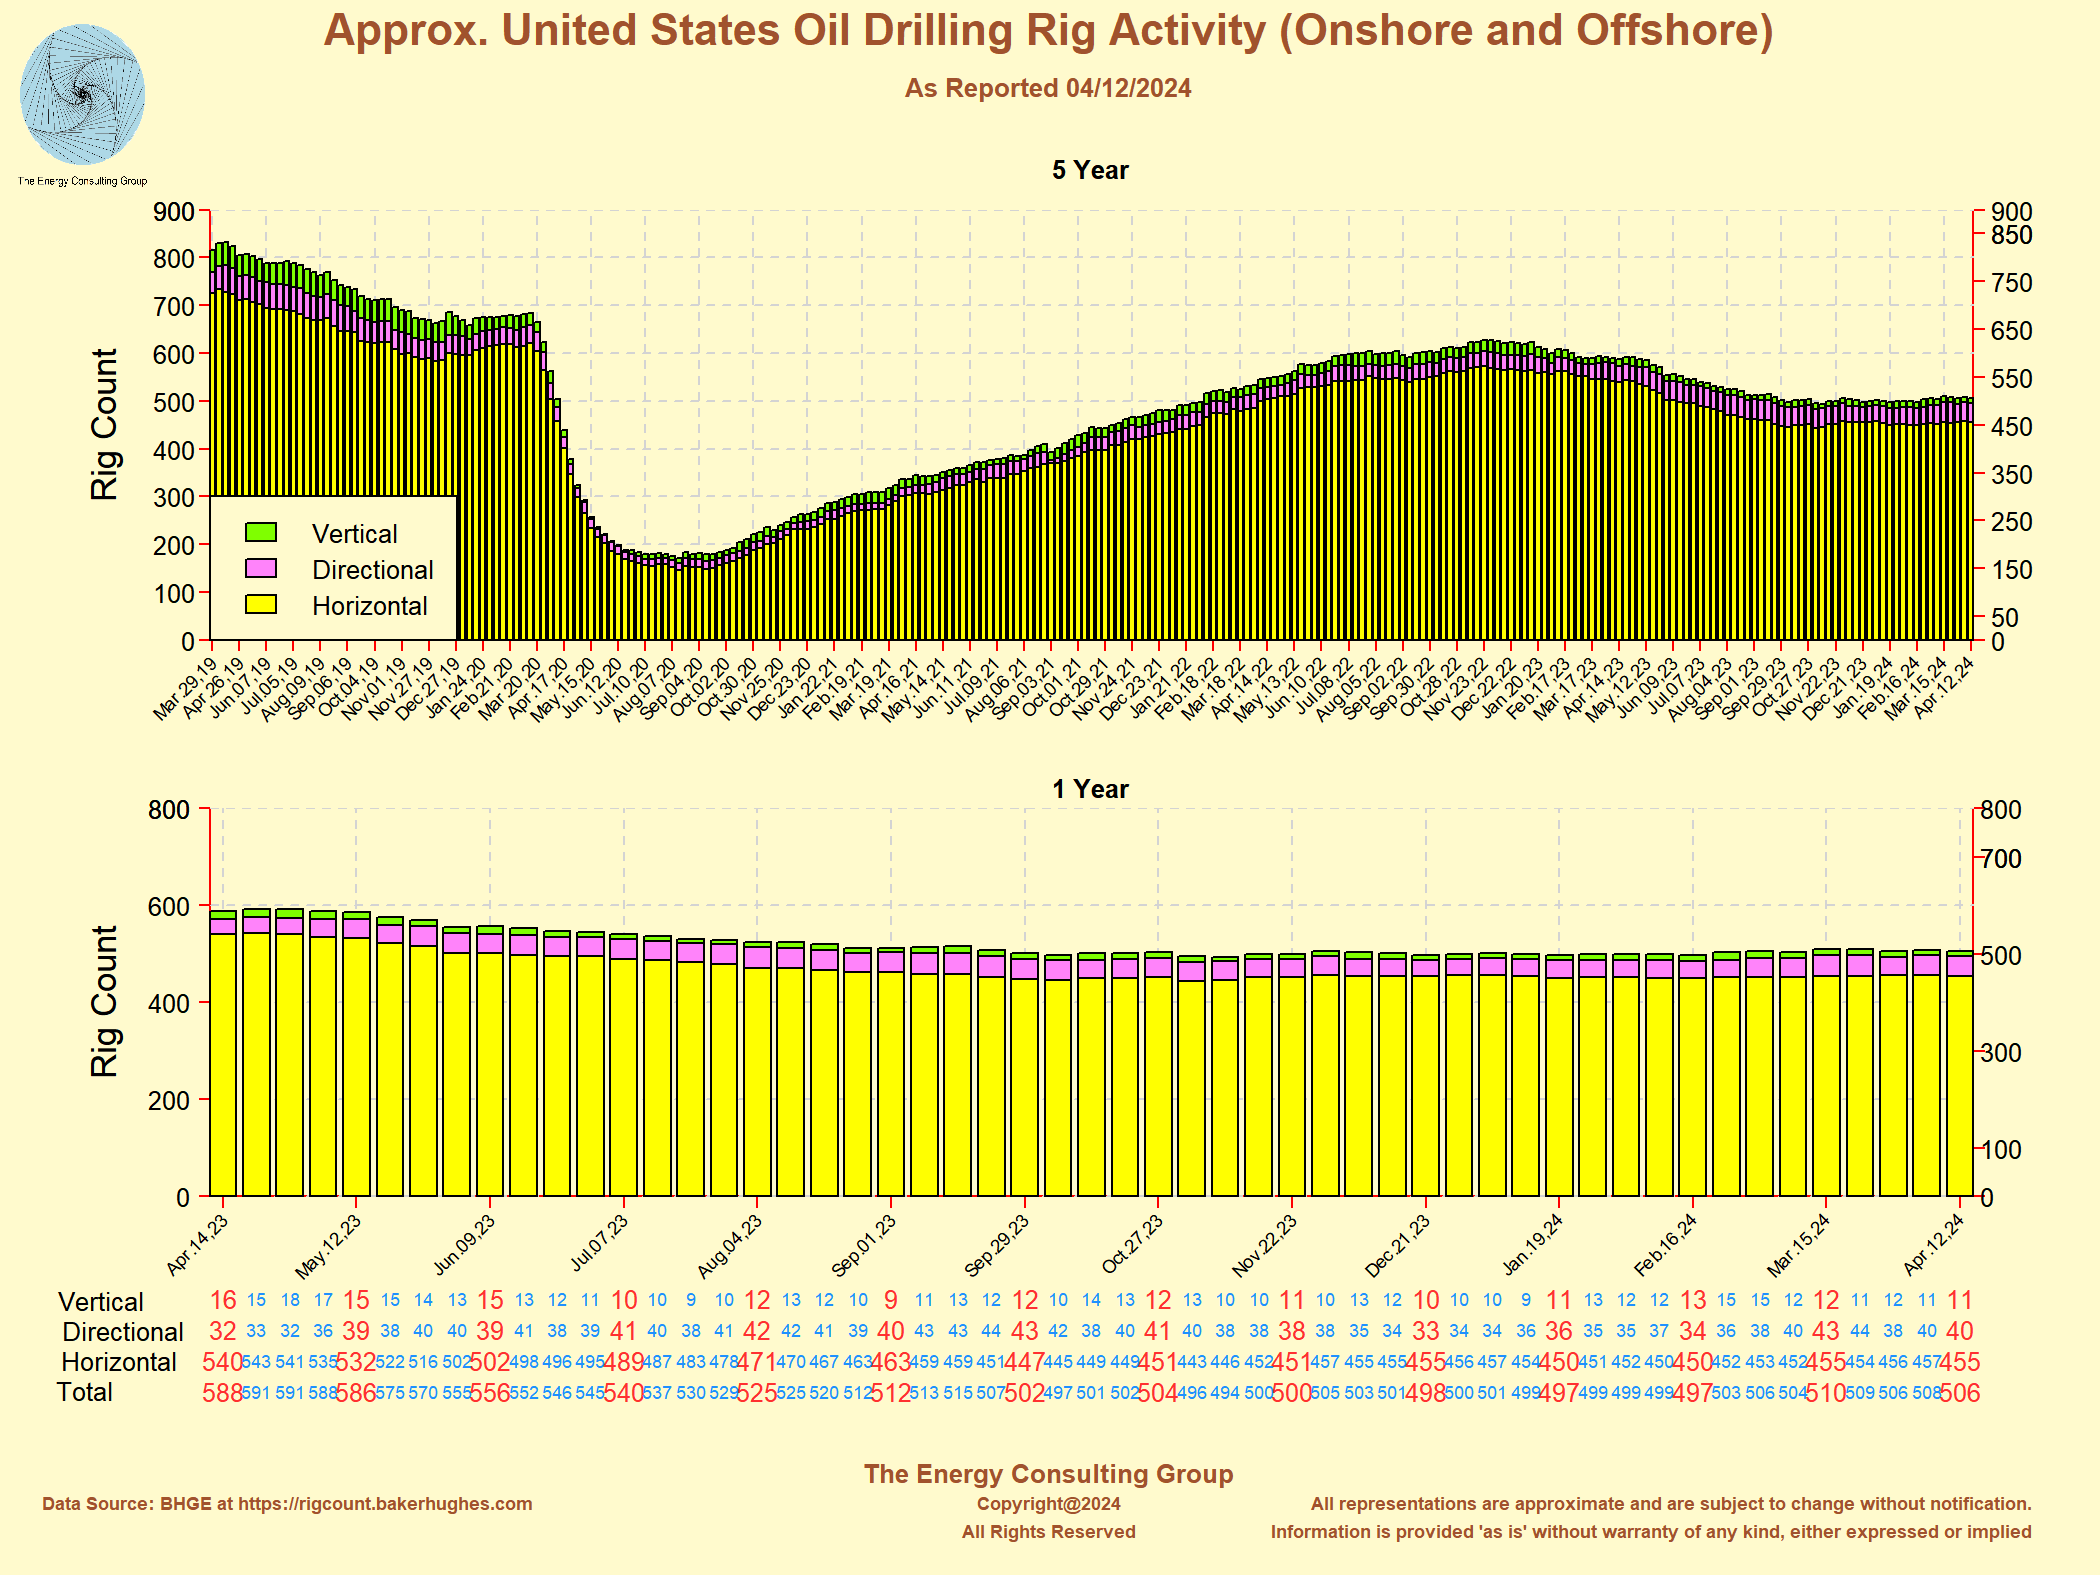 Click on the image for higher resolution version. |
Approximate Gas Related Drilling Rig Activity for the
United States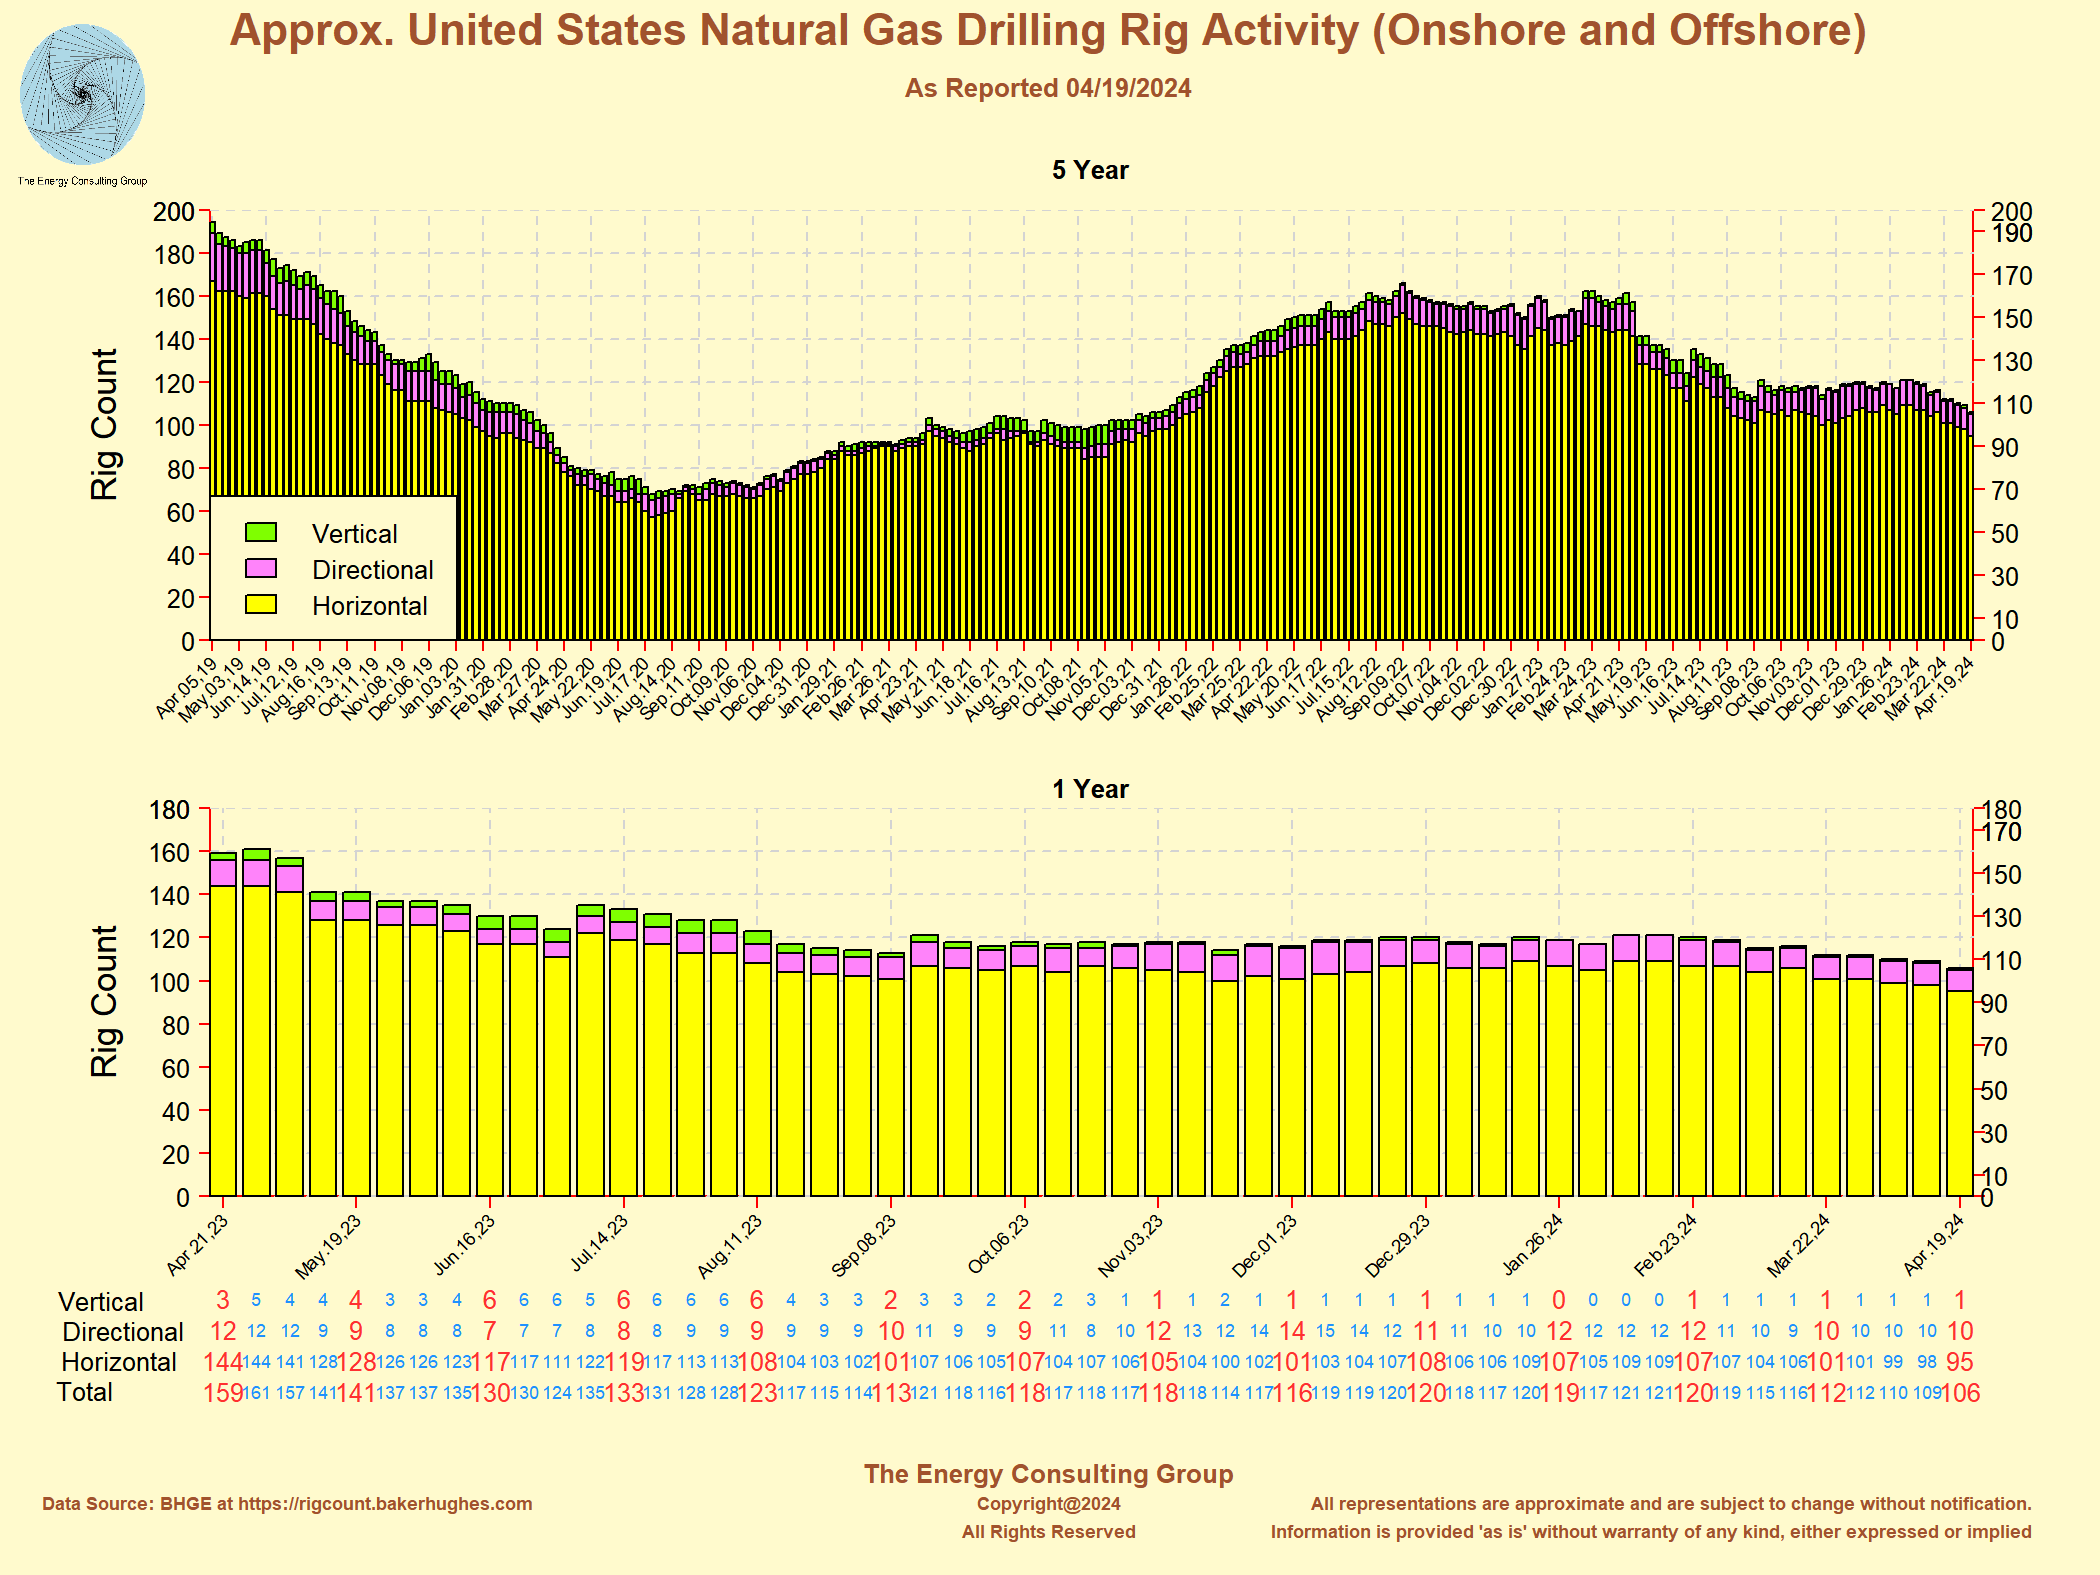 Click on the image for higher resolution version. |
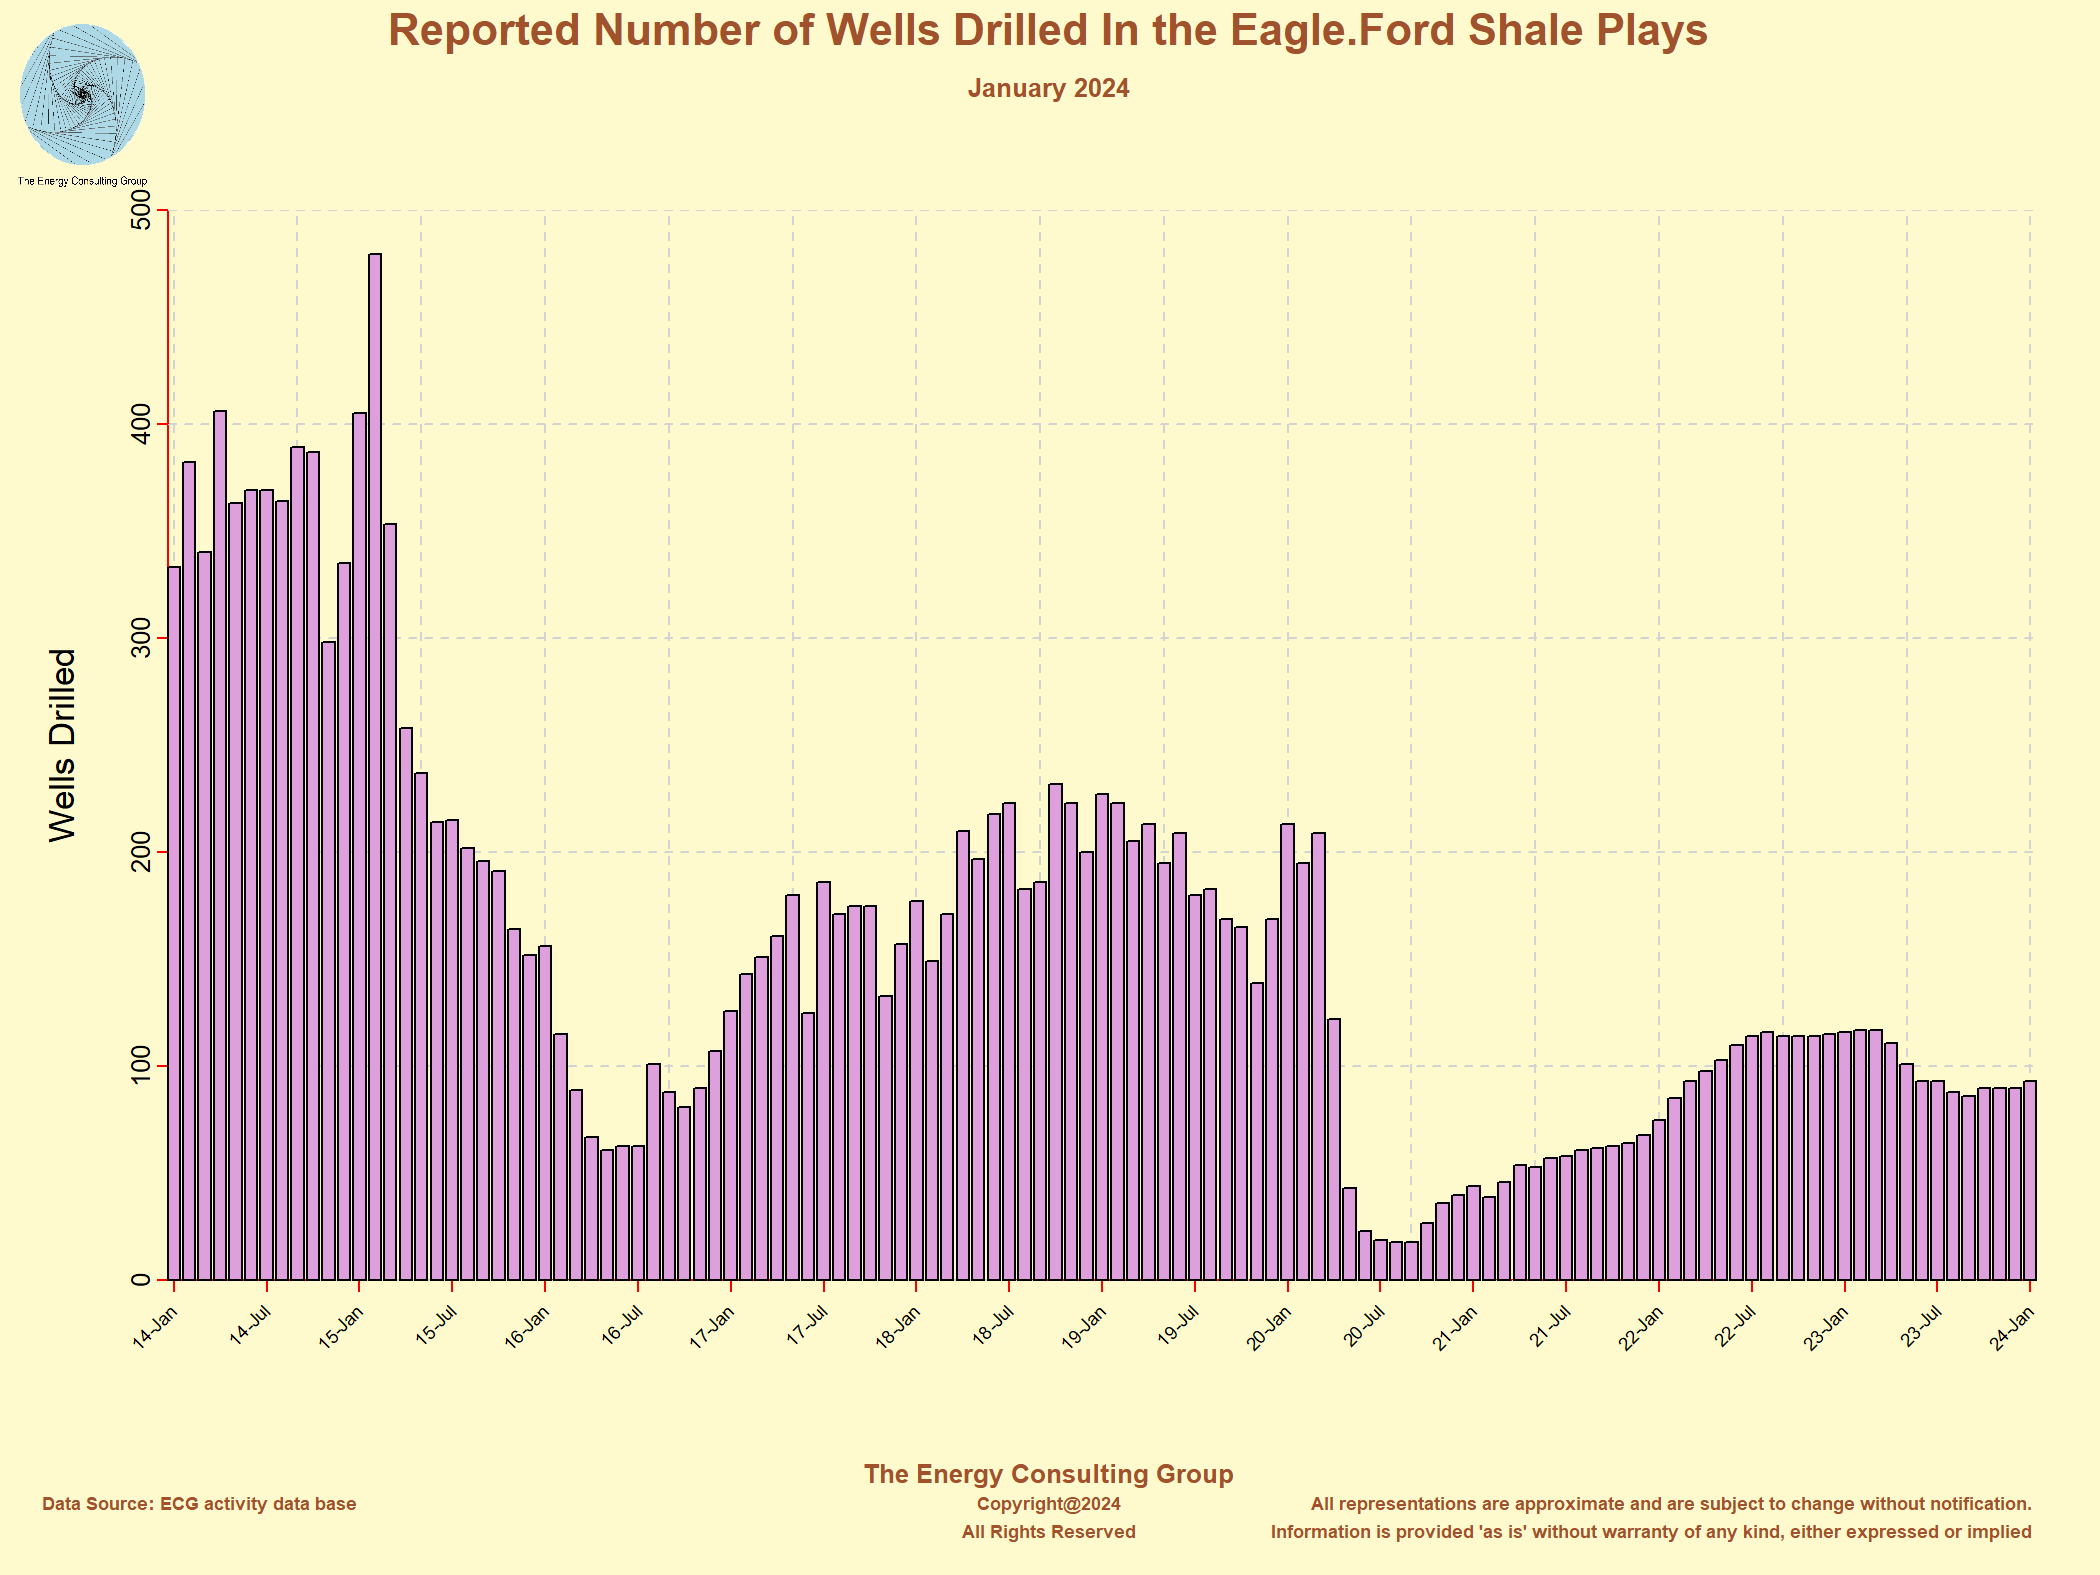
Monthly reported number of wells drilled in the main US light, tight
oil and shale gas plays.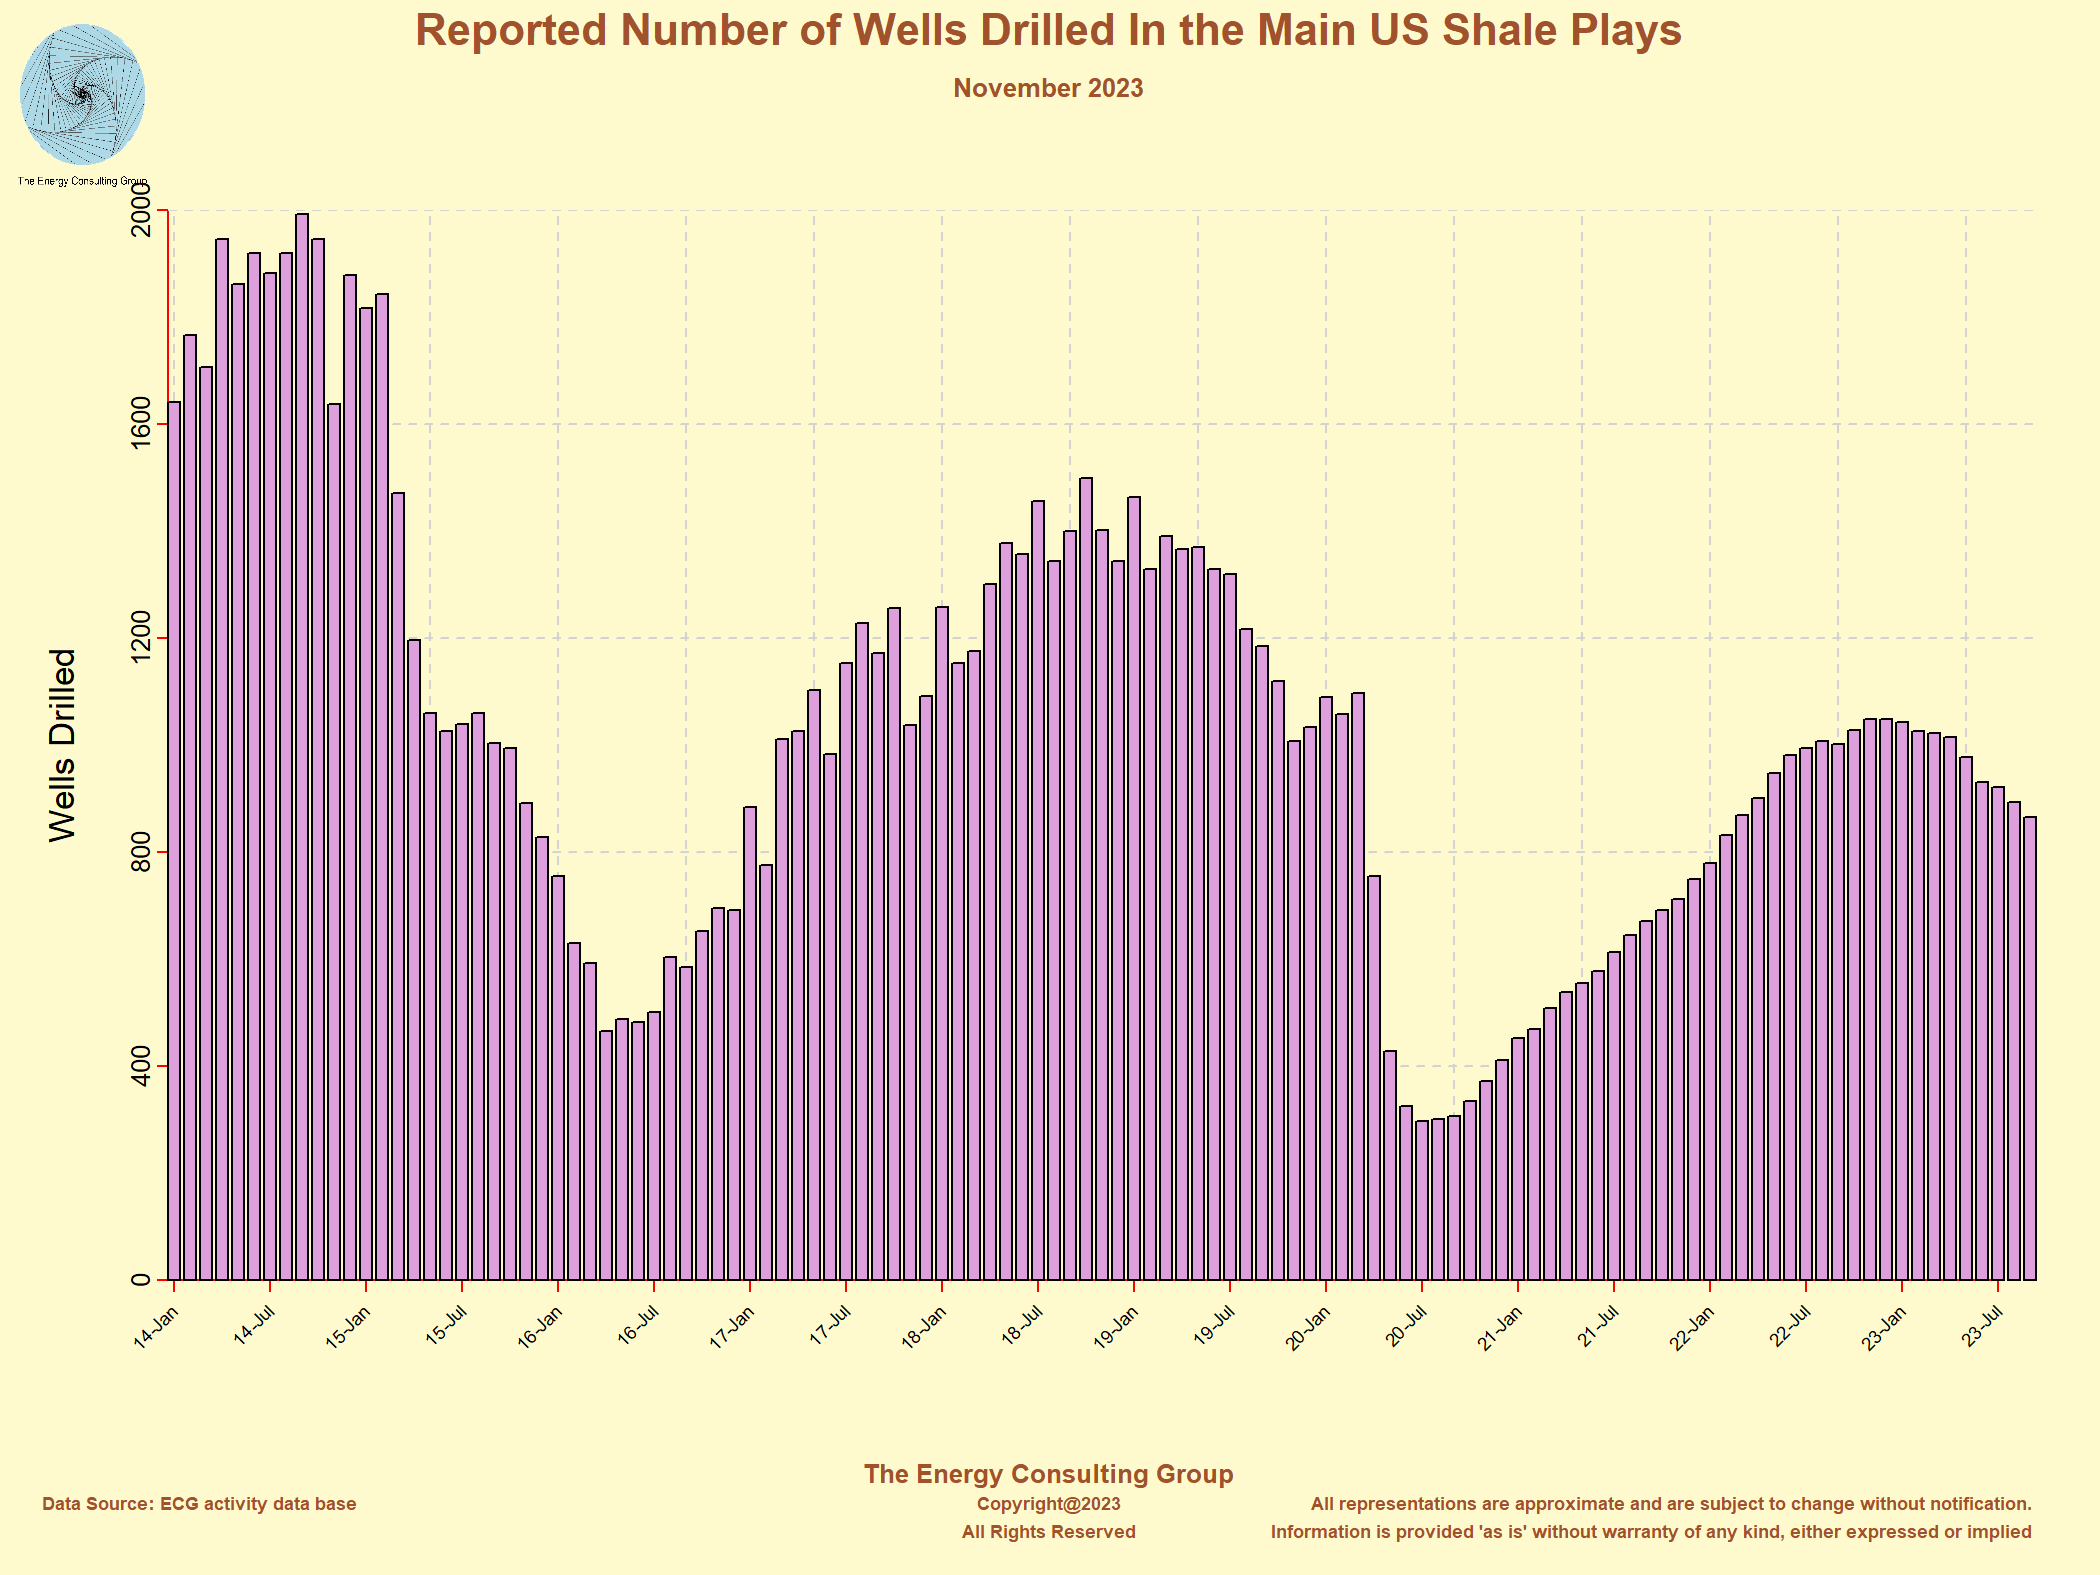 |
Monthly reported number of wells completed in the main US light,
tight oil and shale gas plays.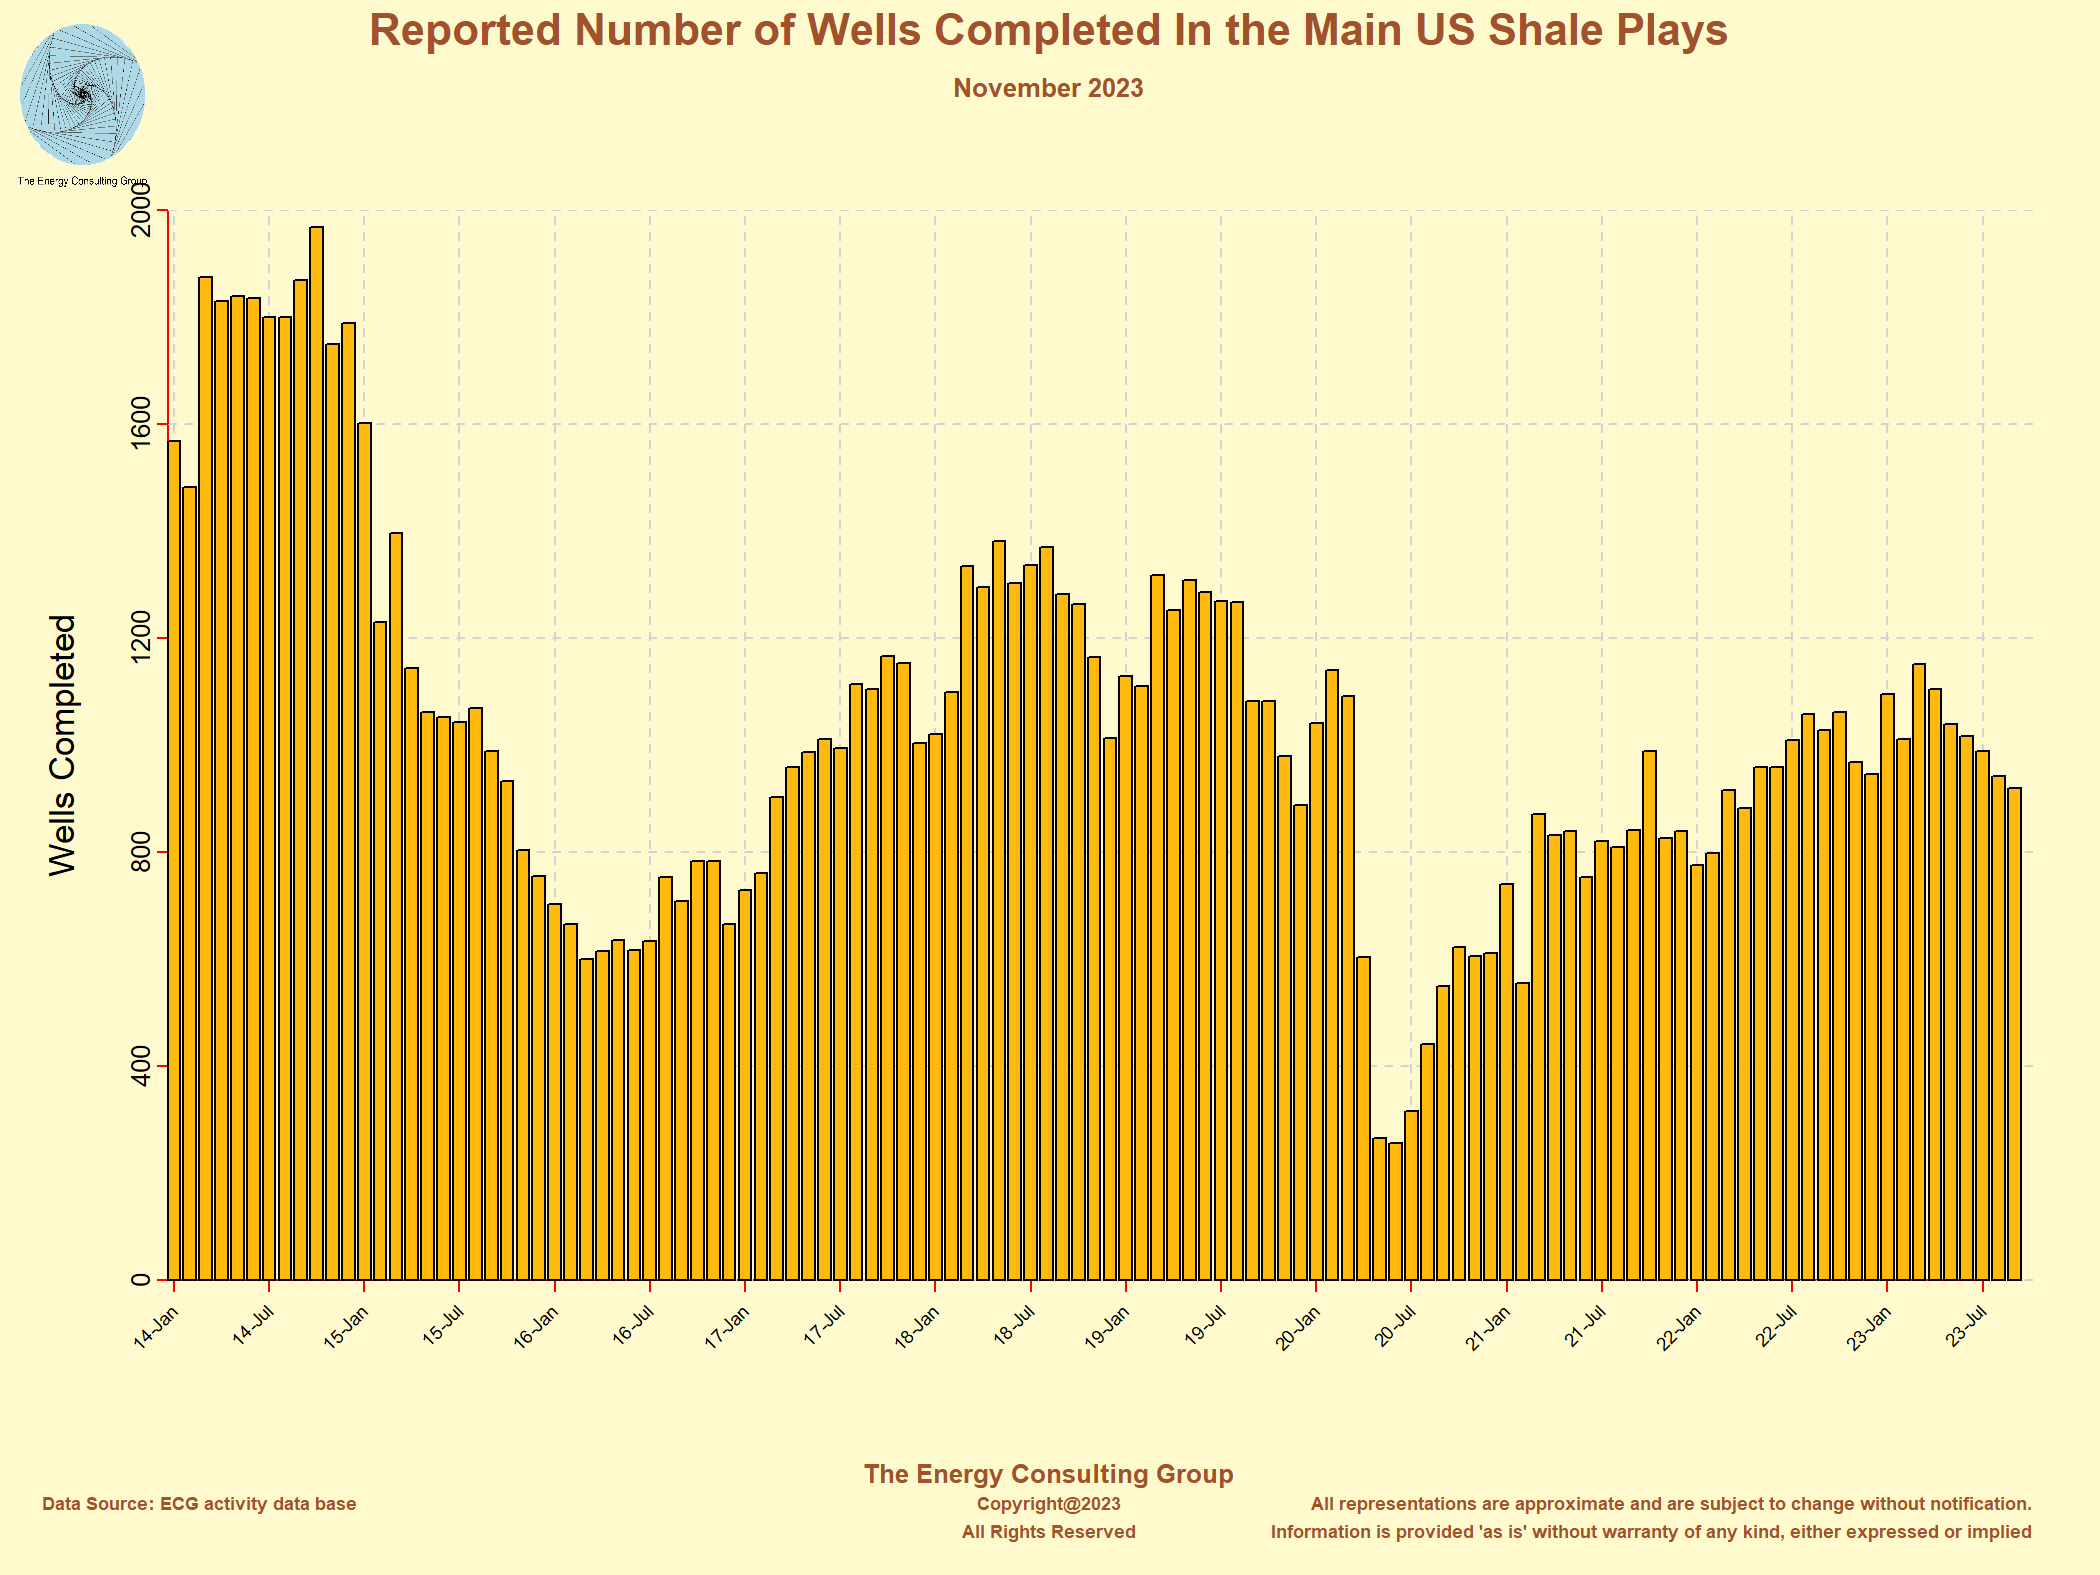 |
The monthly number of drilled, uncompleted wells (DUC) reported for
the main US light, tight oil and shale gas plays.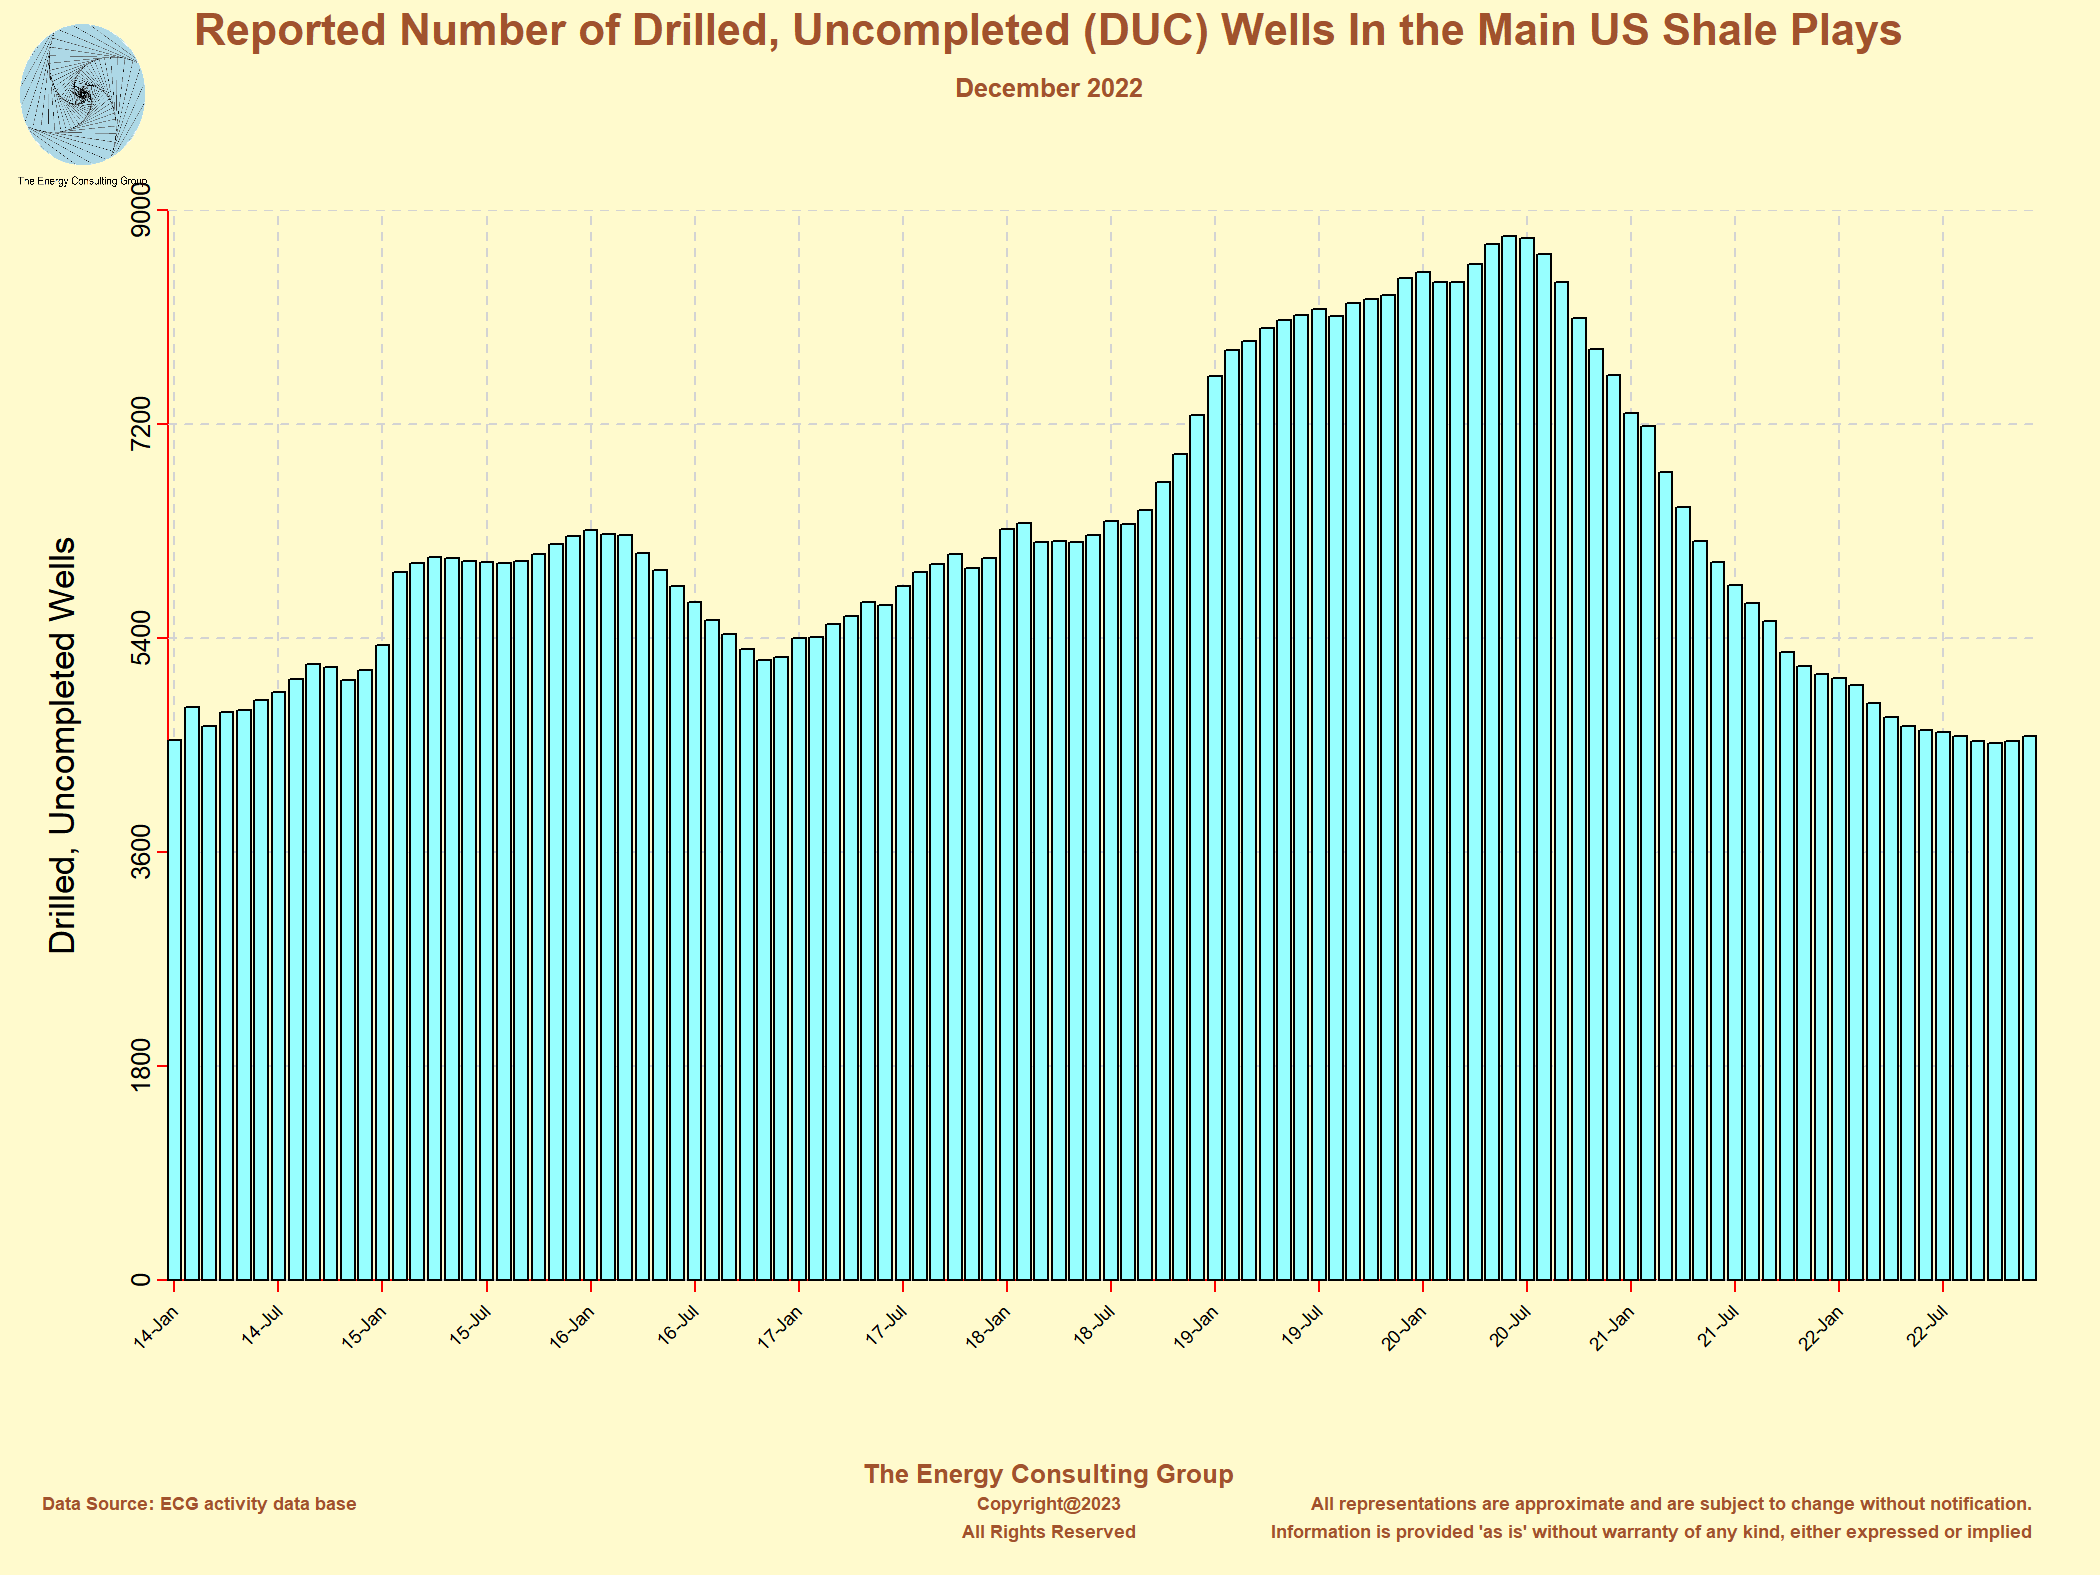 |
|
Approx. International Oil and Gas Drilling Rig
Activity (Excludes US and Canada)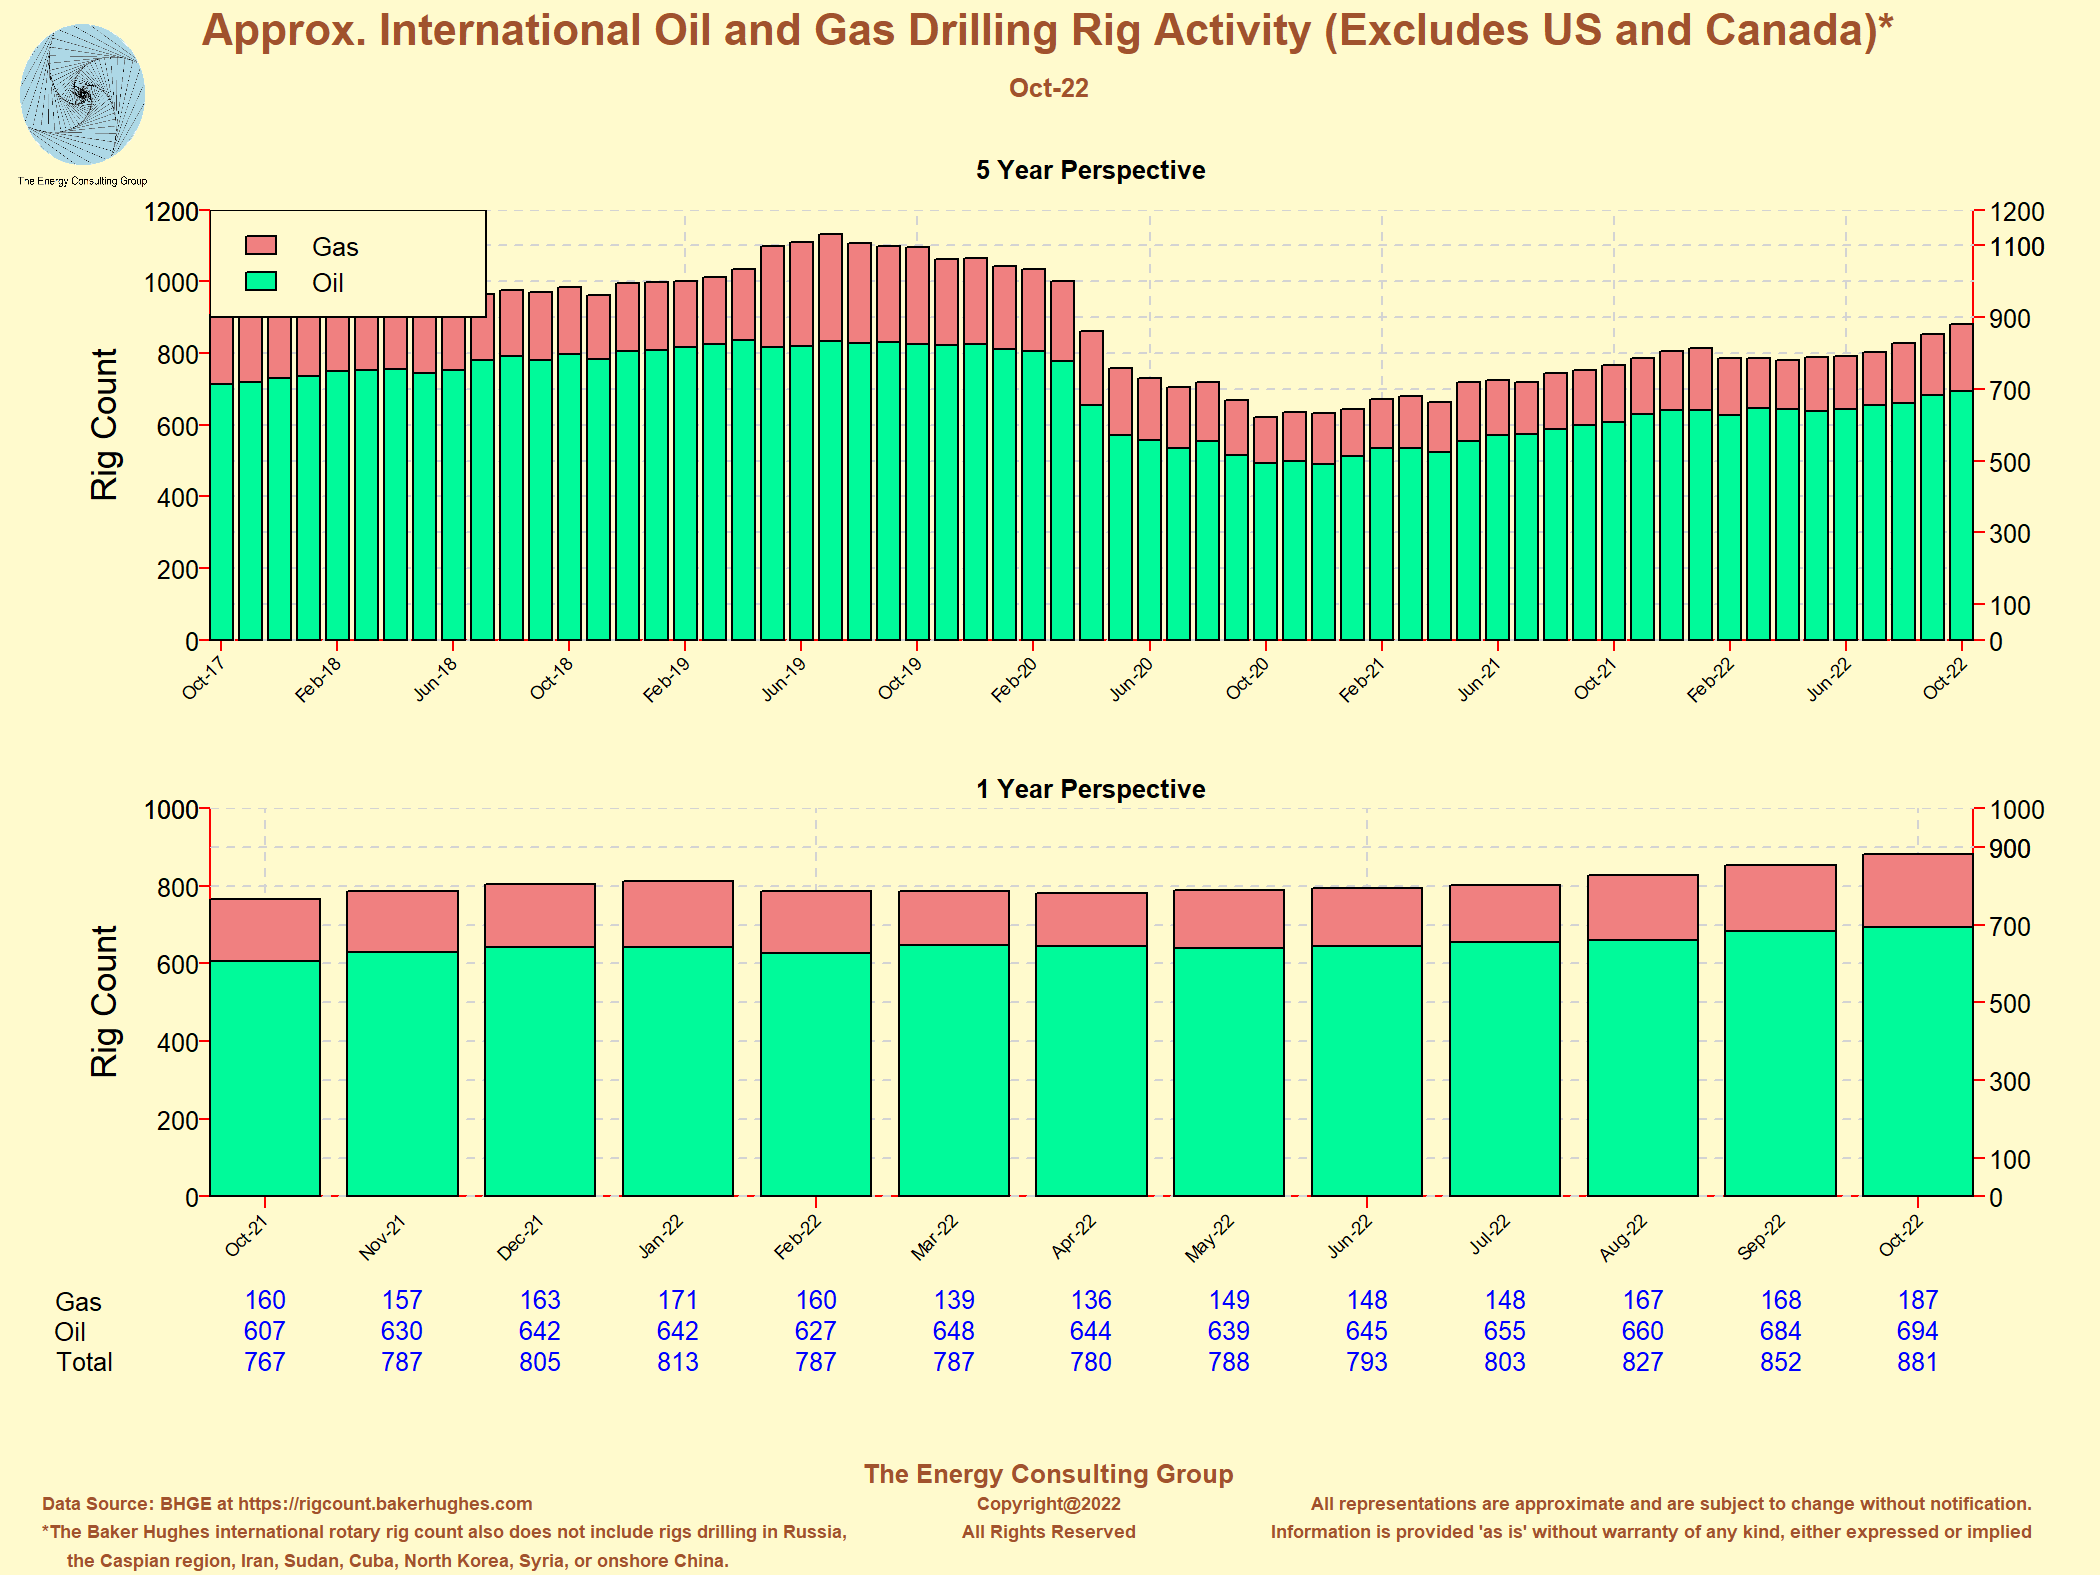 The Baker Hughes international rotary rig count also does not include rigs drilling in Russia, the Caspian region, Iran, Sudan, Cuba, North Korea, Syria, or onshore China. |
|
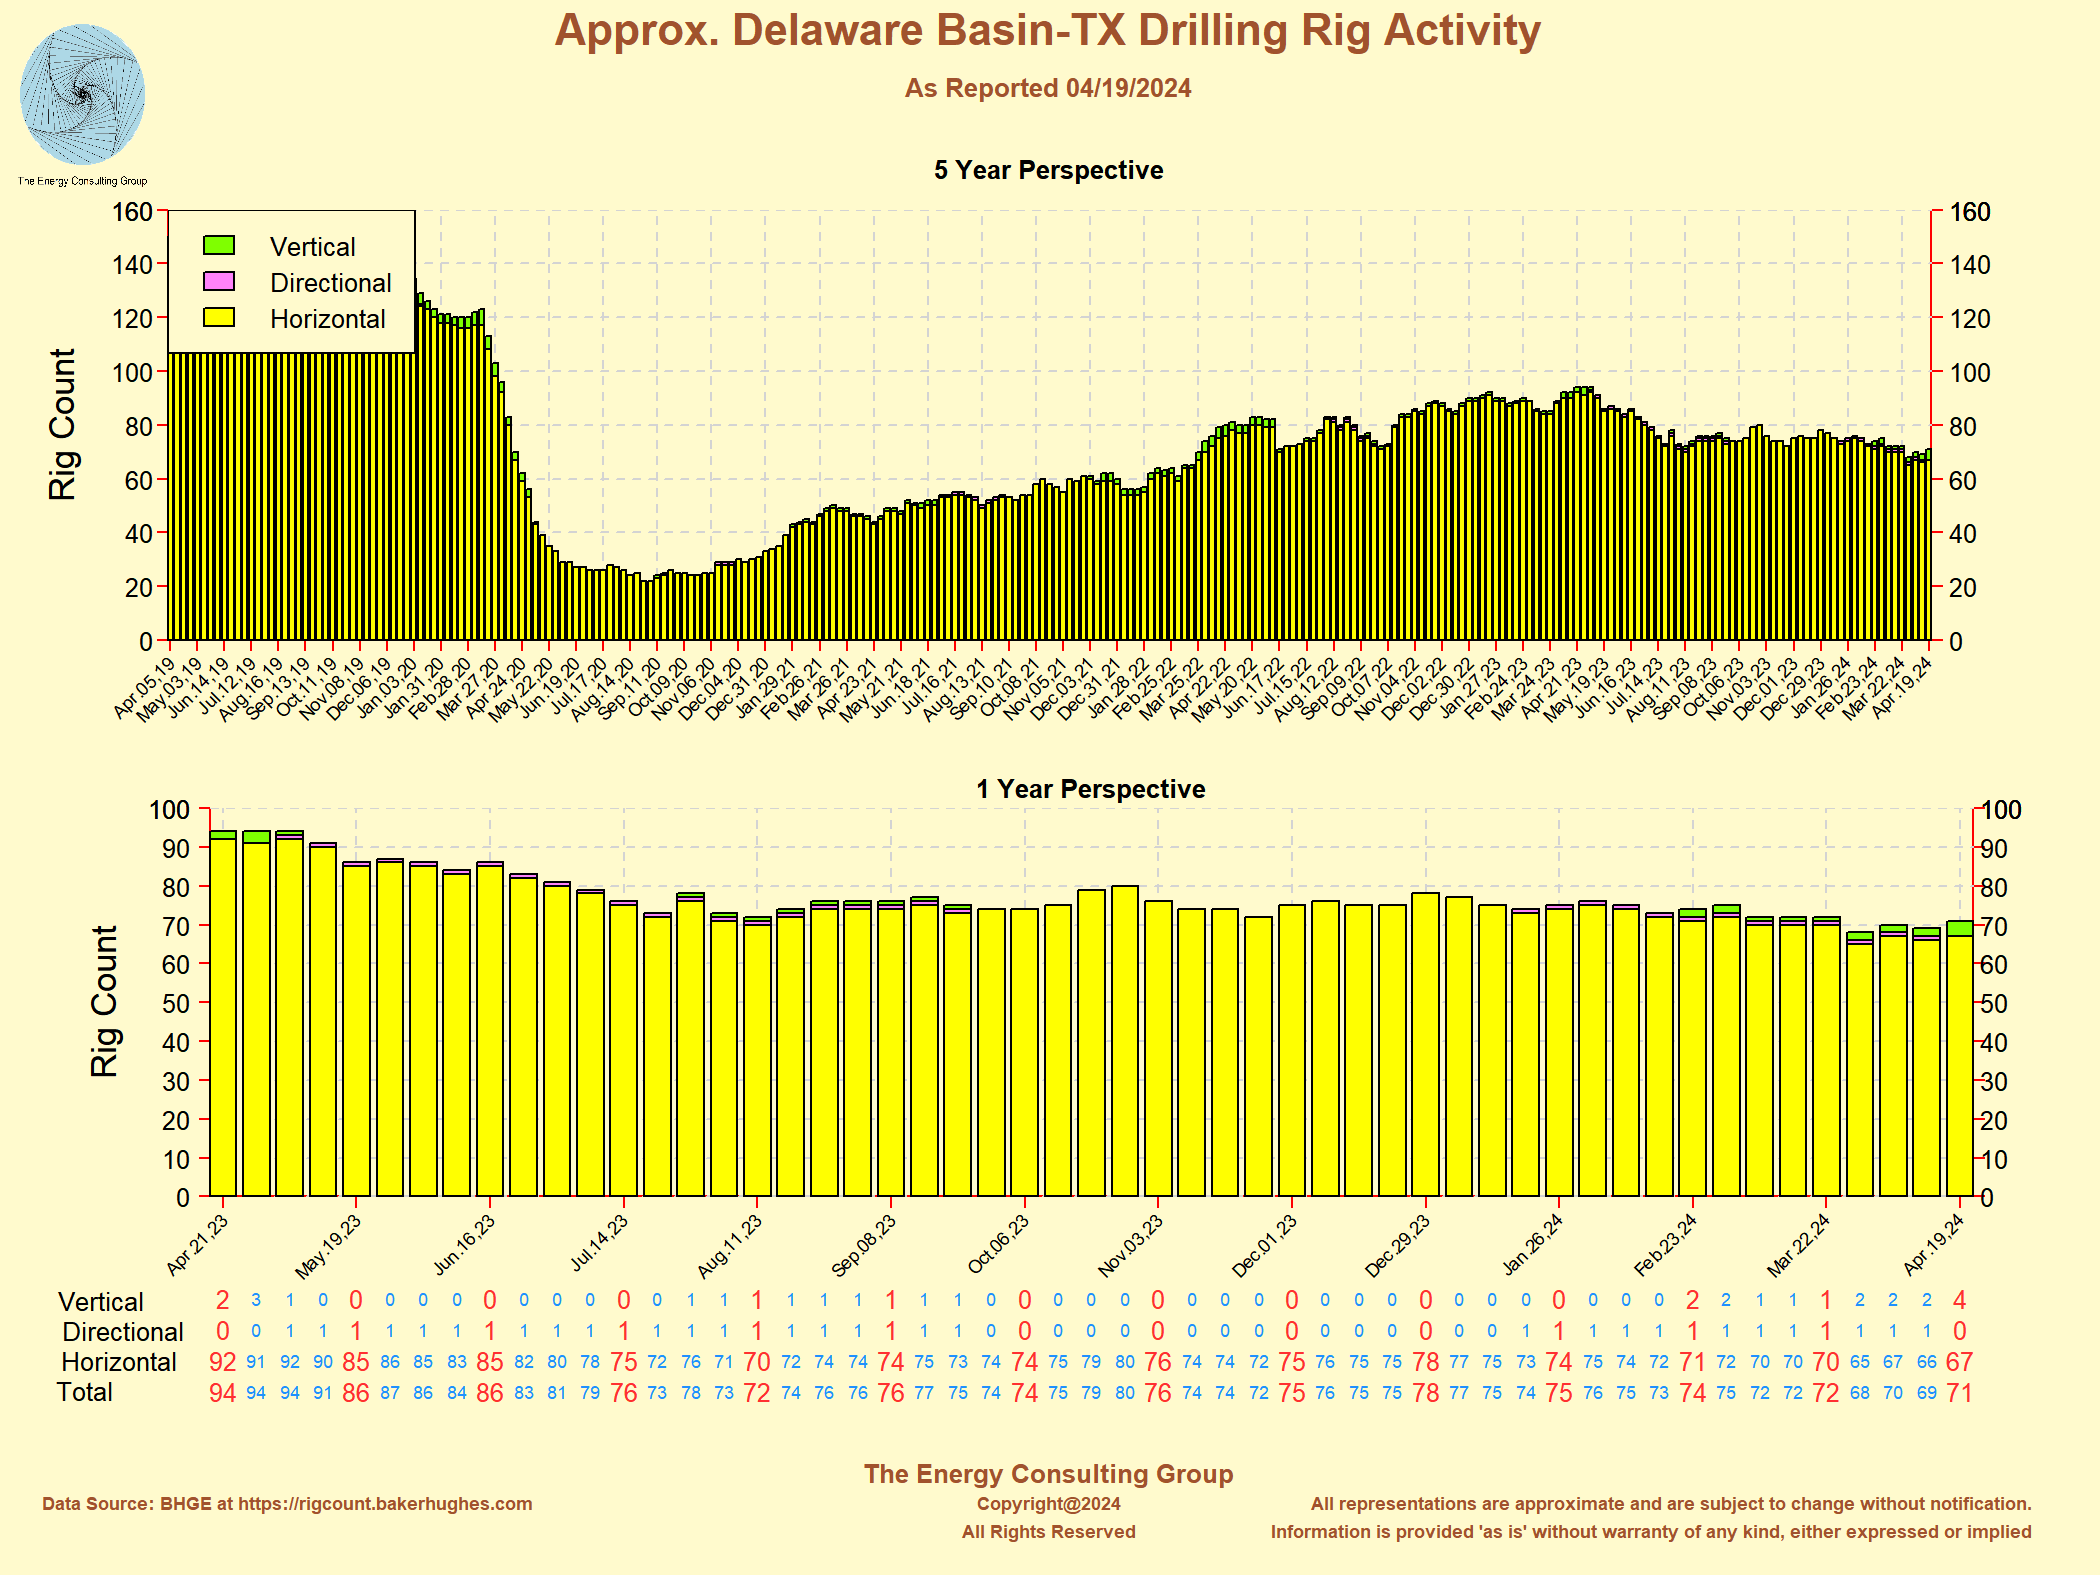
| Approximate Texas Oil and Gas Drilling Rig
Activity Horizontal-Directional-Vertical Segmentation  Click on the image for full size, higher resolution version. |
Approximate Texas Oil and Gas Drilling Rig
Activity Oil-Gas Segmentation 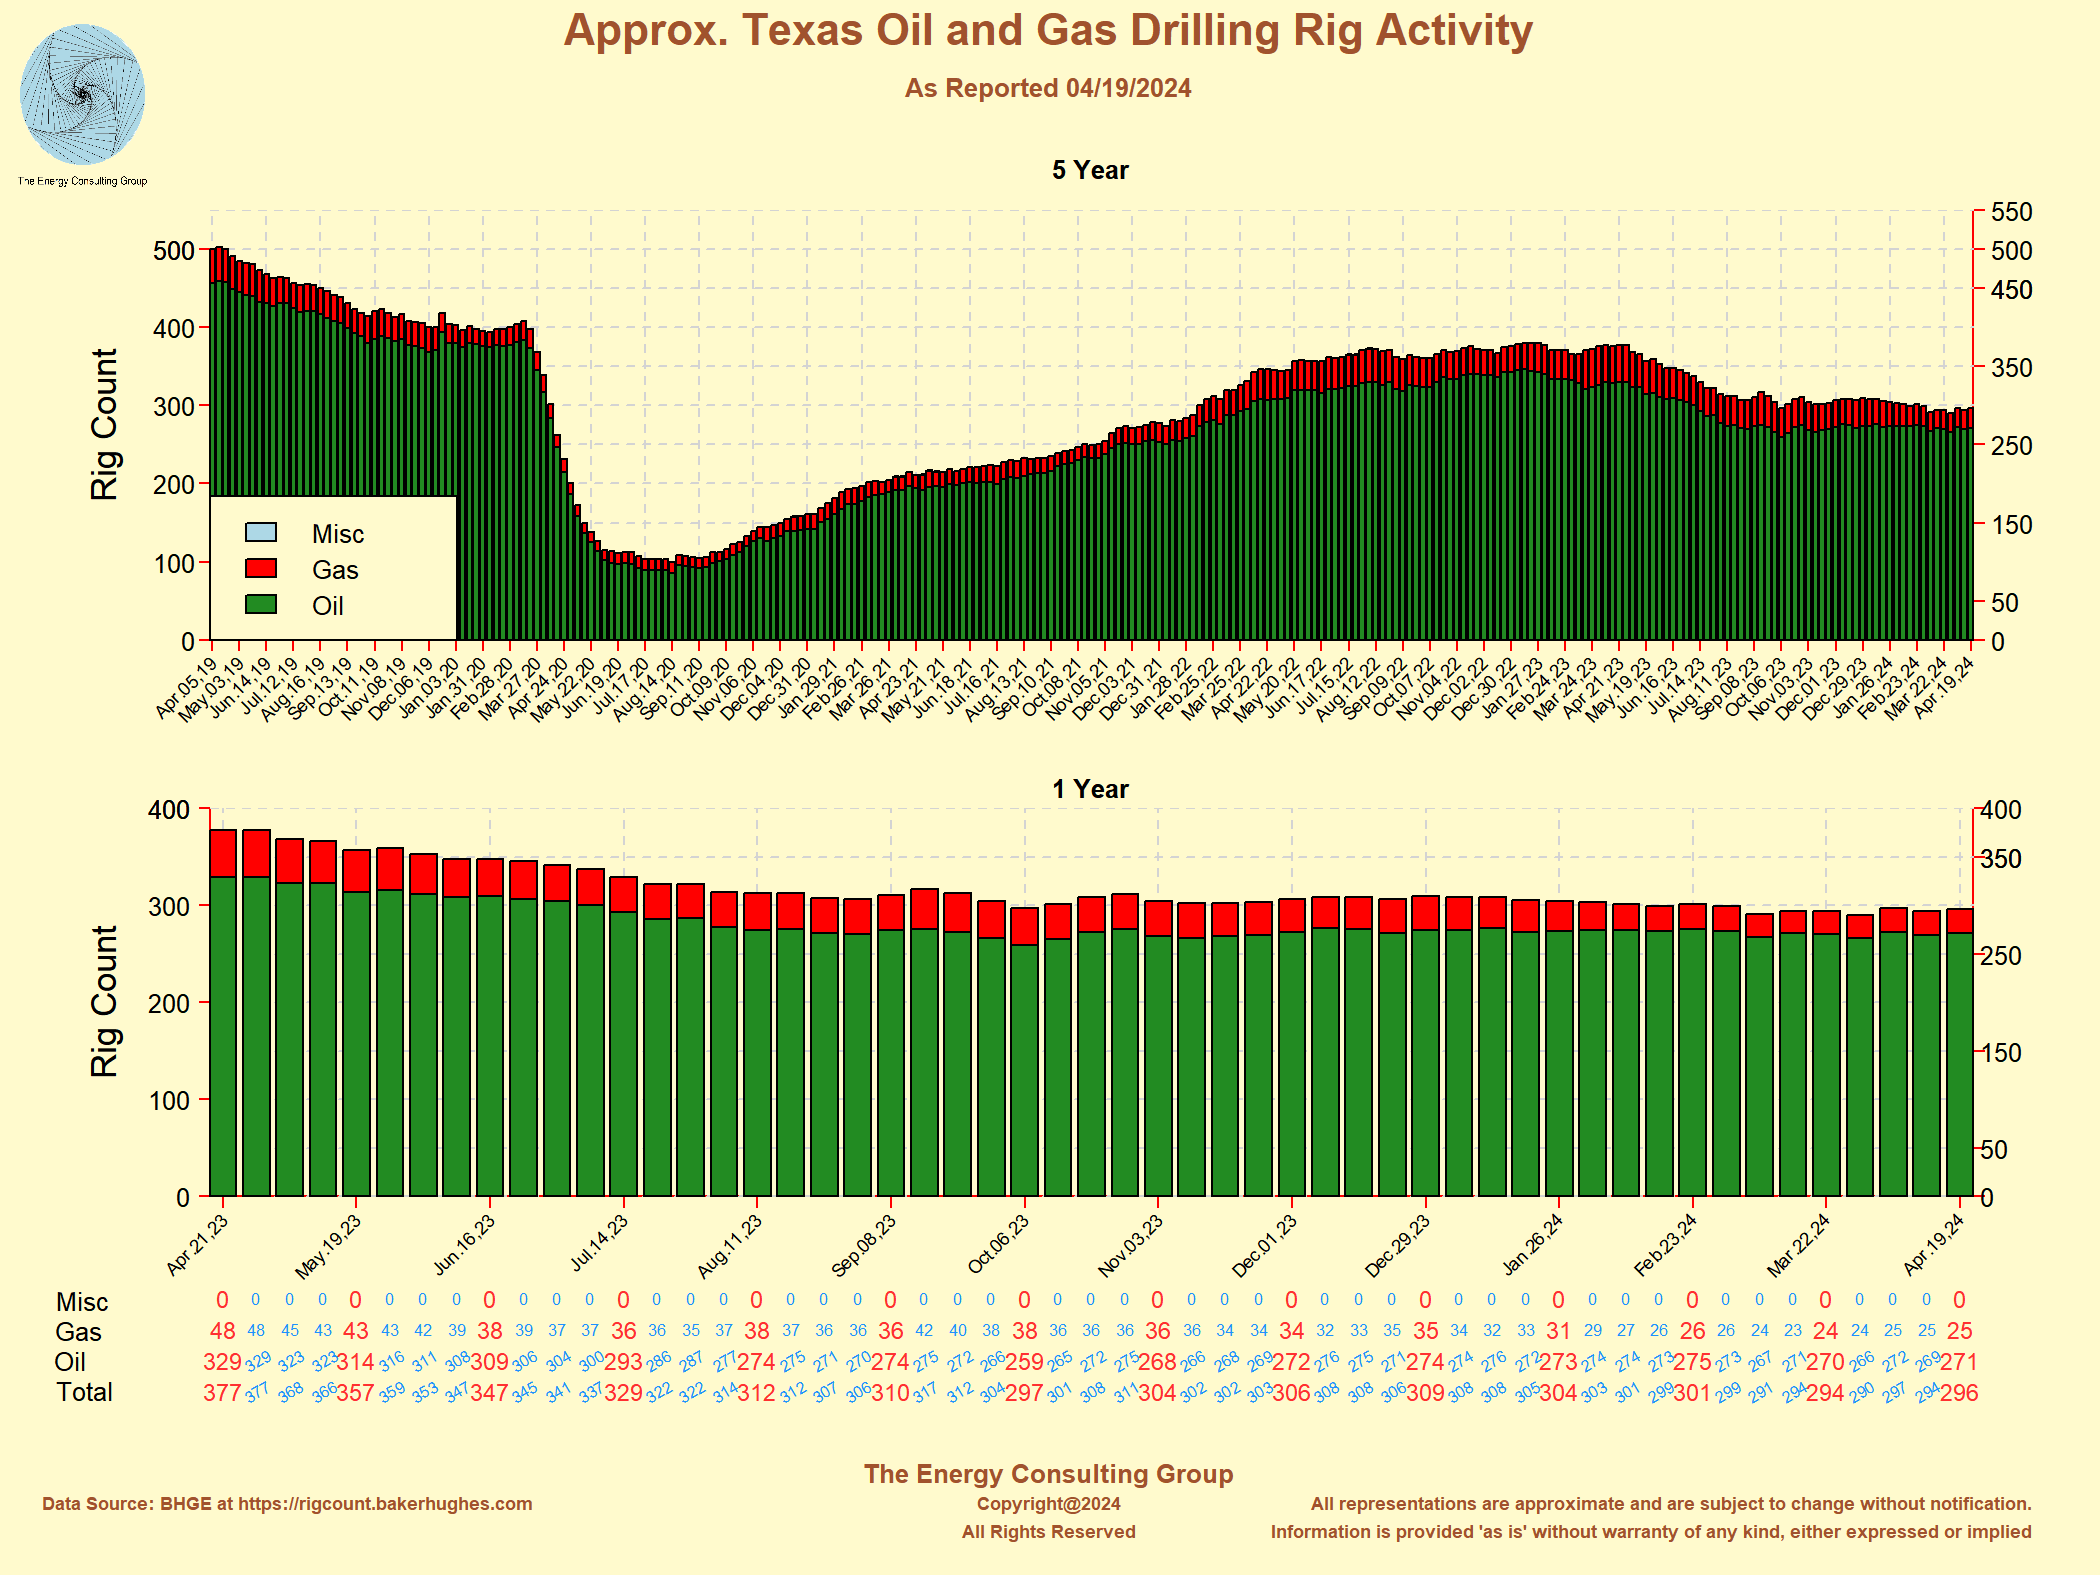 Click on the image for full size, higher resolution version. |
Oil and Gas Drilling Rig Activity Map - Texas Click on the image for full size, higher resolution version. |
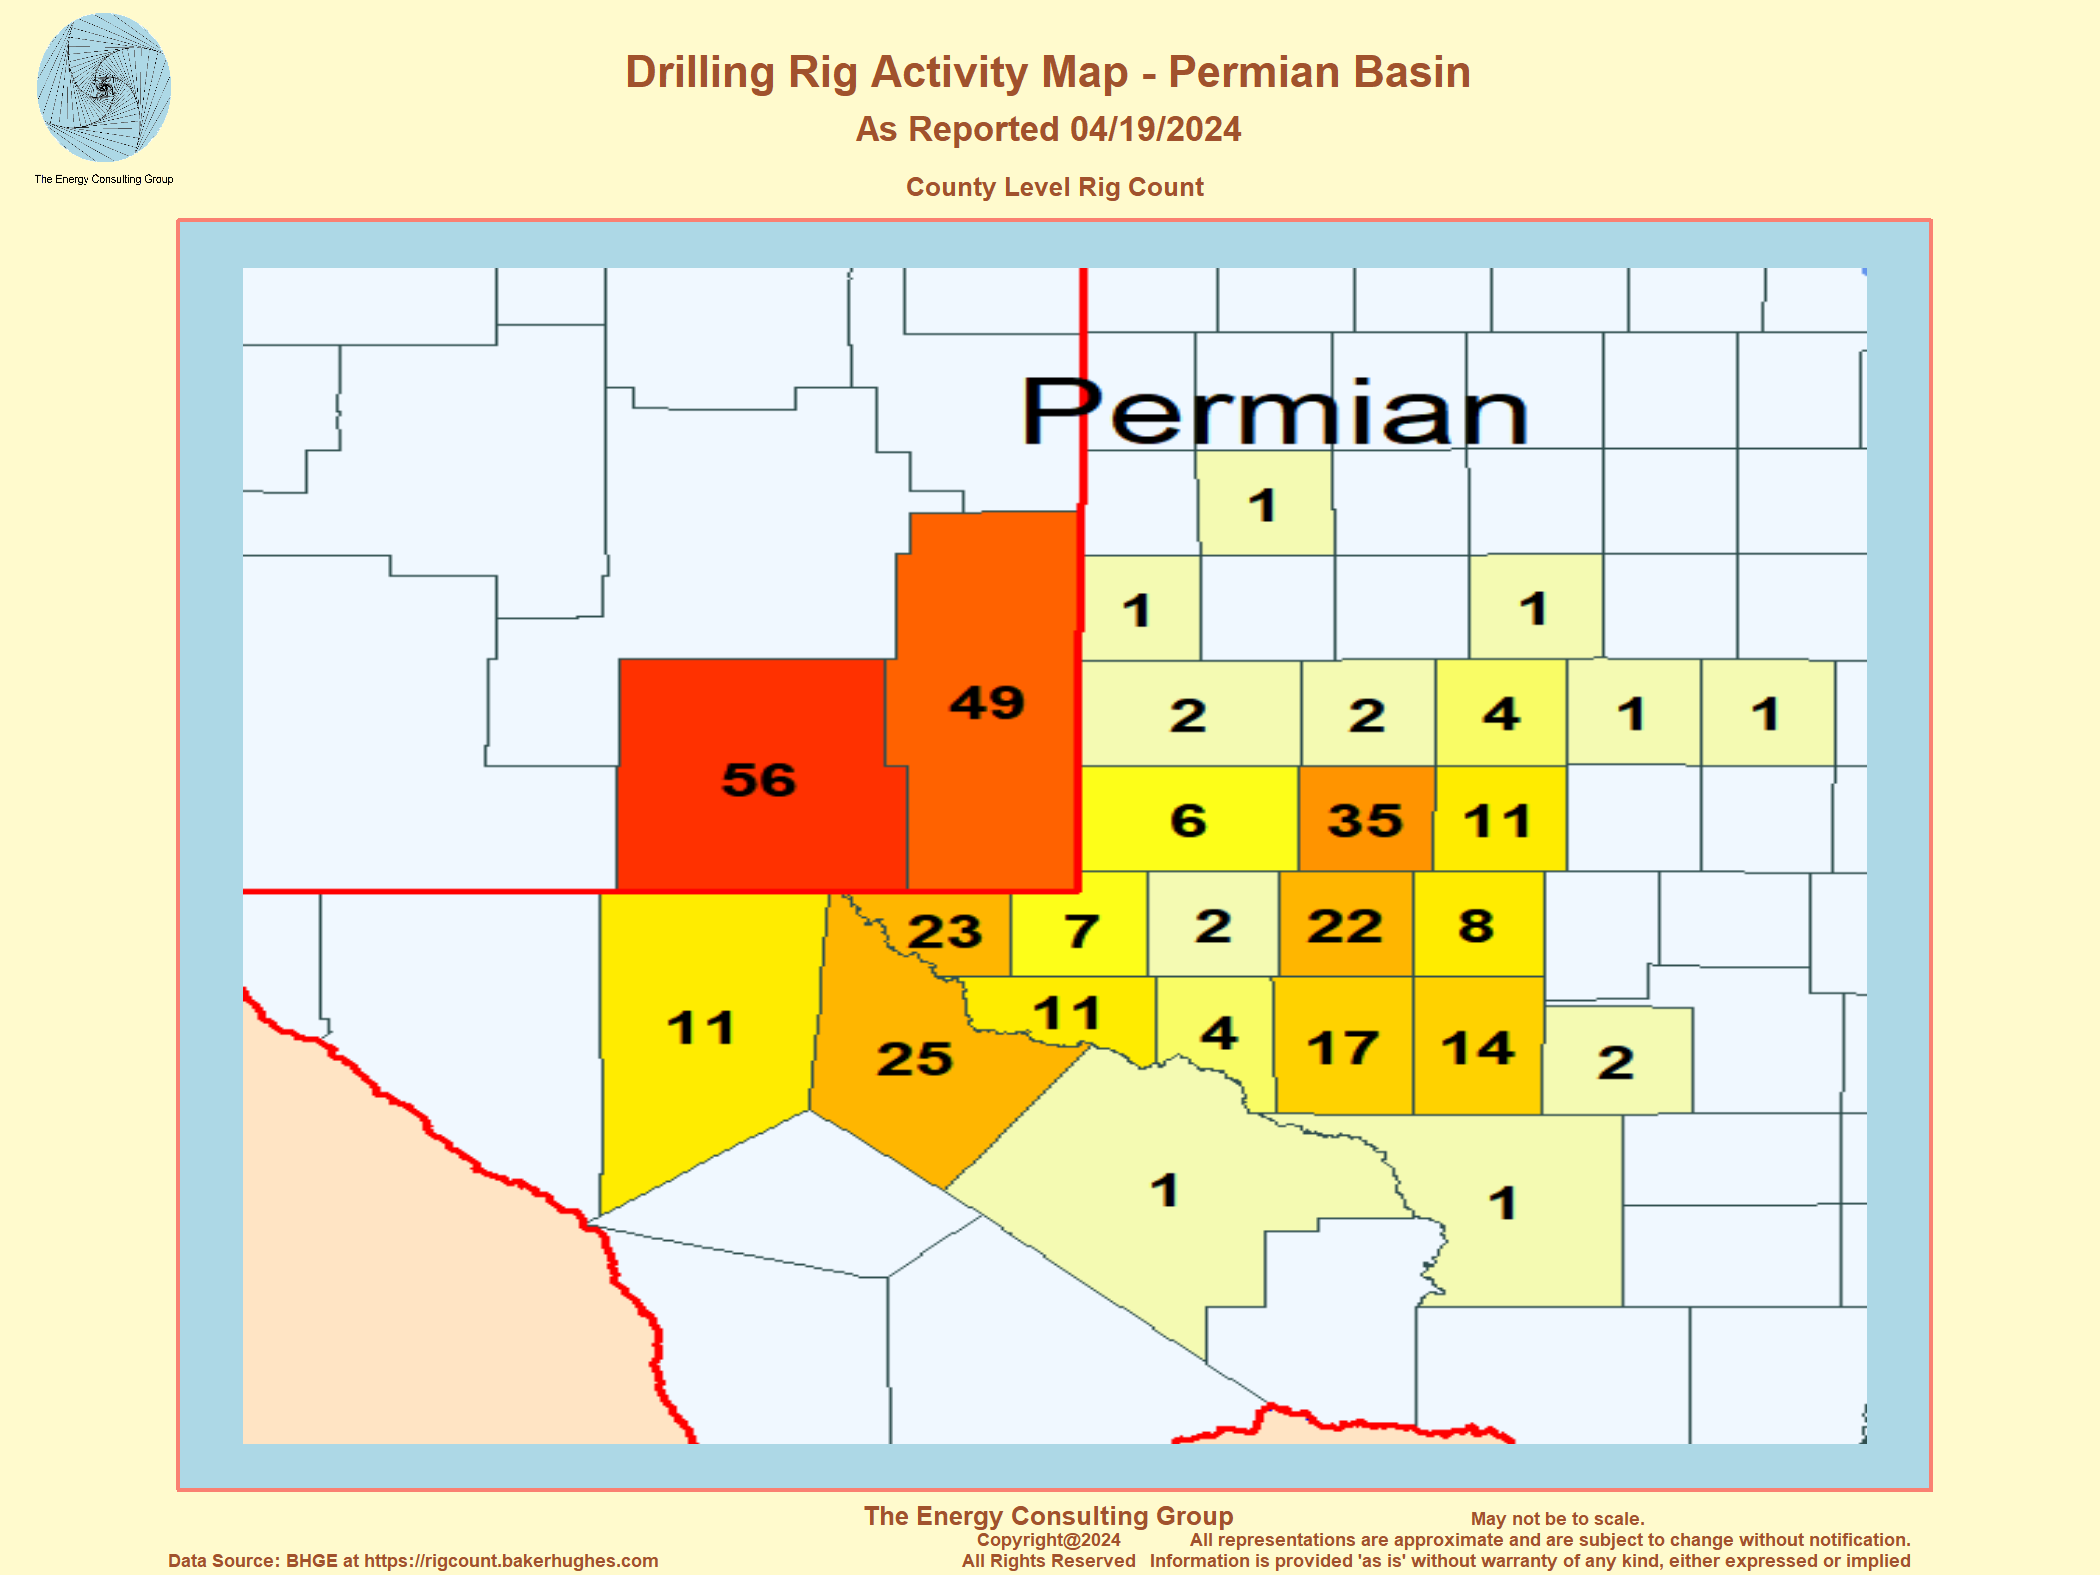
Oil and Gas Drilling Rig Activity Map - Permian Basin Click on the image for full size, higher resolution version. |
Oil and Gas Drilling Rig Activity Map -
Haynesville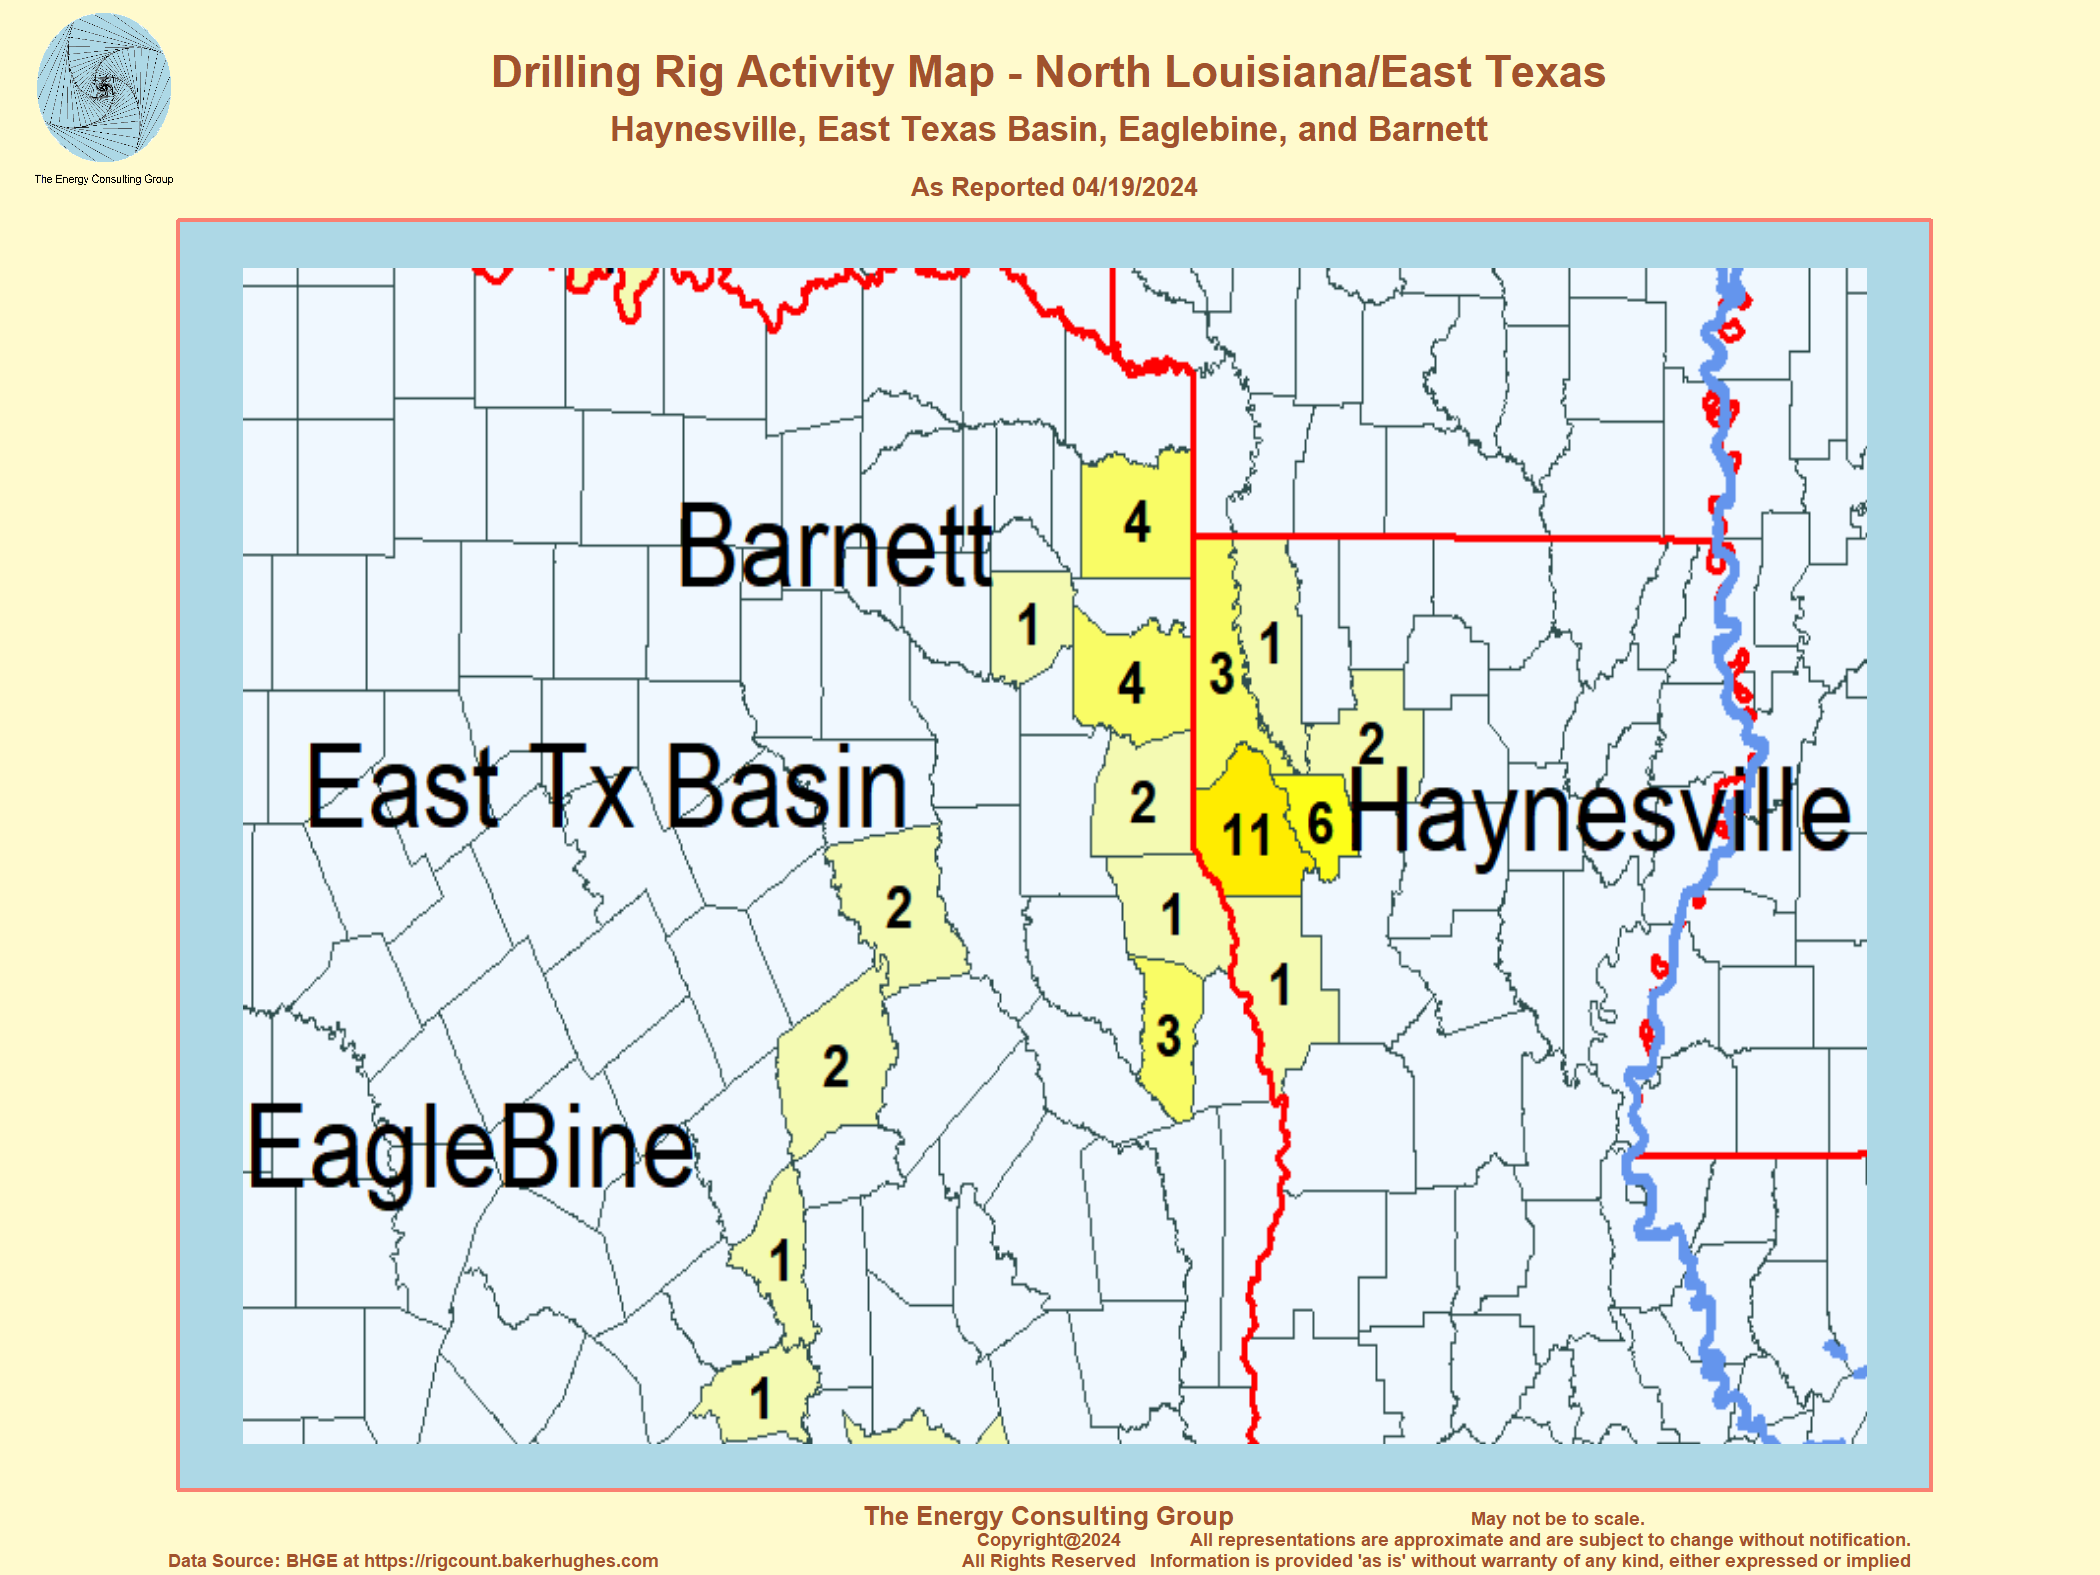 Click on the image for full size, higher resolution version. |
Oil and Gas Drilling Rig Activity Map -
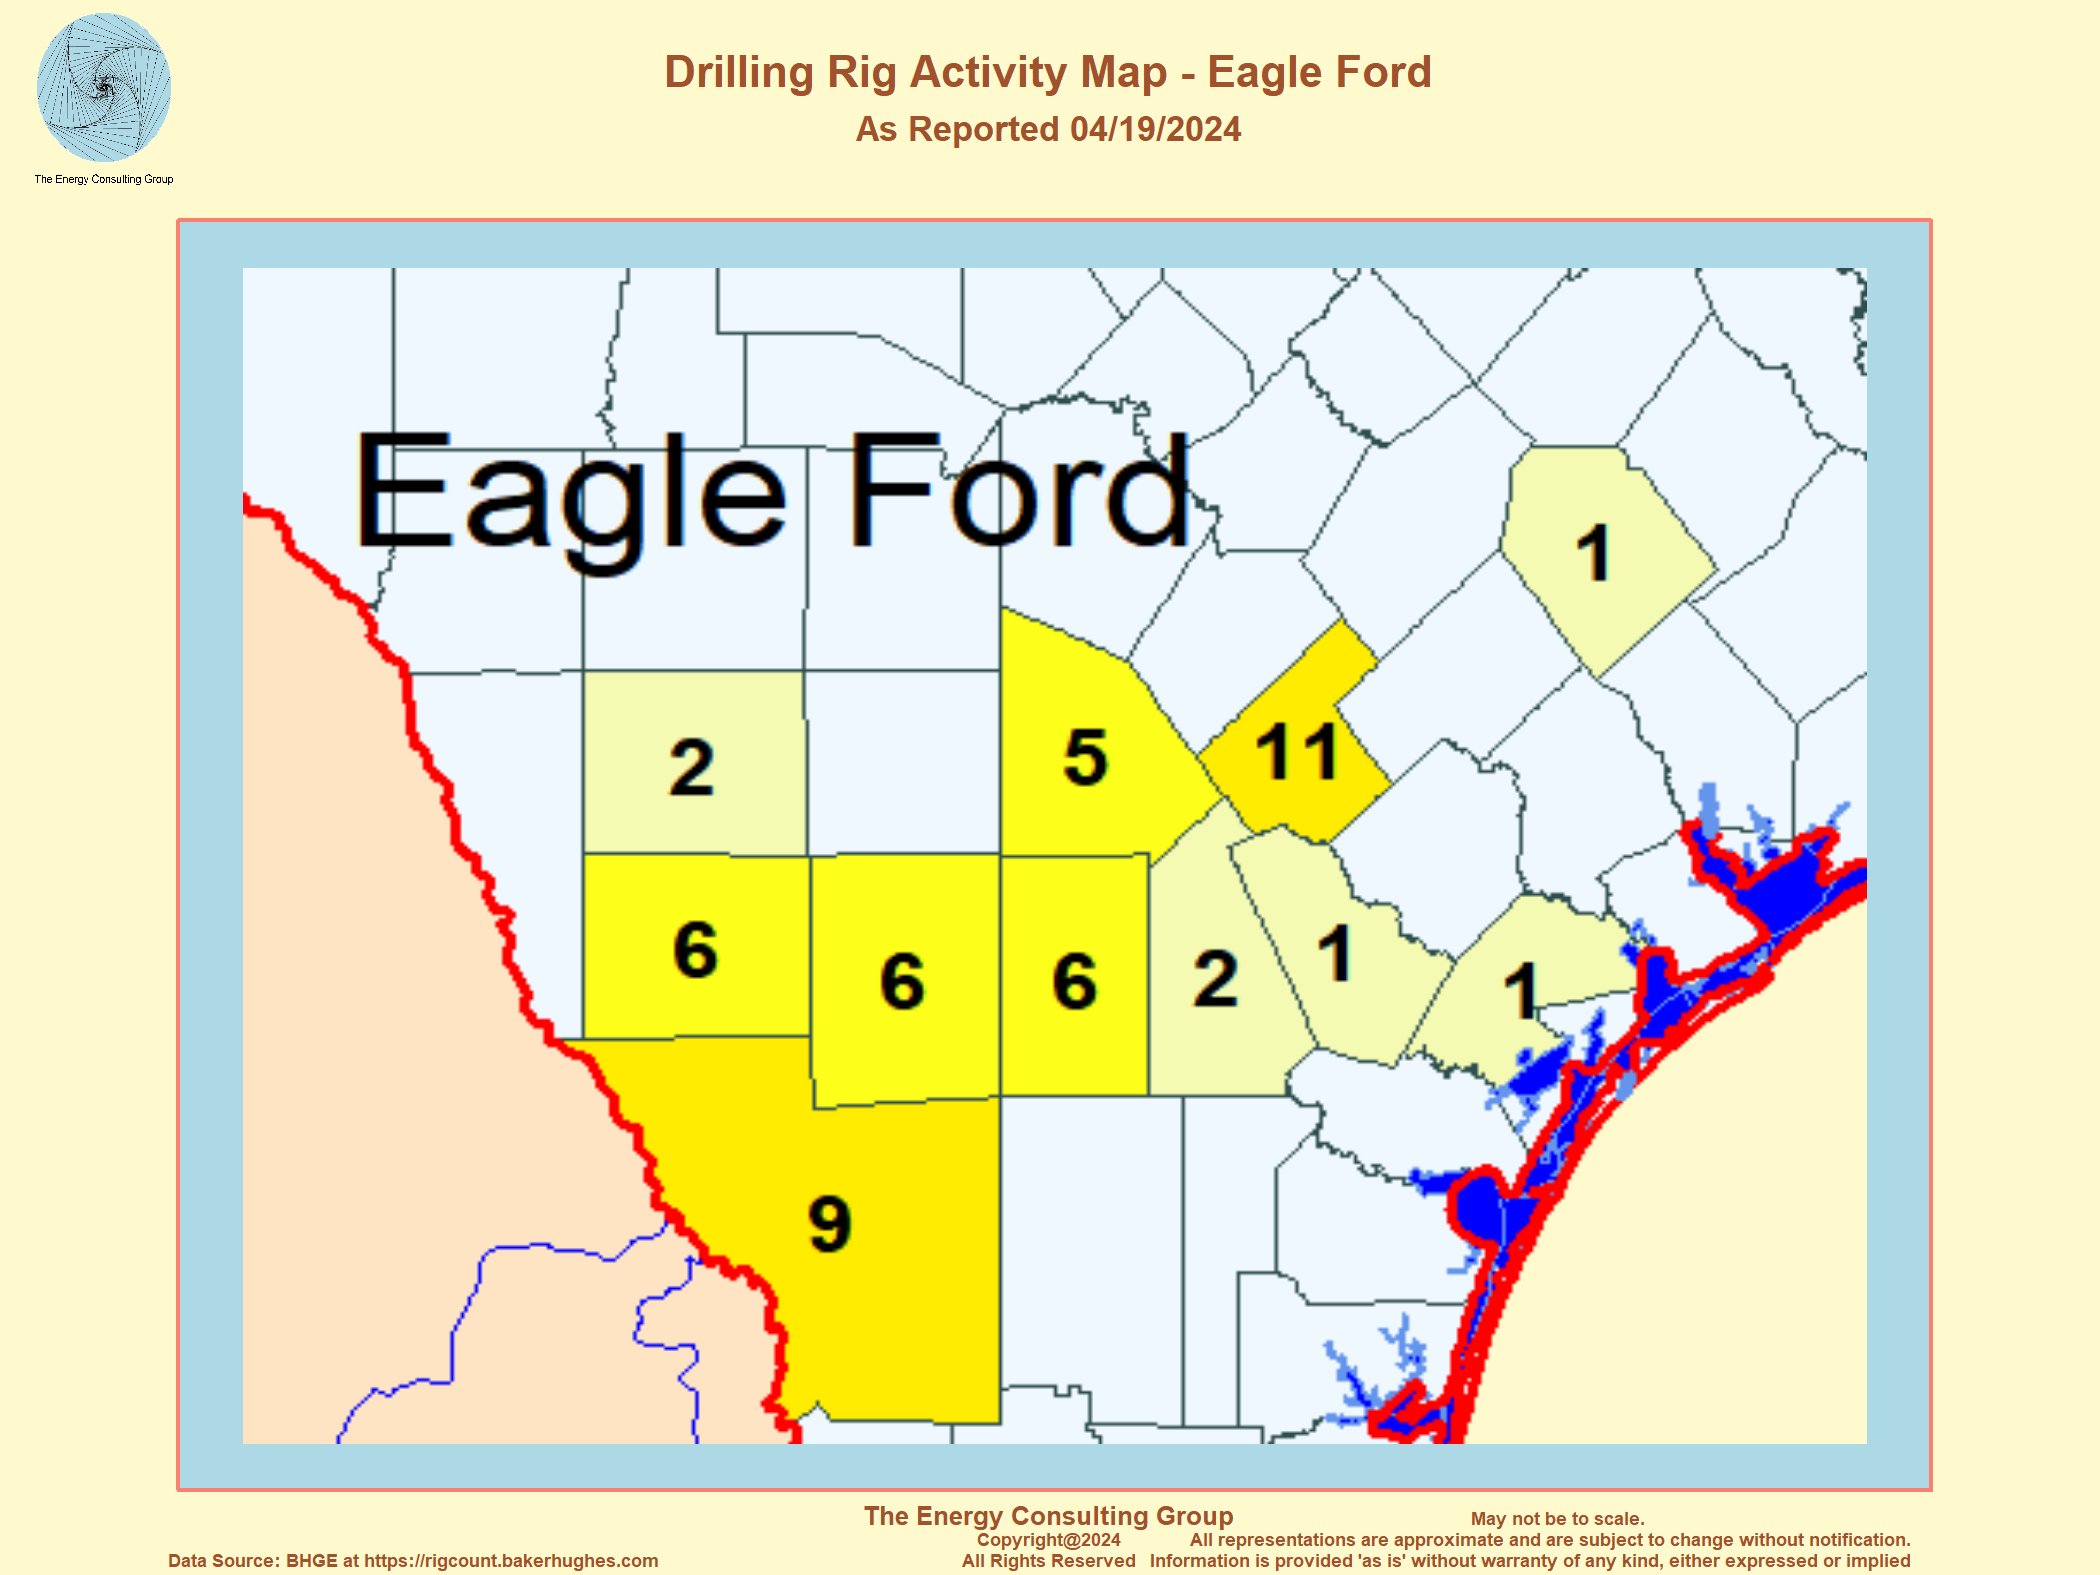
Texas:Eagle Ford Click on the image for full size, higher resolution version. |
Estimating Average Oil and Gas Drilling Rig Productivity
Over Time for a Prominent Tight Oil Play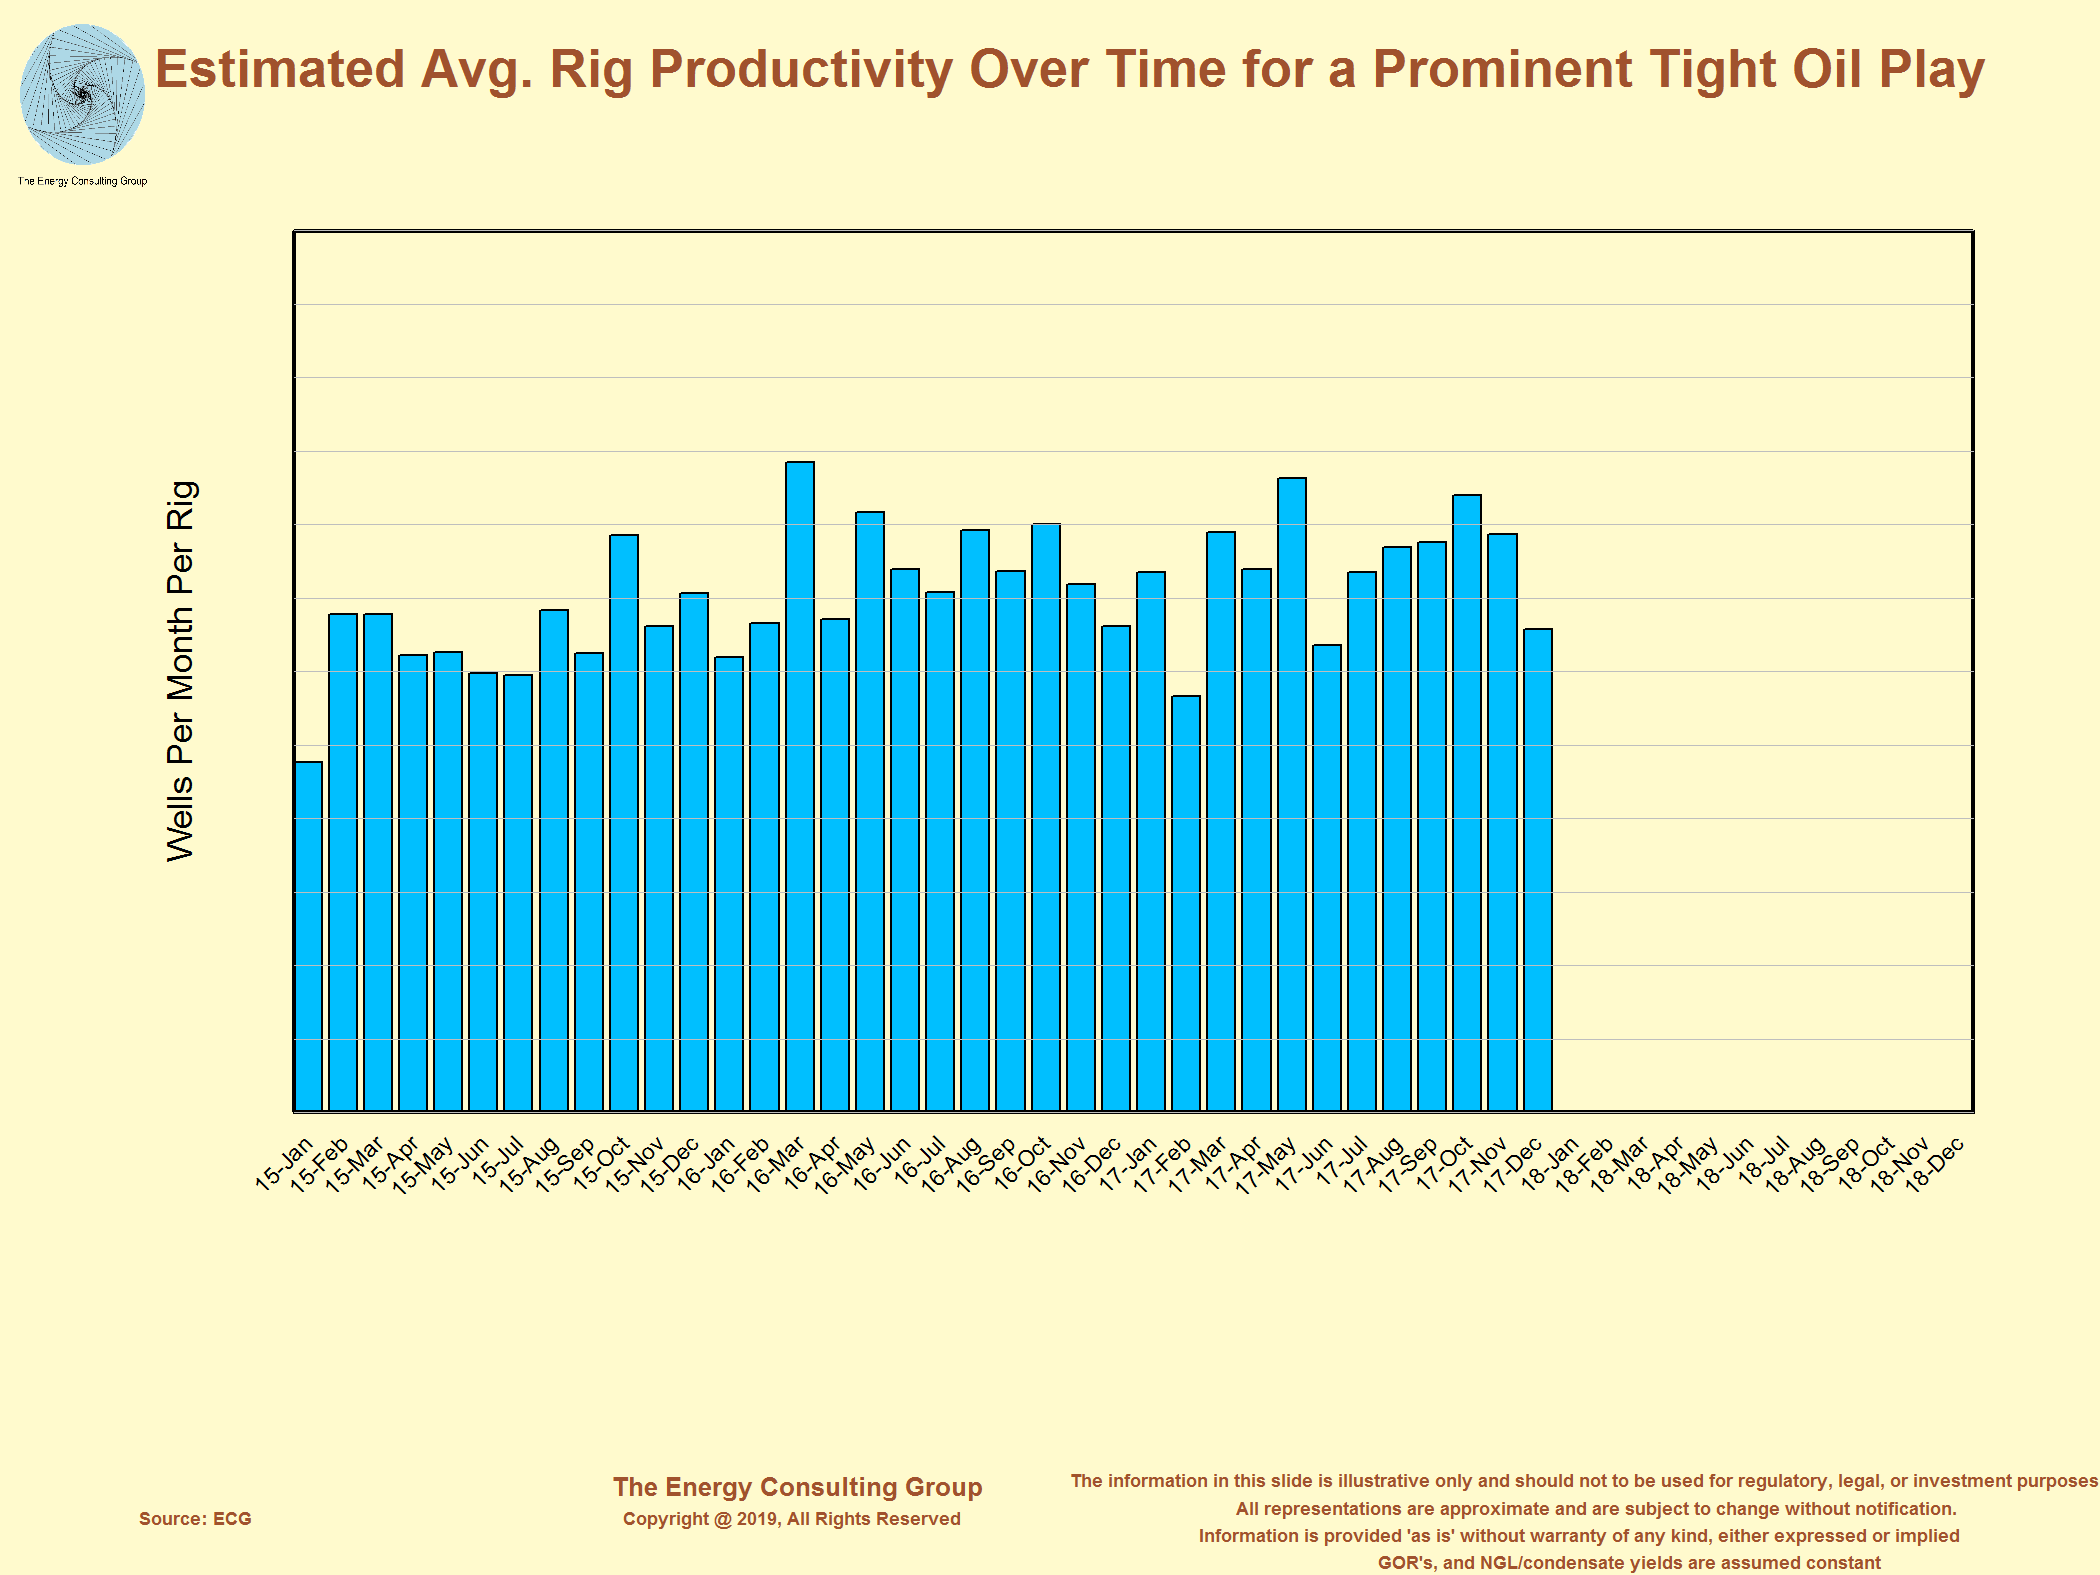 Click on the image for higher resolution version. We have rig productivity numbers for the primary tight oil and shale gas plays in the US and Canada. We have productivity on a Wells Per Month Per Rig basis, as well as, Average Footage Drilled per Rig per Month, and Average New Well Production per Rig Per Month. |
Improving Economic Robustness of Shale
Plays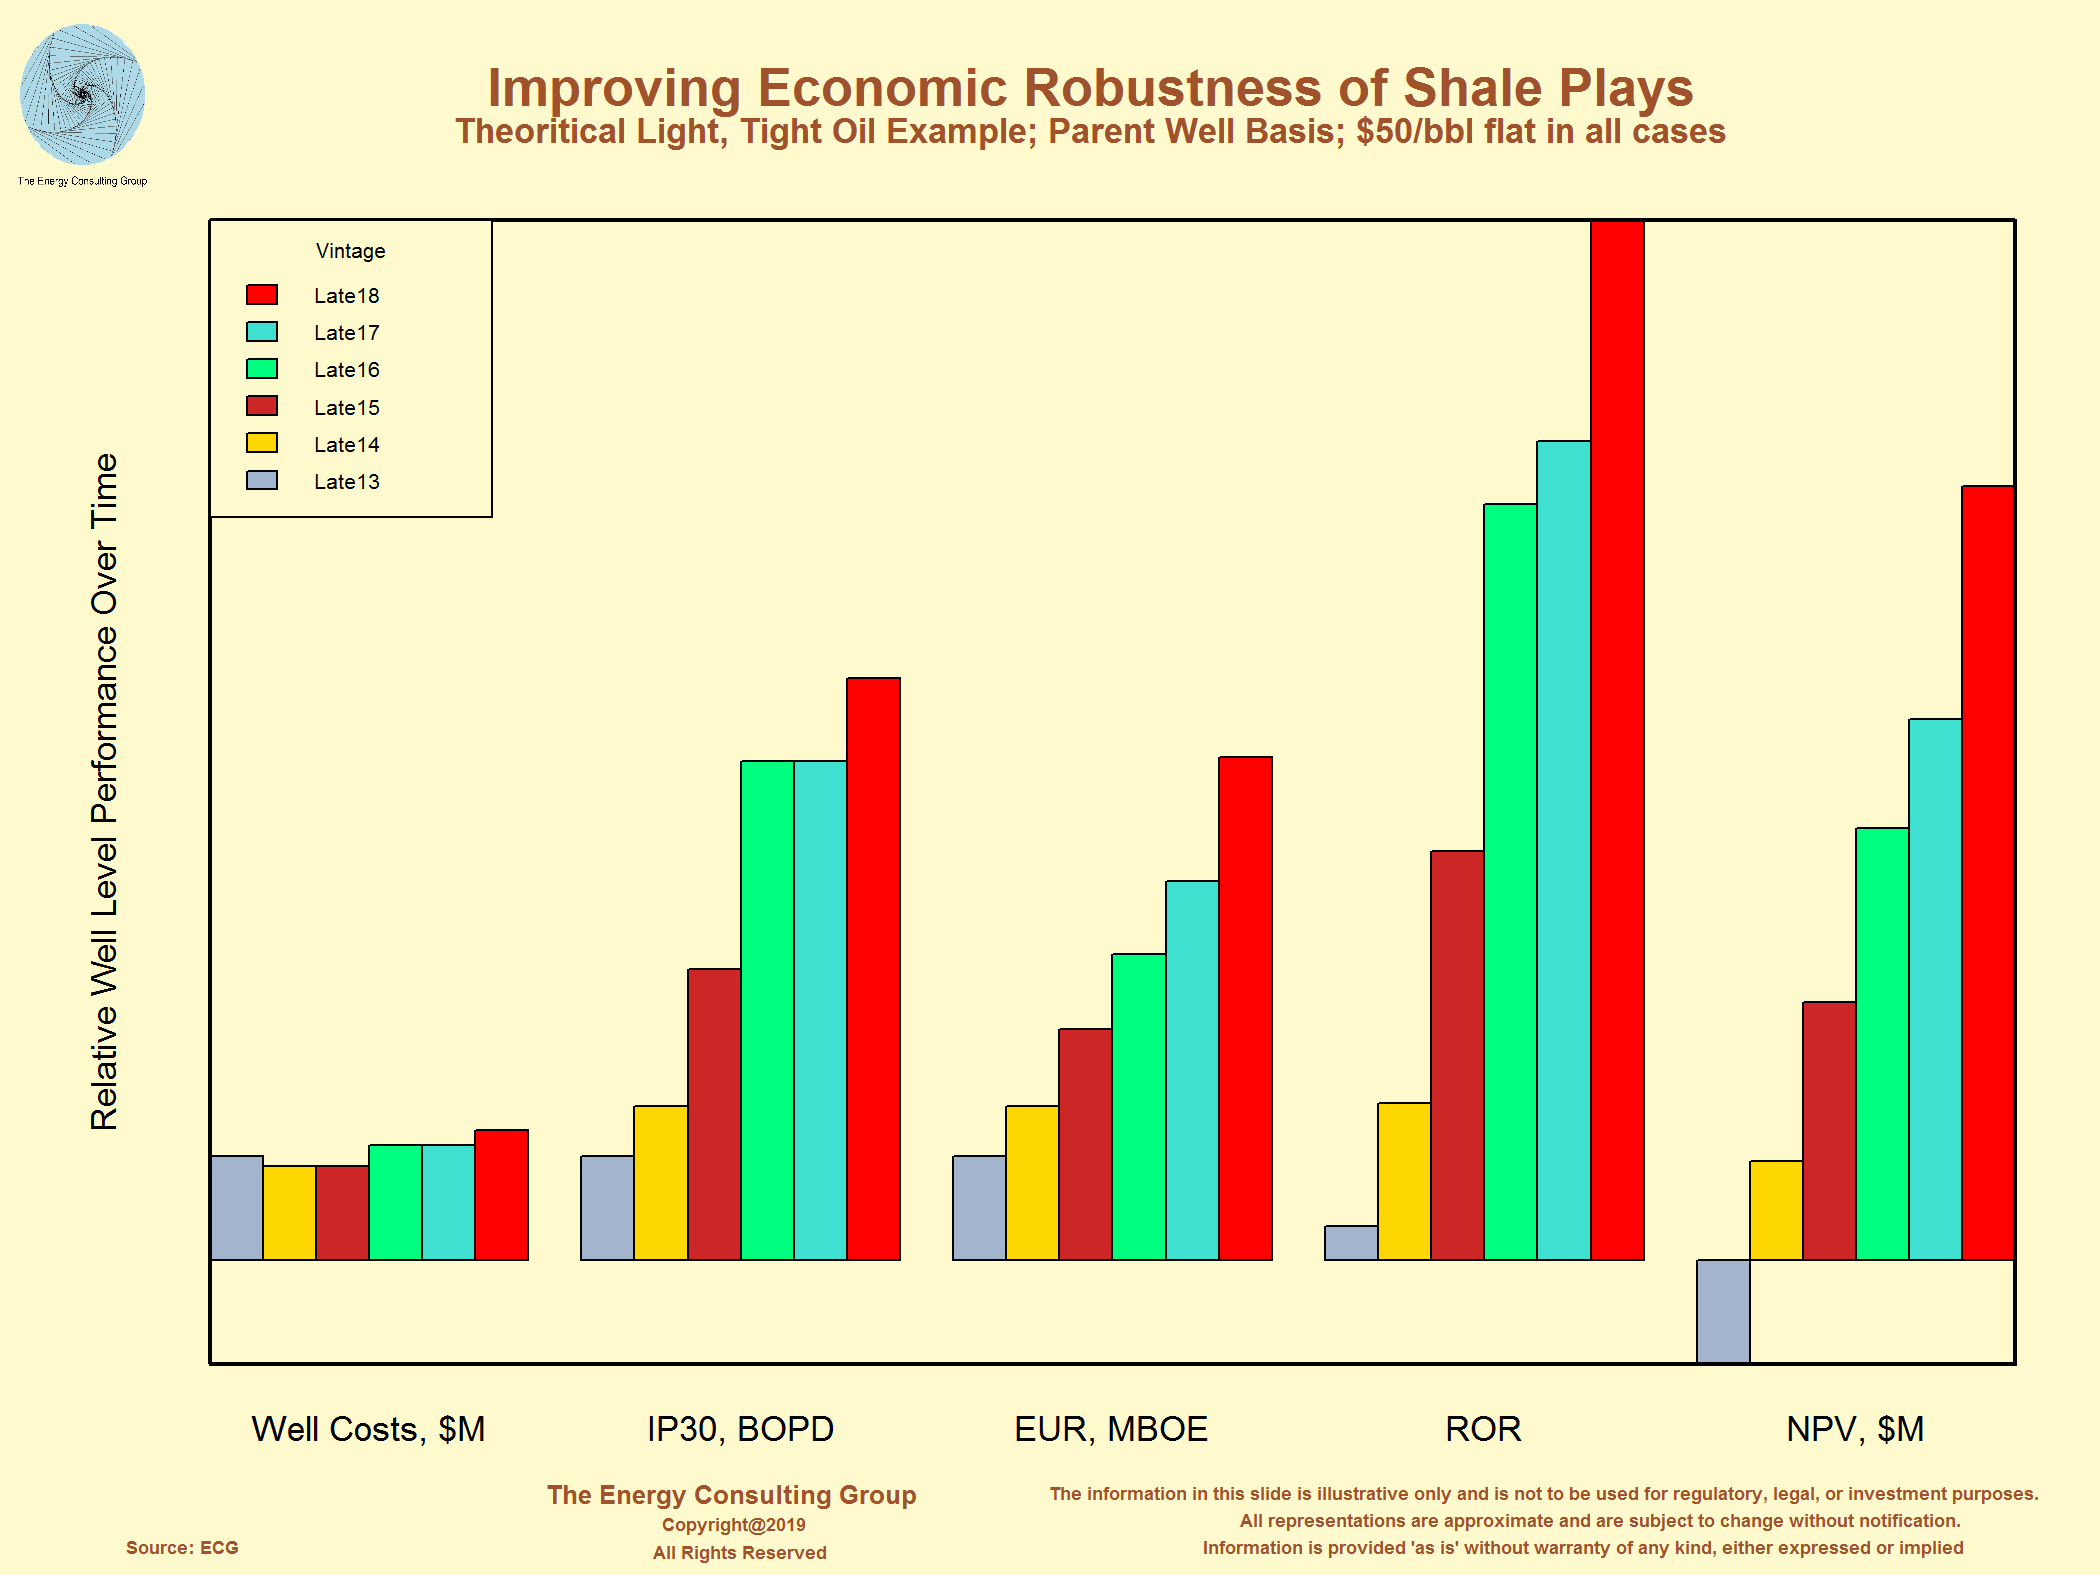 Click on the image for higher resolution version. We have an extensive LTO and shale gas economic analysis database, and we have performed literally thousands of such analysis for valuation, and analytical purposes. EVAL is our in-house industry standard economic modeling tool that can quickly perform economics on any upstream situation, domestic or international. |
US Oil and Gas Drilling Rig Market
Segmentation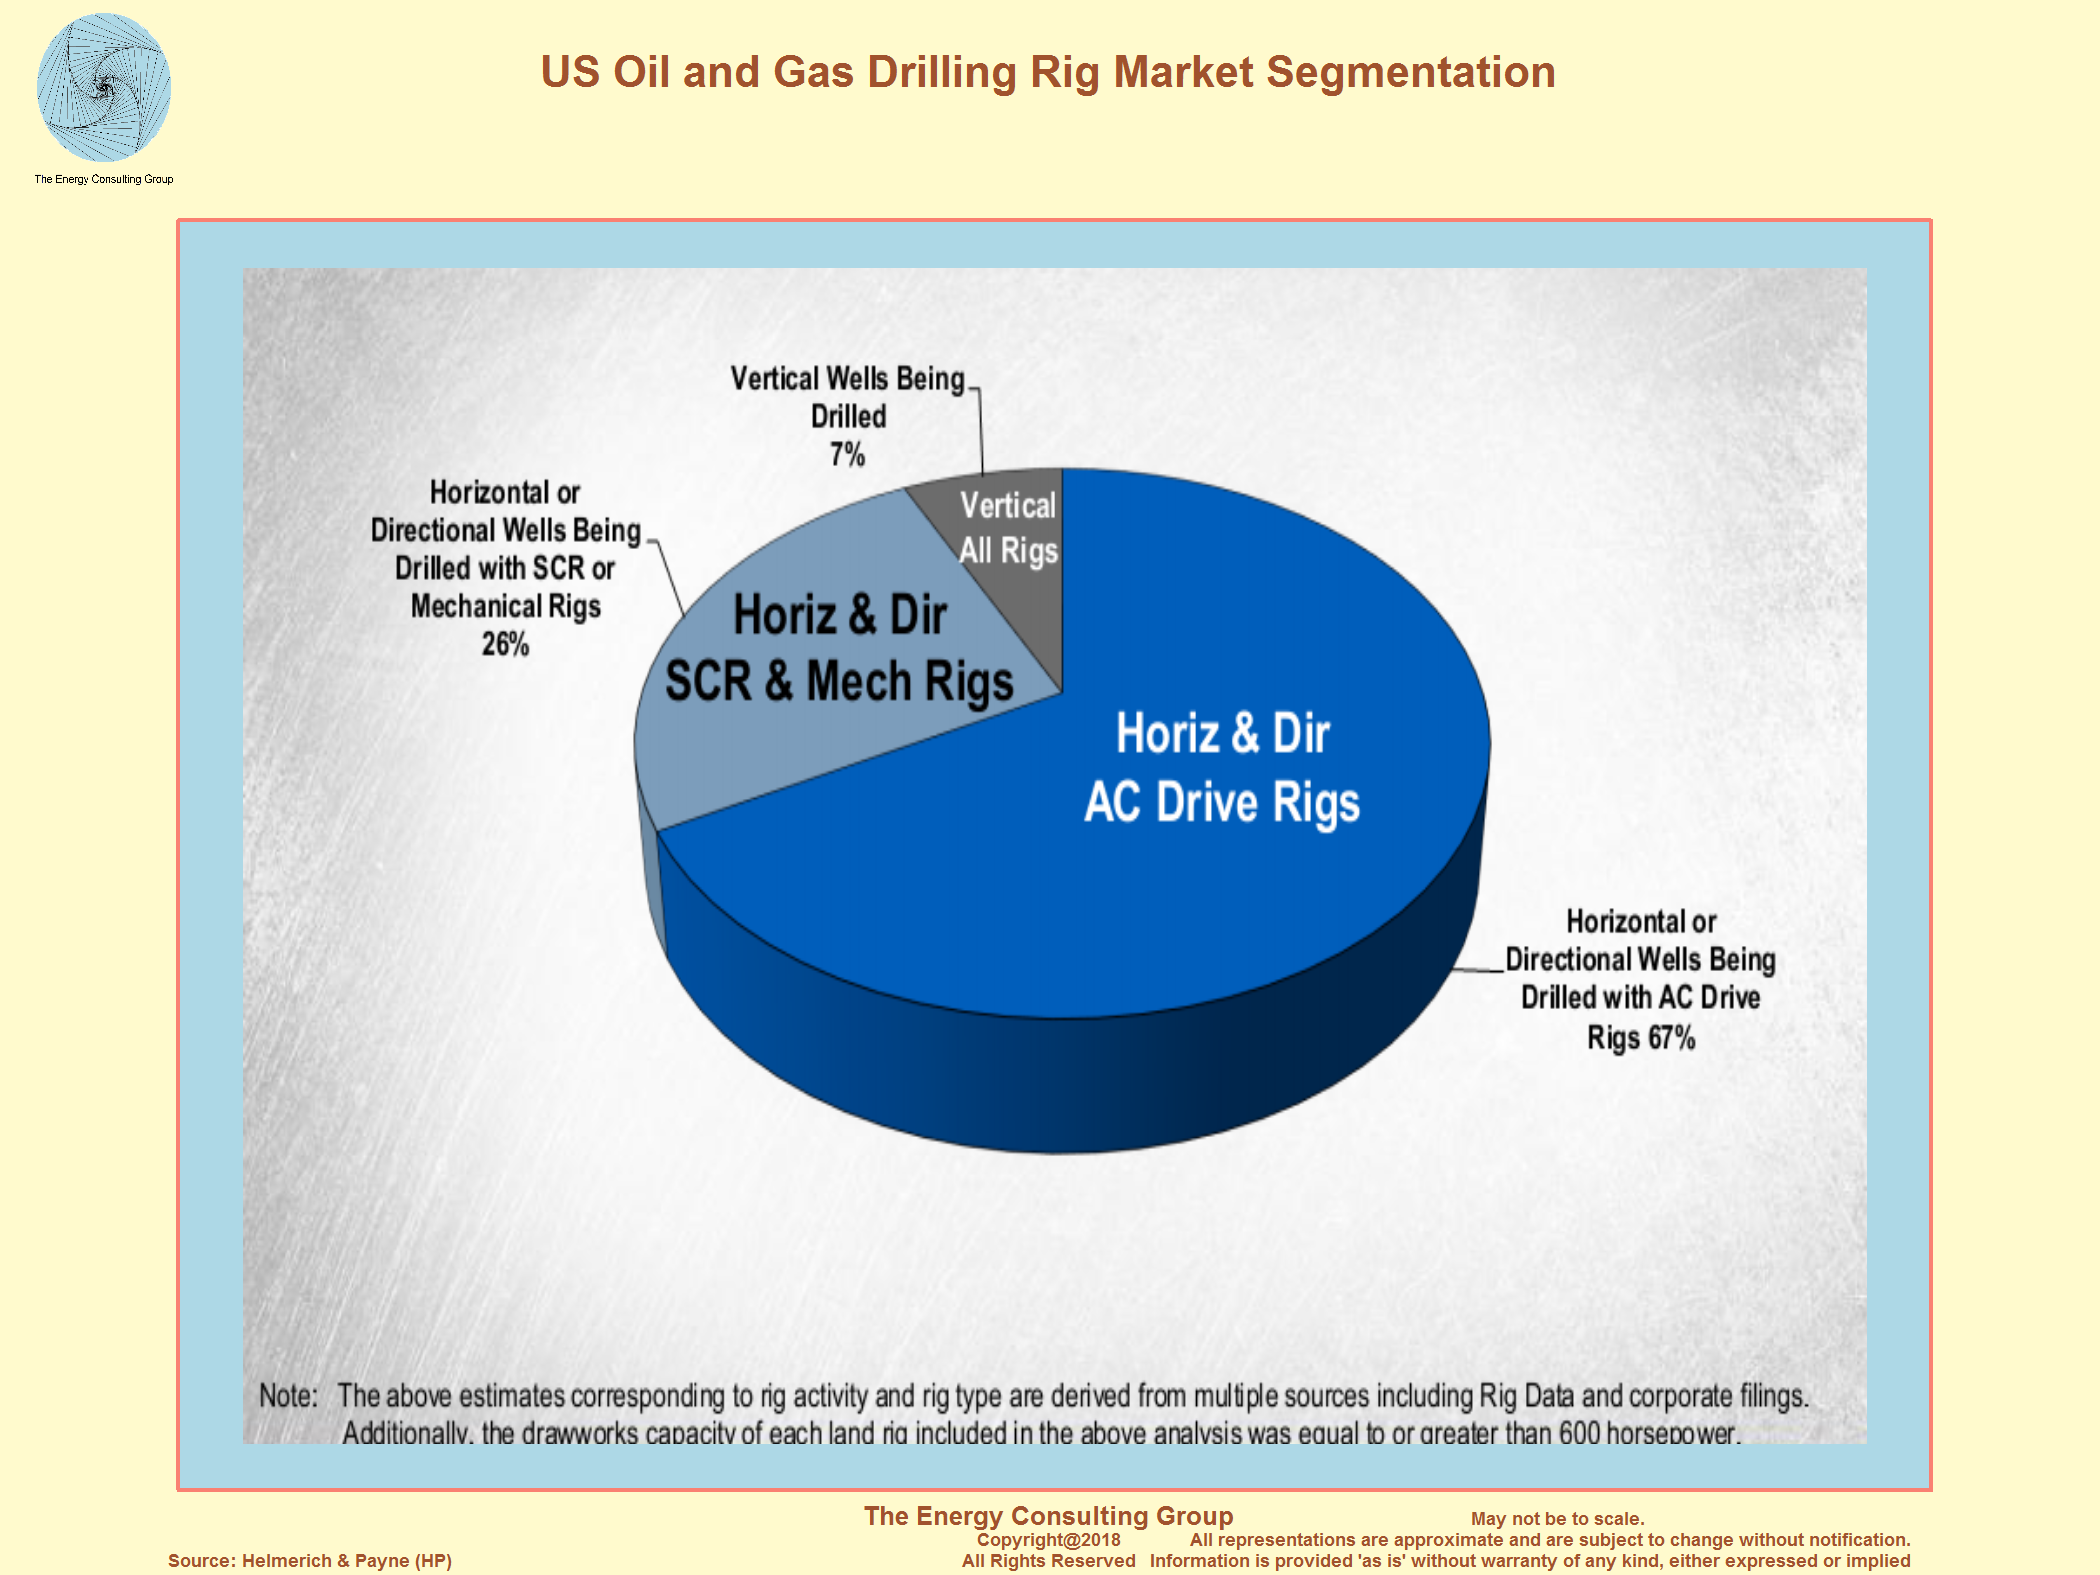 Click on the image for higher resolution version. |
US Super Spec Rig Market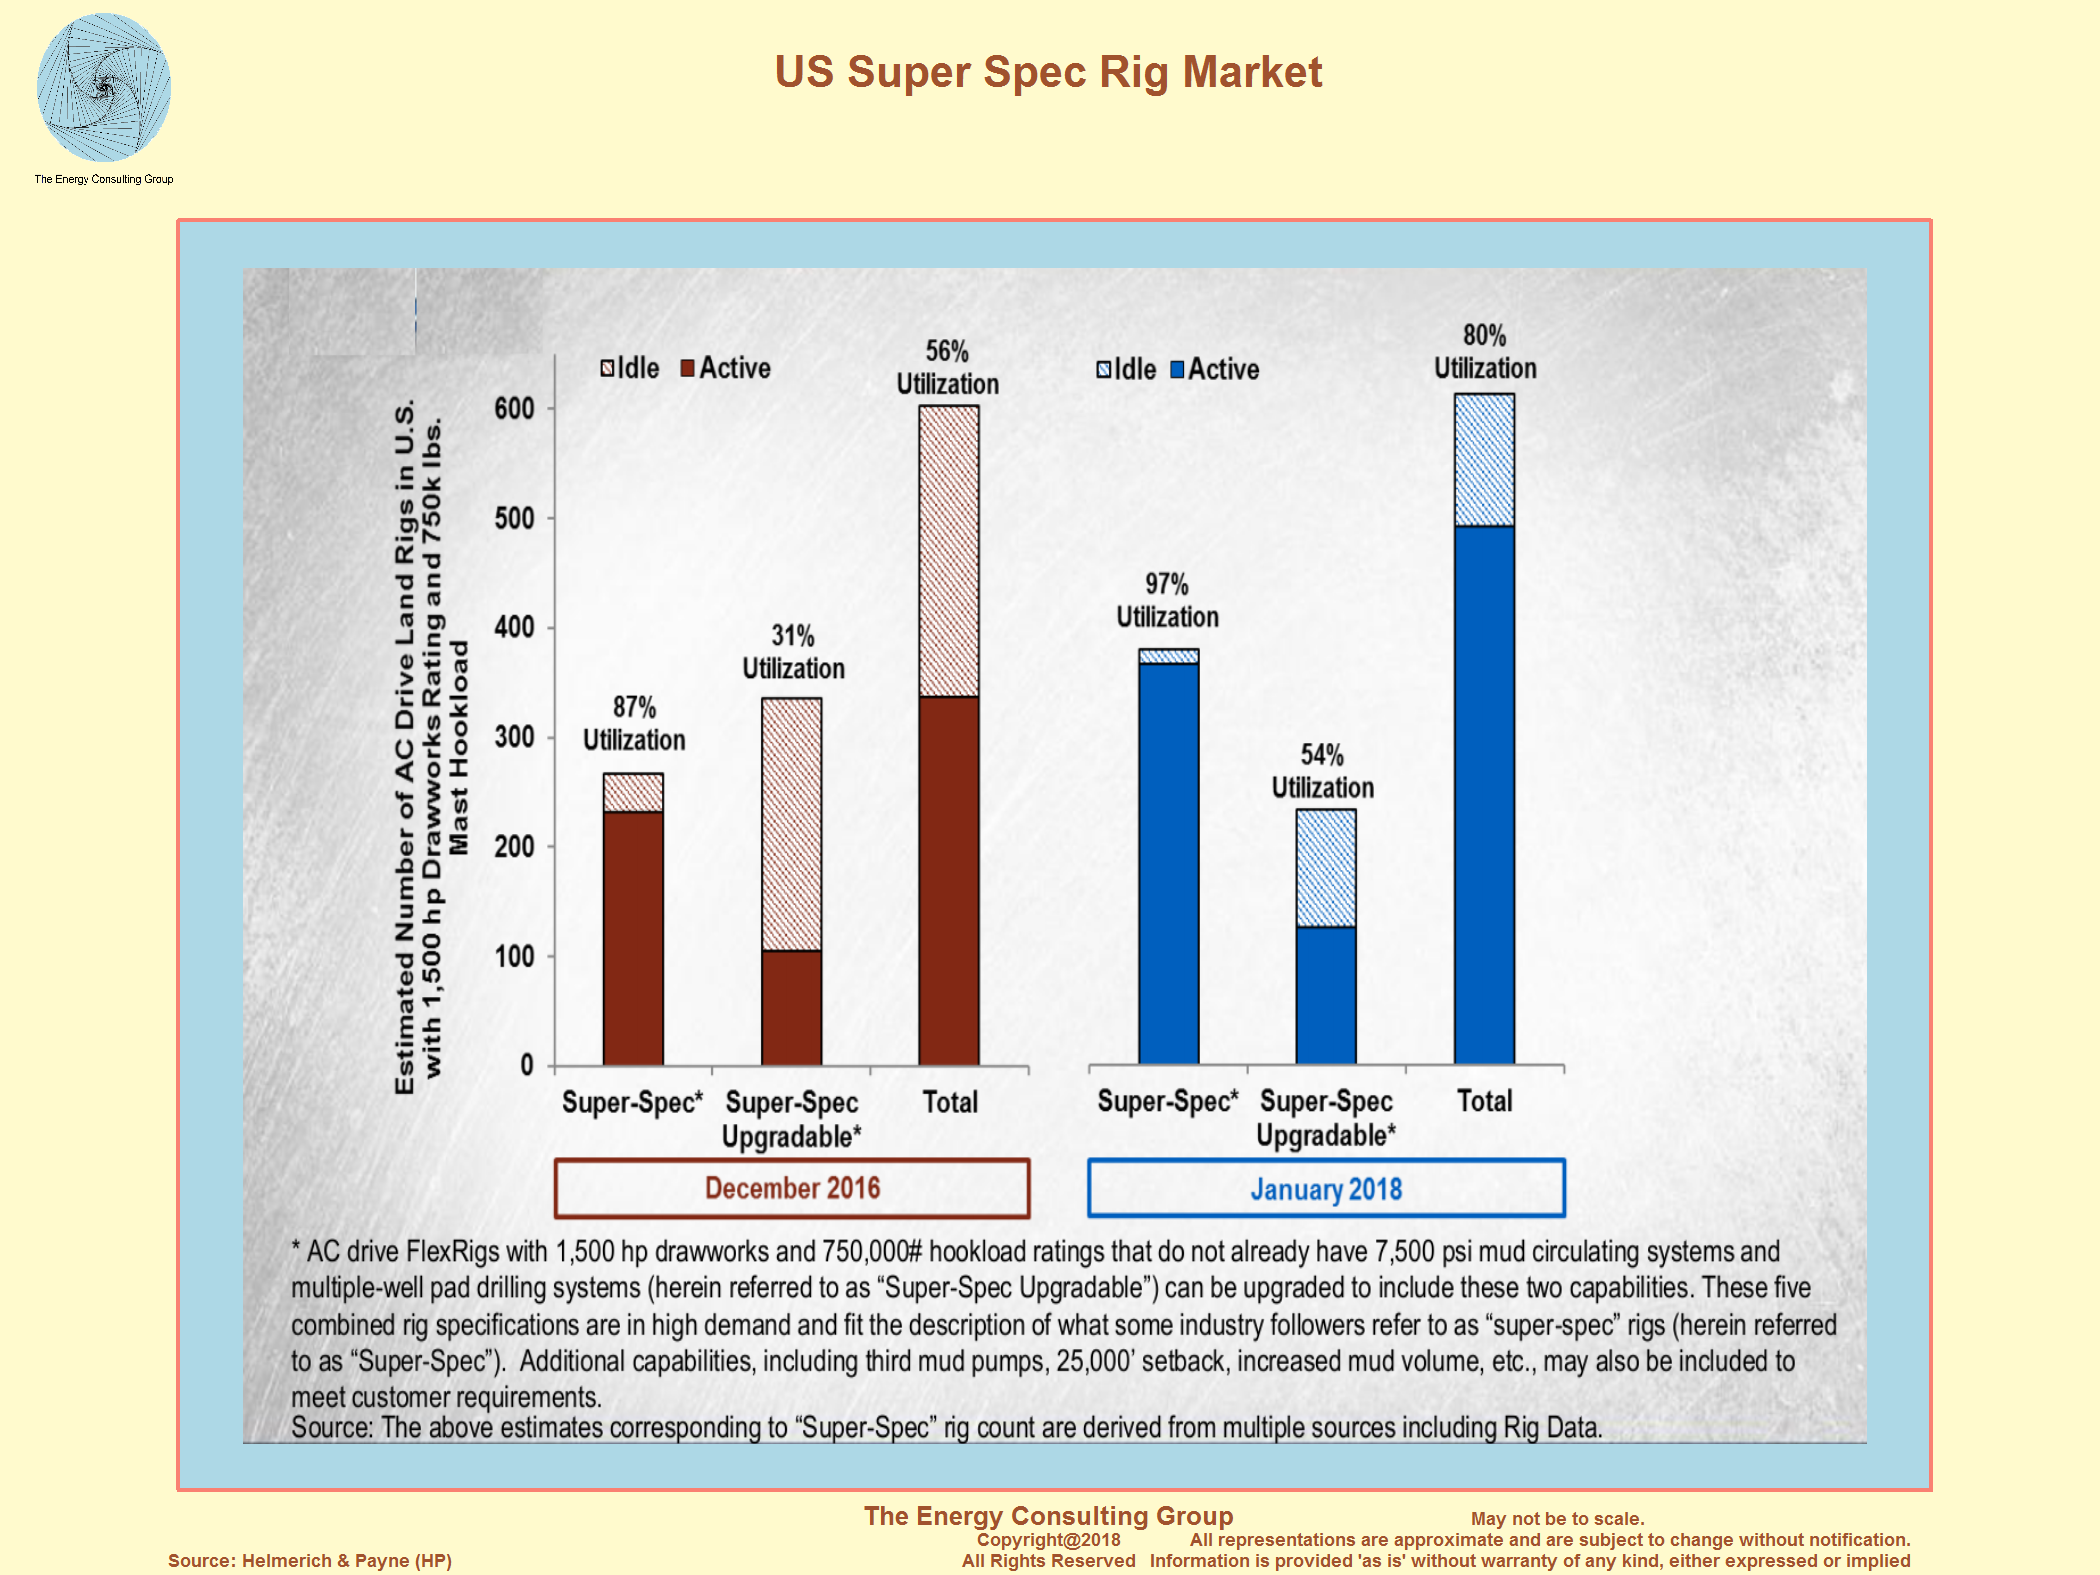 Click on the image for higher resolution version. |
The following panel contains an interactive 3D map of USA oil and gas well drilling activity. To use the portal capability of this map in order call-up historical rig count charts and current drilling activity maps for the main US shale areas, click on the blue spheres on the 3D map, and on the resulting pop-up, click the hi-lighted links. To use the map, rotate it by pressing the left mouse button down and moving the mouse, zoom in/out by pressing the mouse wheel down and moving the mouse up and down, and roam it by pressing the right mouse button down and moving the mouse.
Link to full screen version the rotatable, zoomable USA drilling heat map.
If you like this 3D map, you might also appreciate these 3D maps as well (note: they work great on smart phones and tablets)
A 3D oil and gas map overview of the Gulf of Mexico
A 3D map view of oil and gas exploration prospects in the Alaska National
Wildlife Refuge (ANWR)
"Heat" Map for for June 2016, During
Which, USA Oil and Gas Drilling Activity Hit Its Low for the 2015-2016 Down Cycle 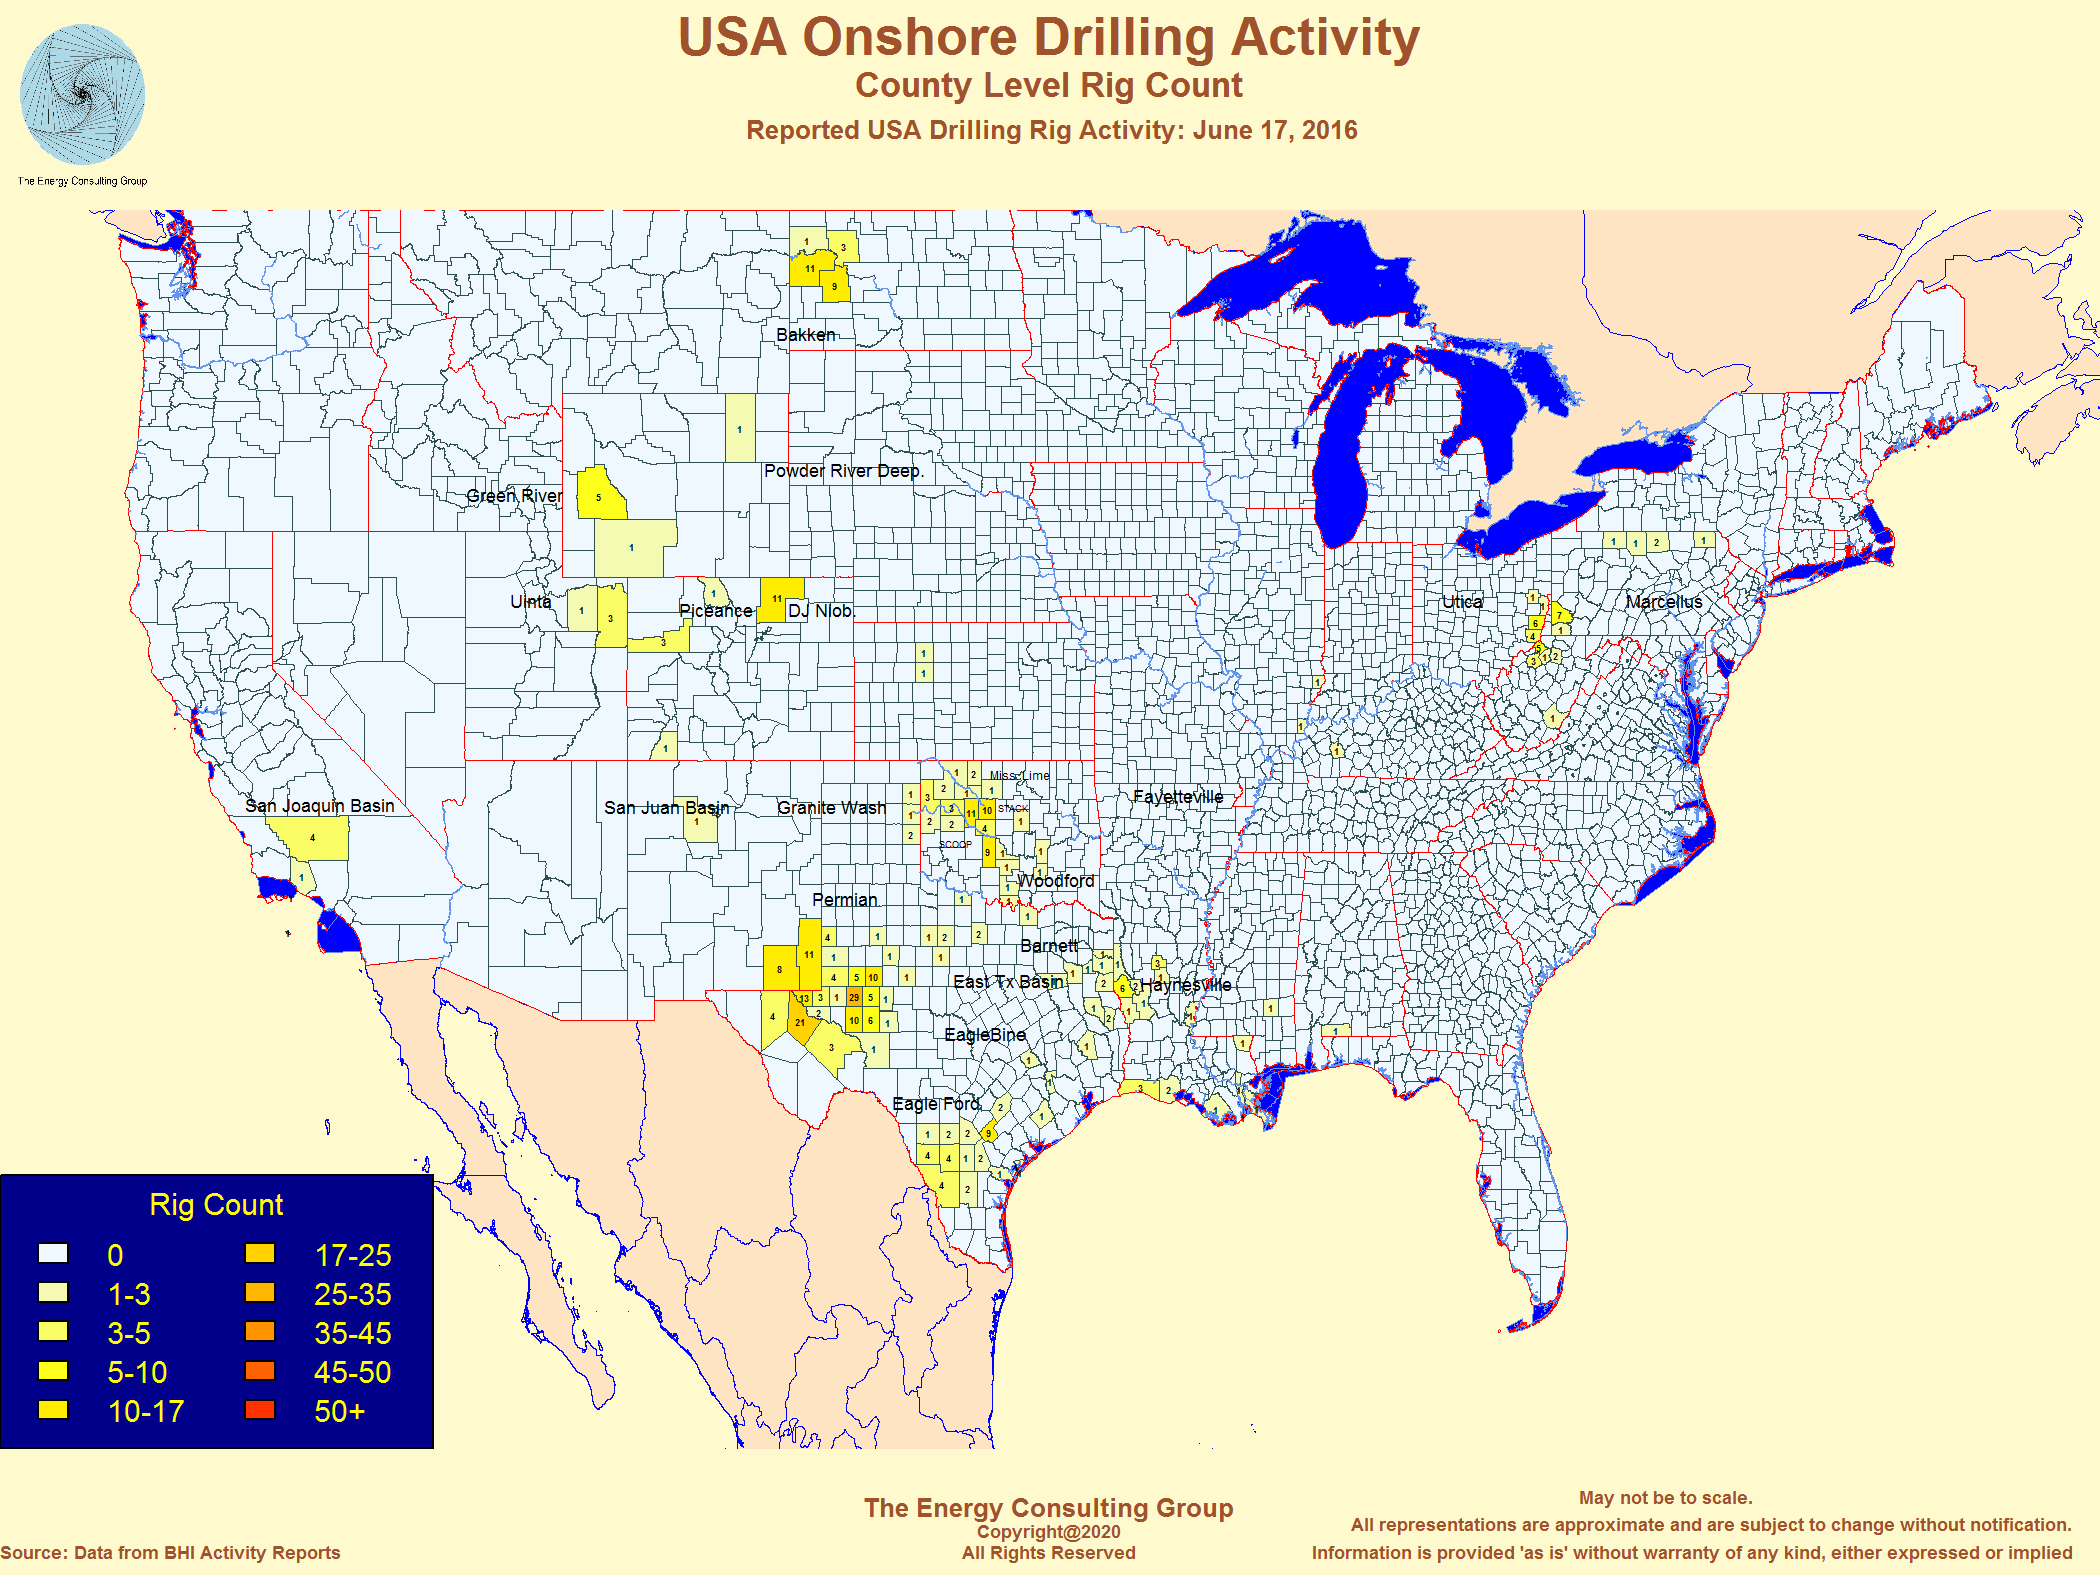 Click on the image for higher resolution version. |
Peak USA Oil and Gas Shale Drilling Activity: "Heat" Map for Sept. 12, 2014 Click on the image for higher resolution version. |
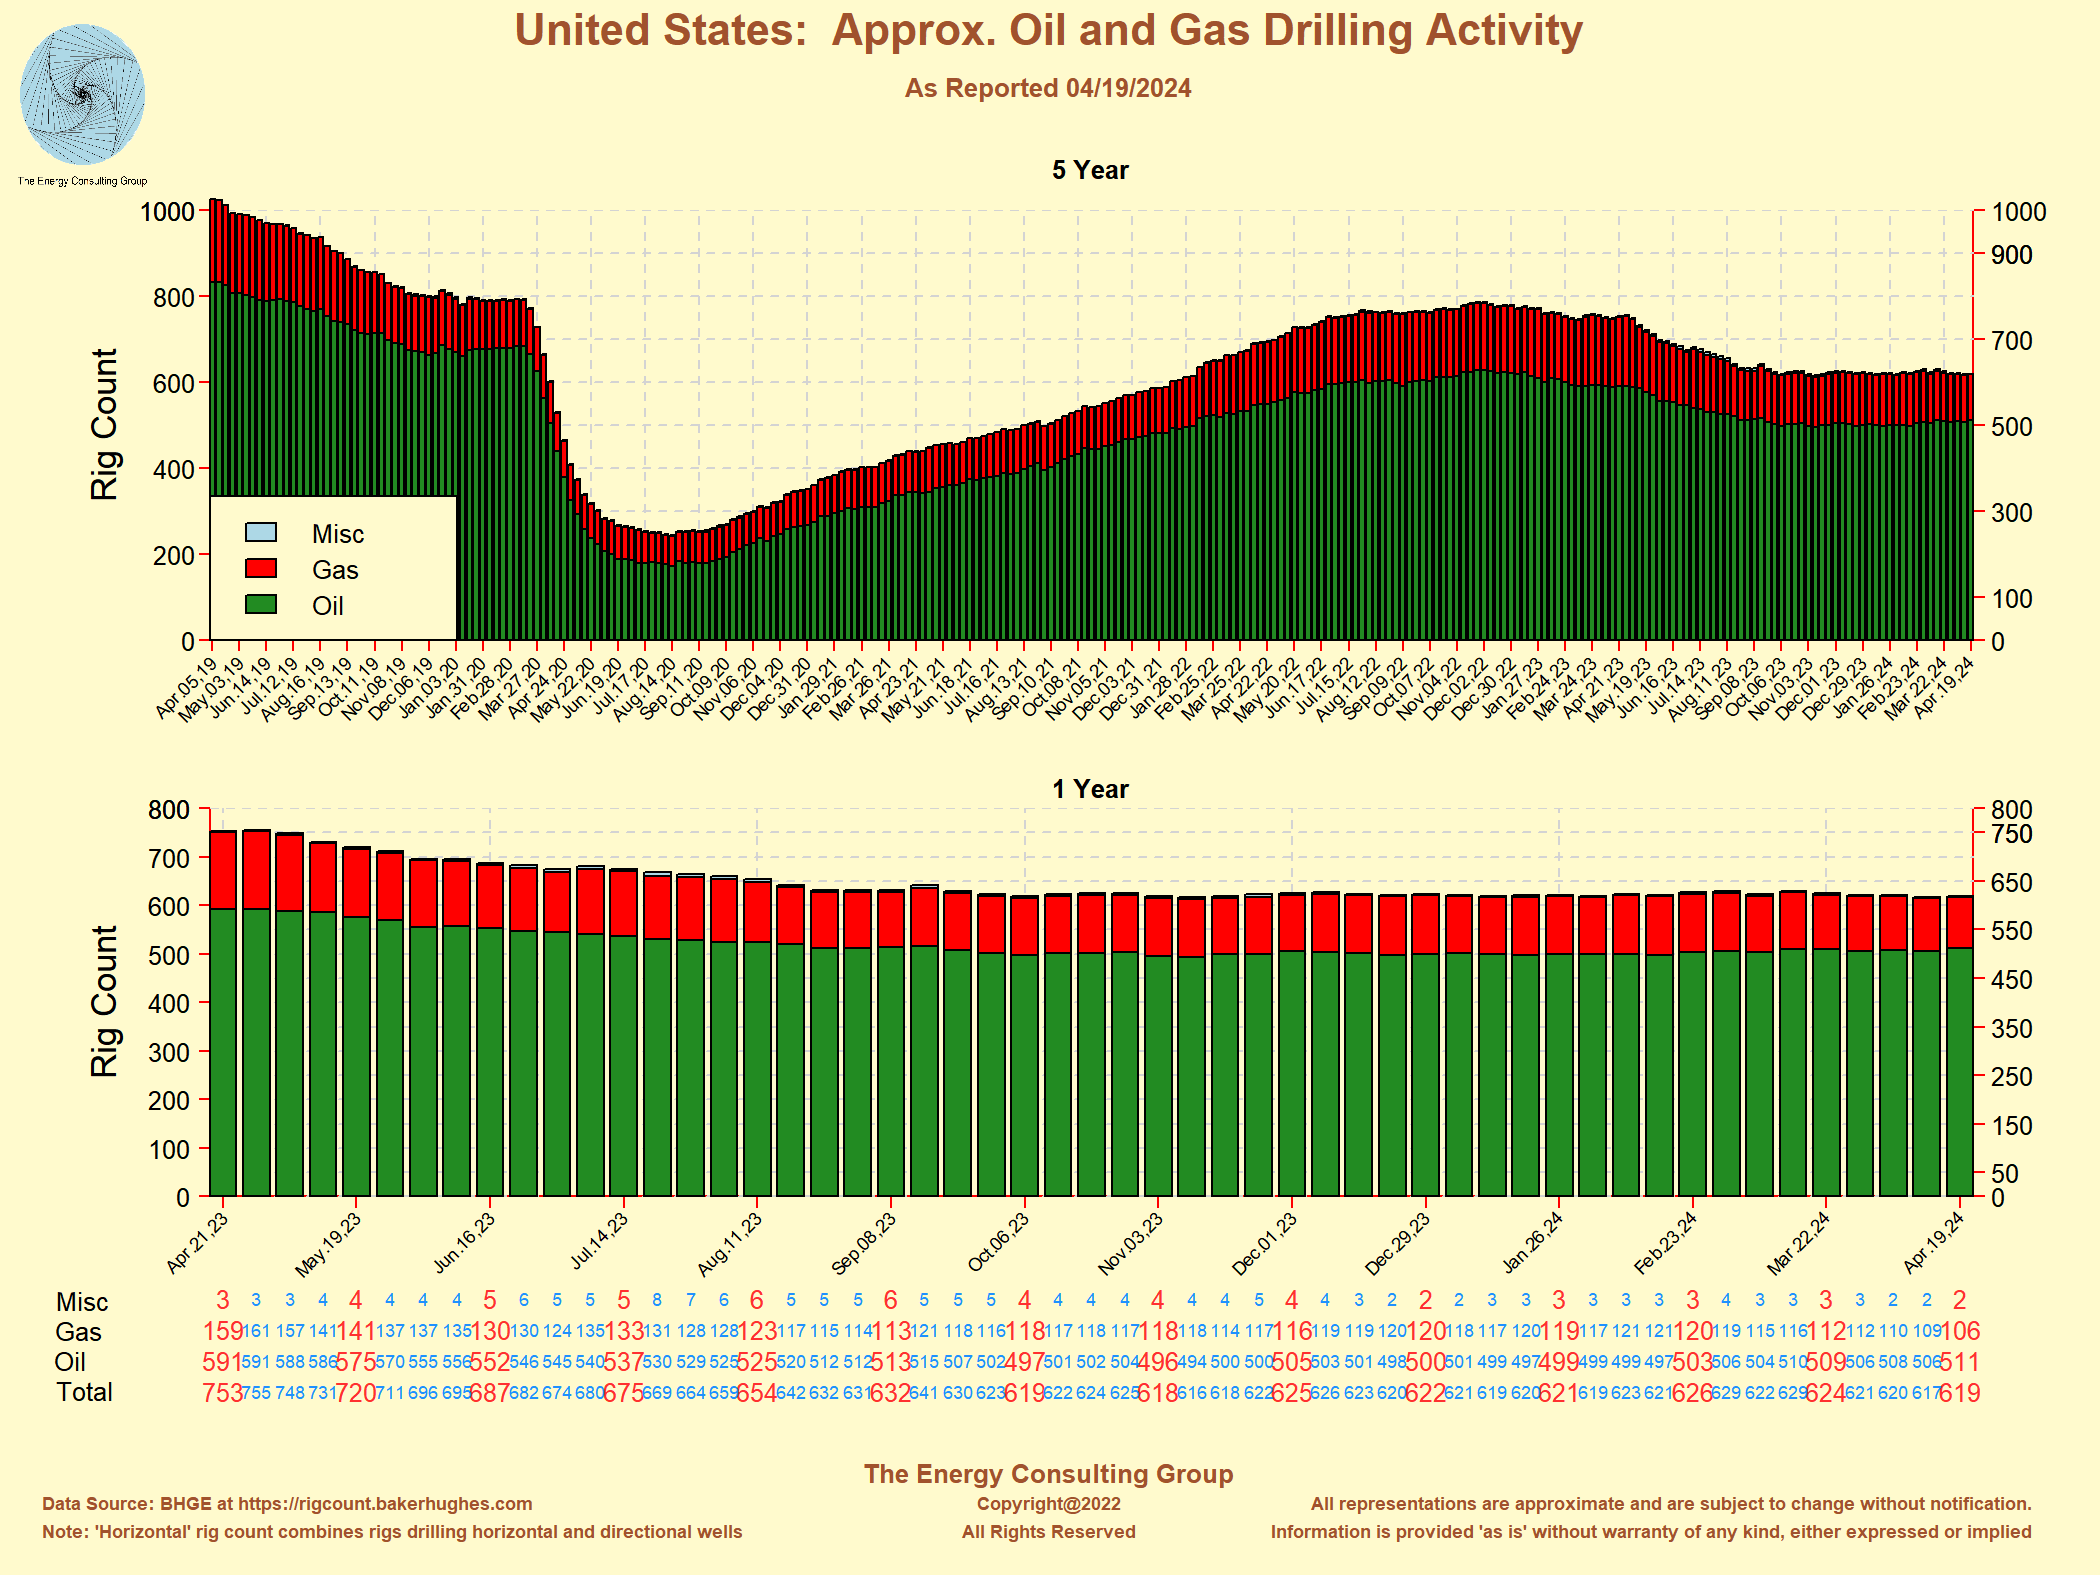
USA Drilling Rig Trends: Oil, Gas and Total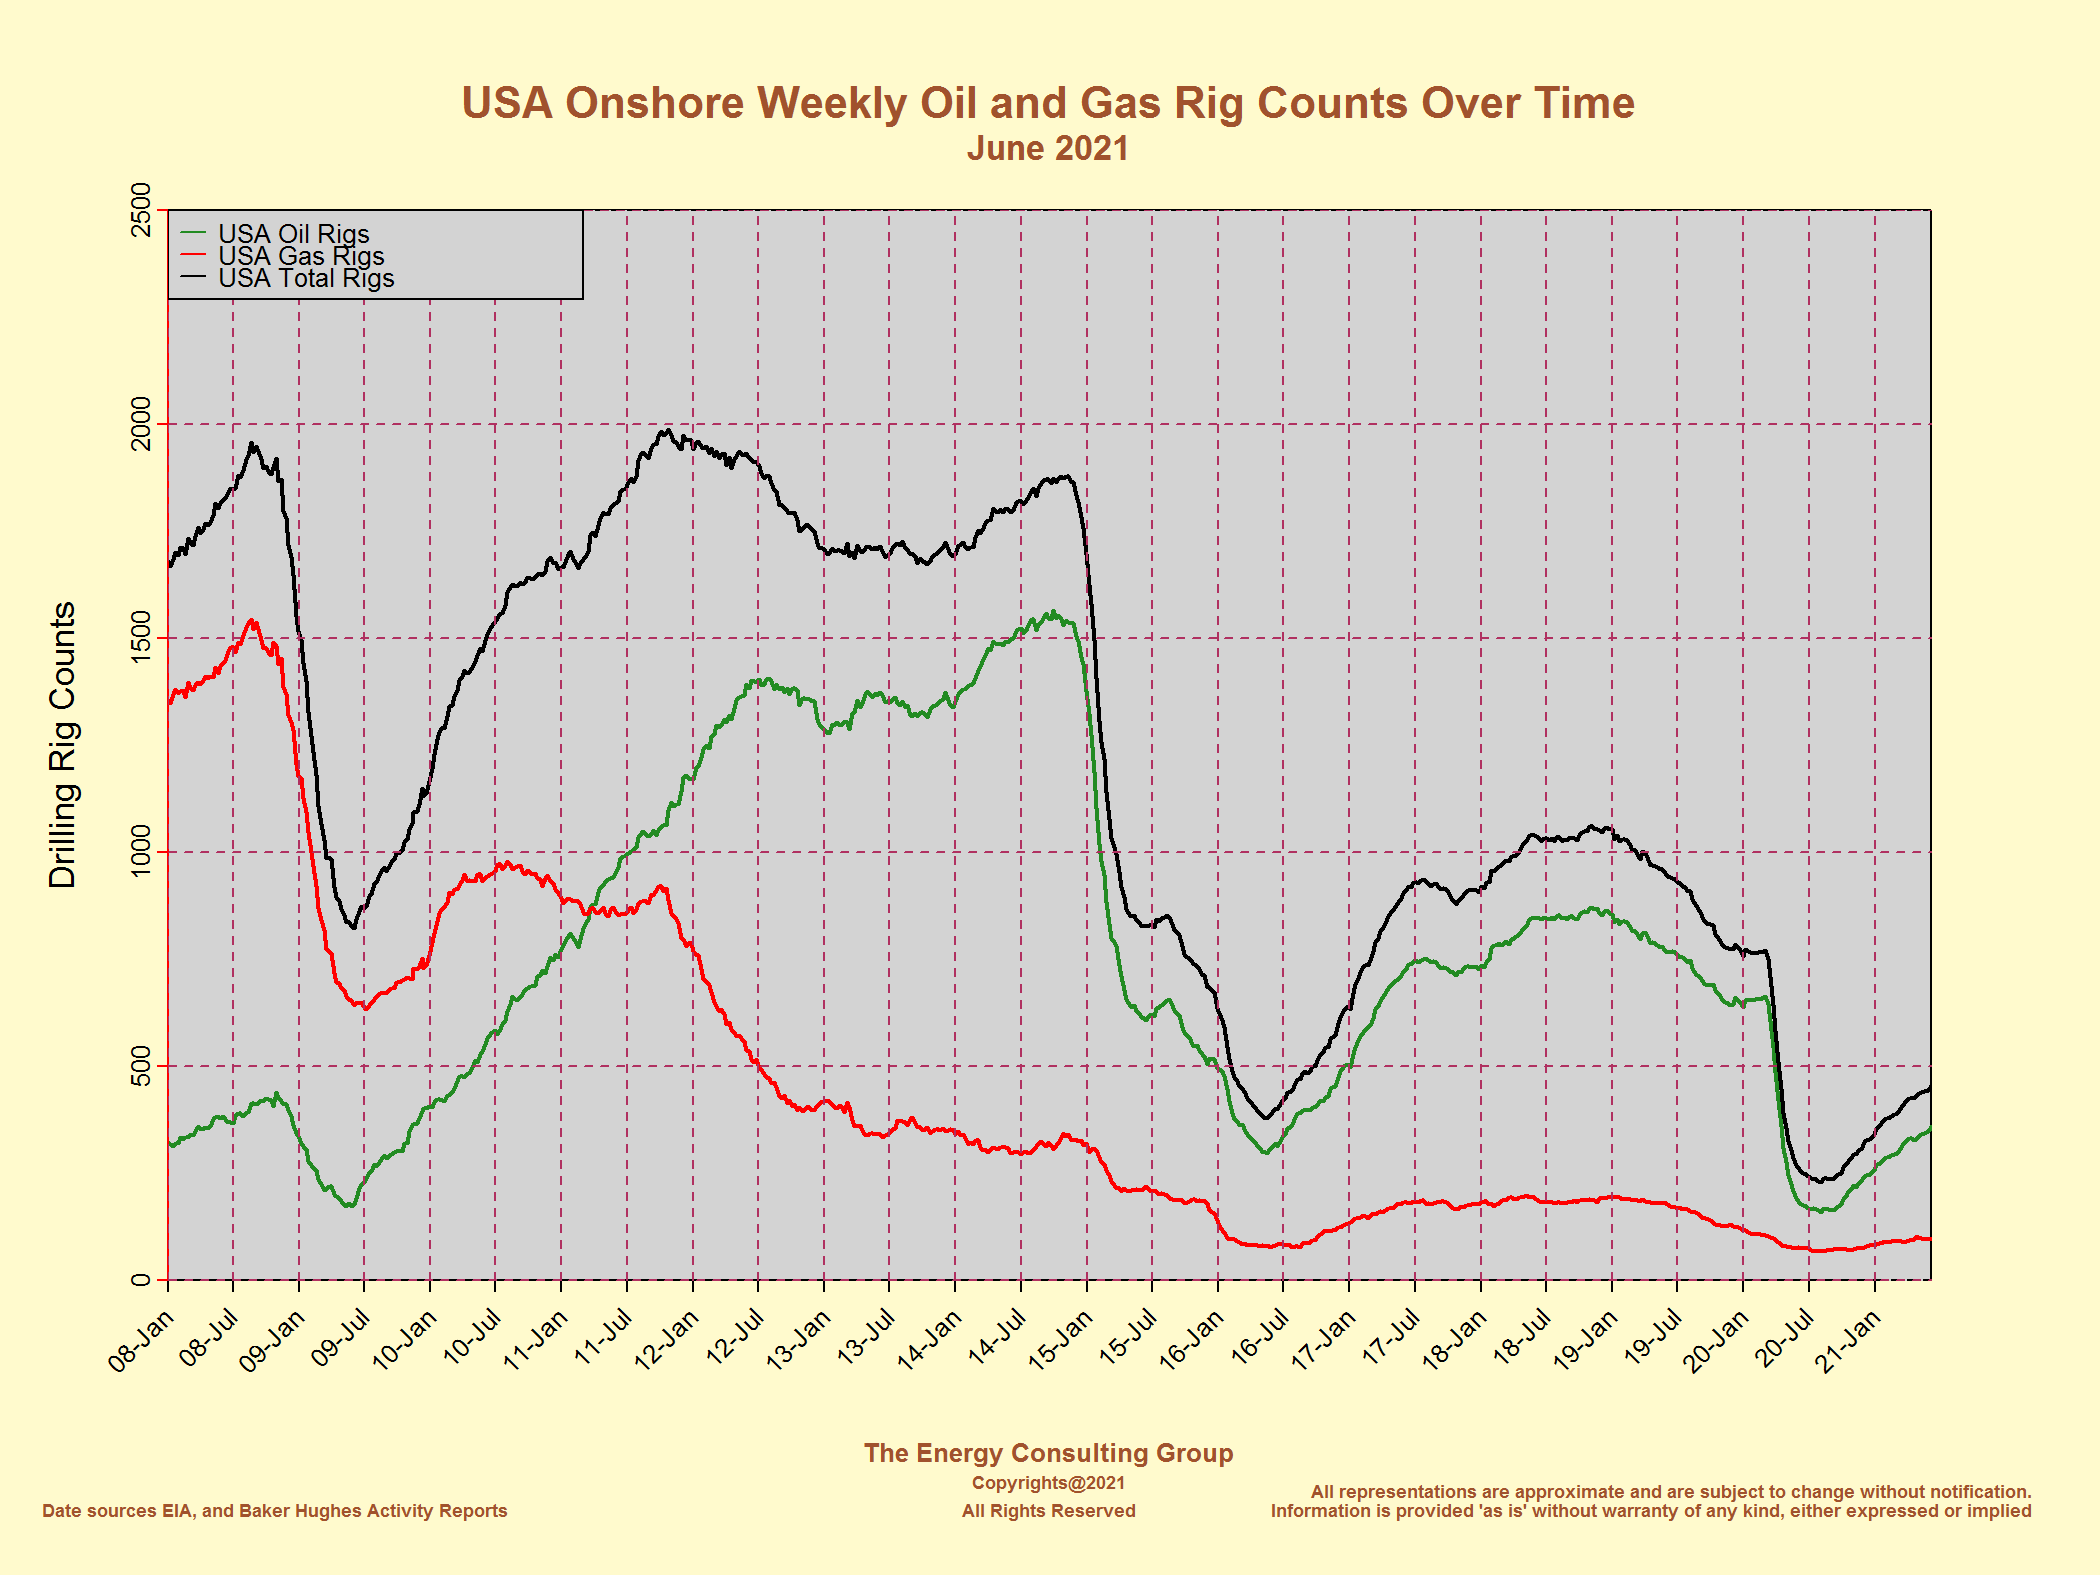 Click on the image for higher resolution version. |
USA Horizontal vs Vertical Oil and Gas Drilling Rig
Activity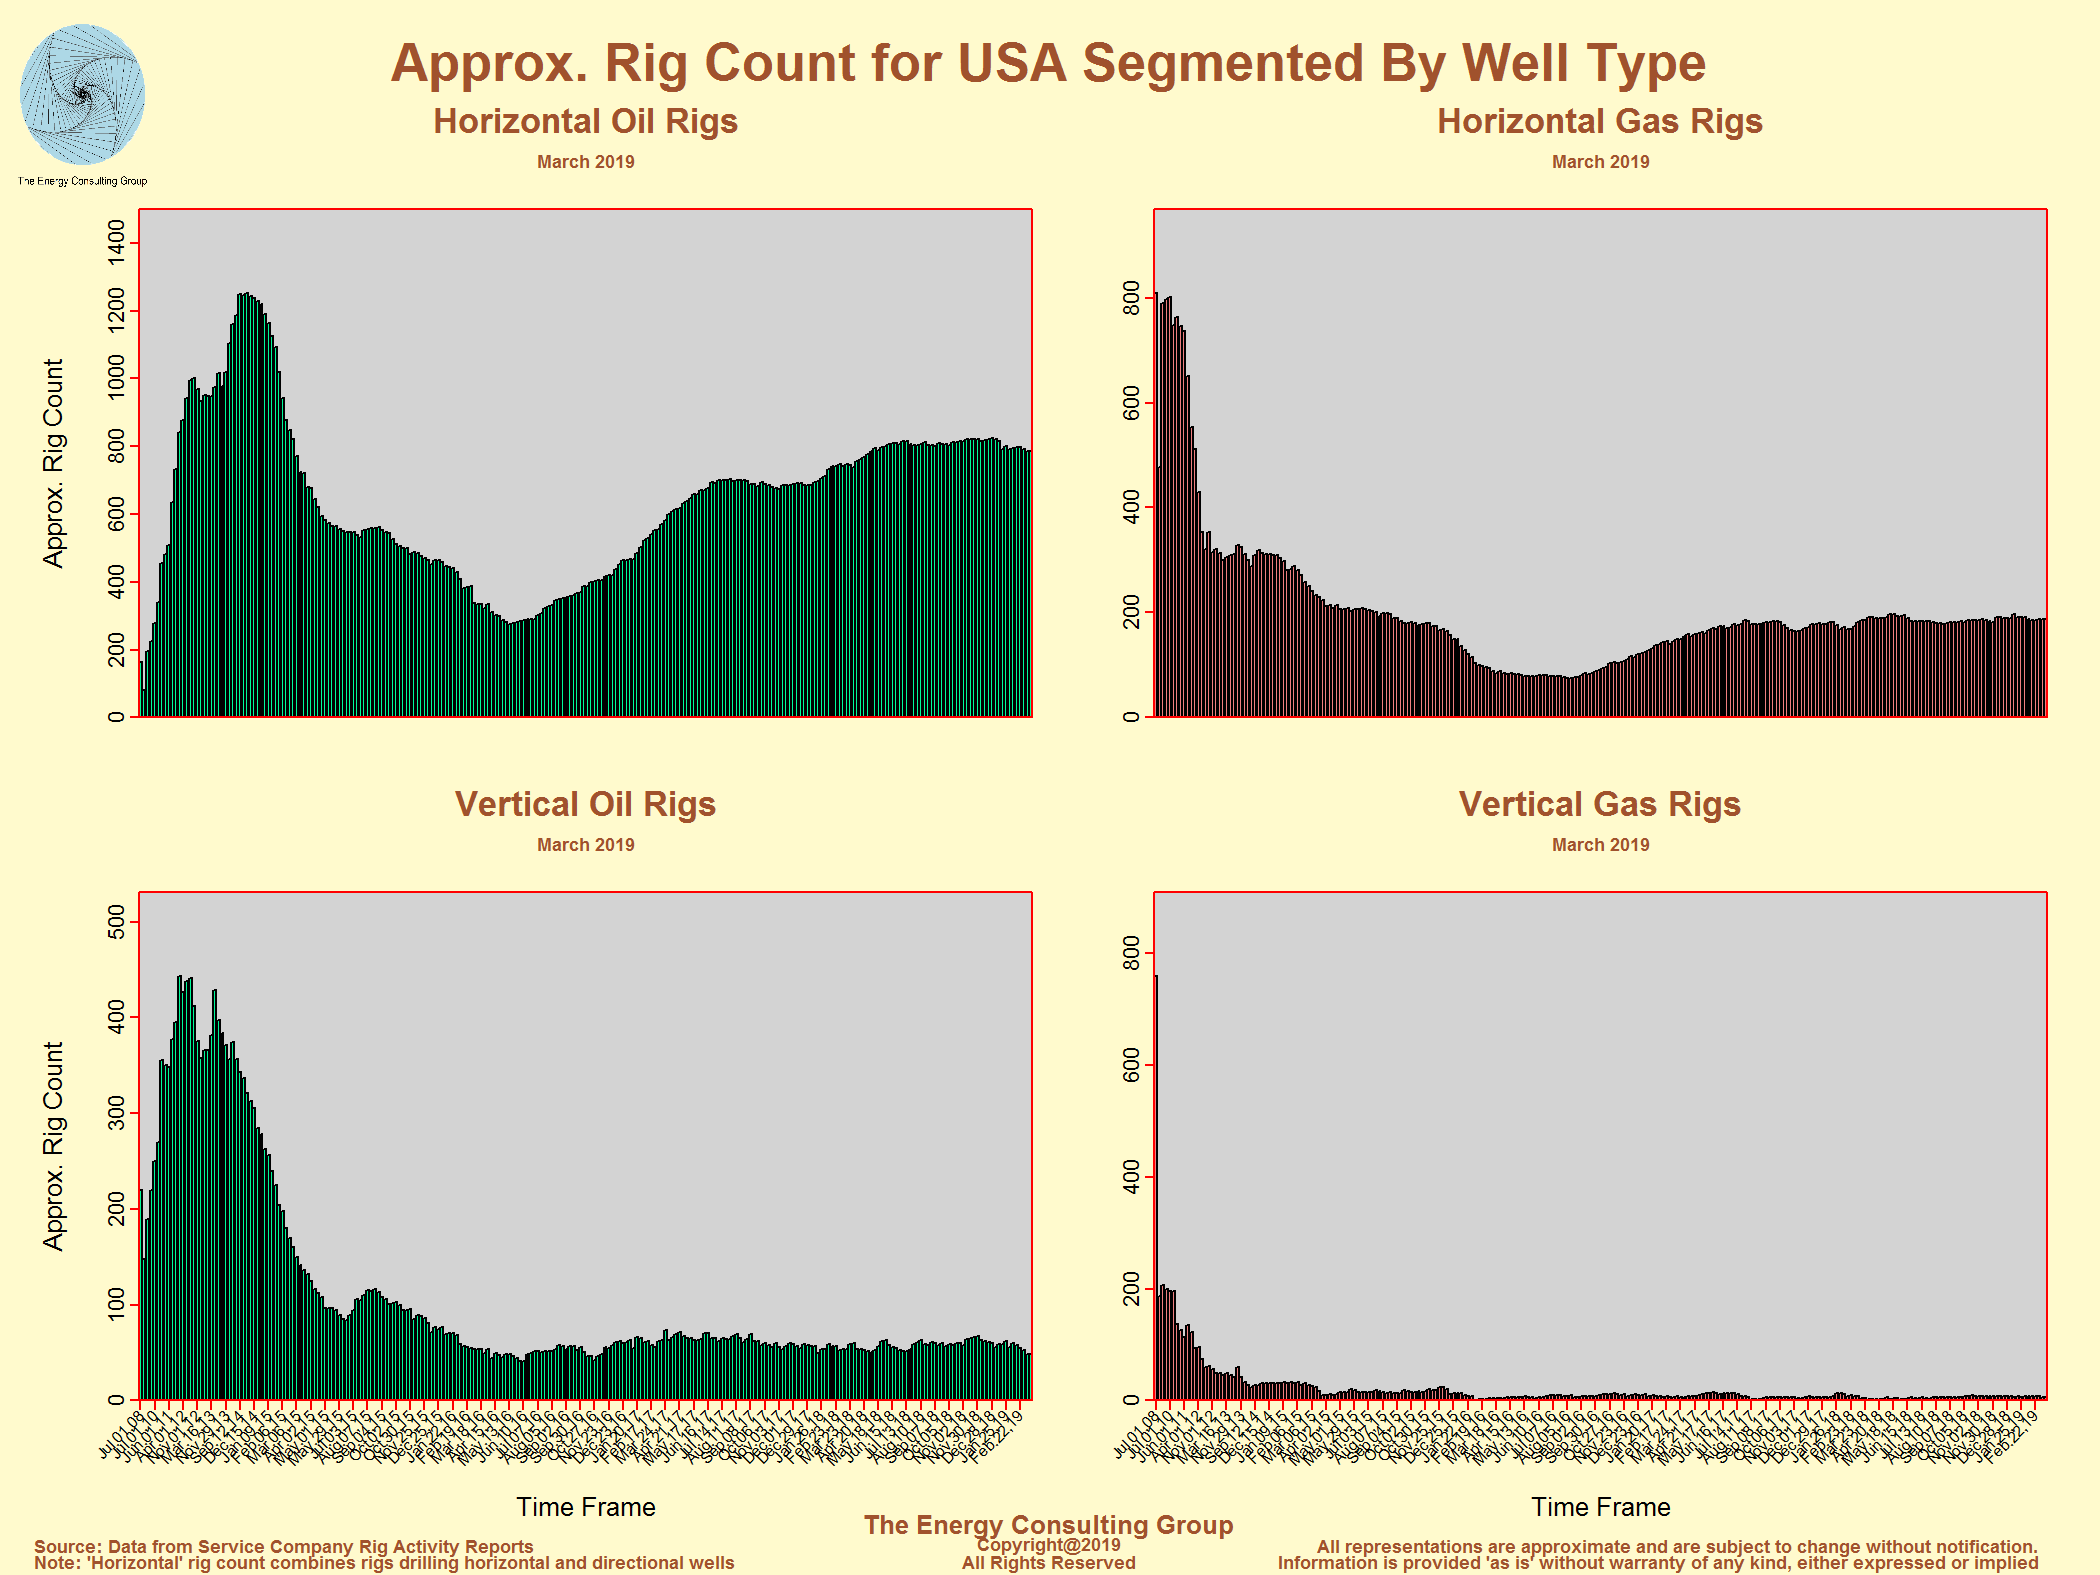 Click on the image for higher resolution version. |
NYMEX Oil Price Versus USA Oil Drilling Rig Count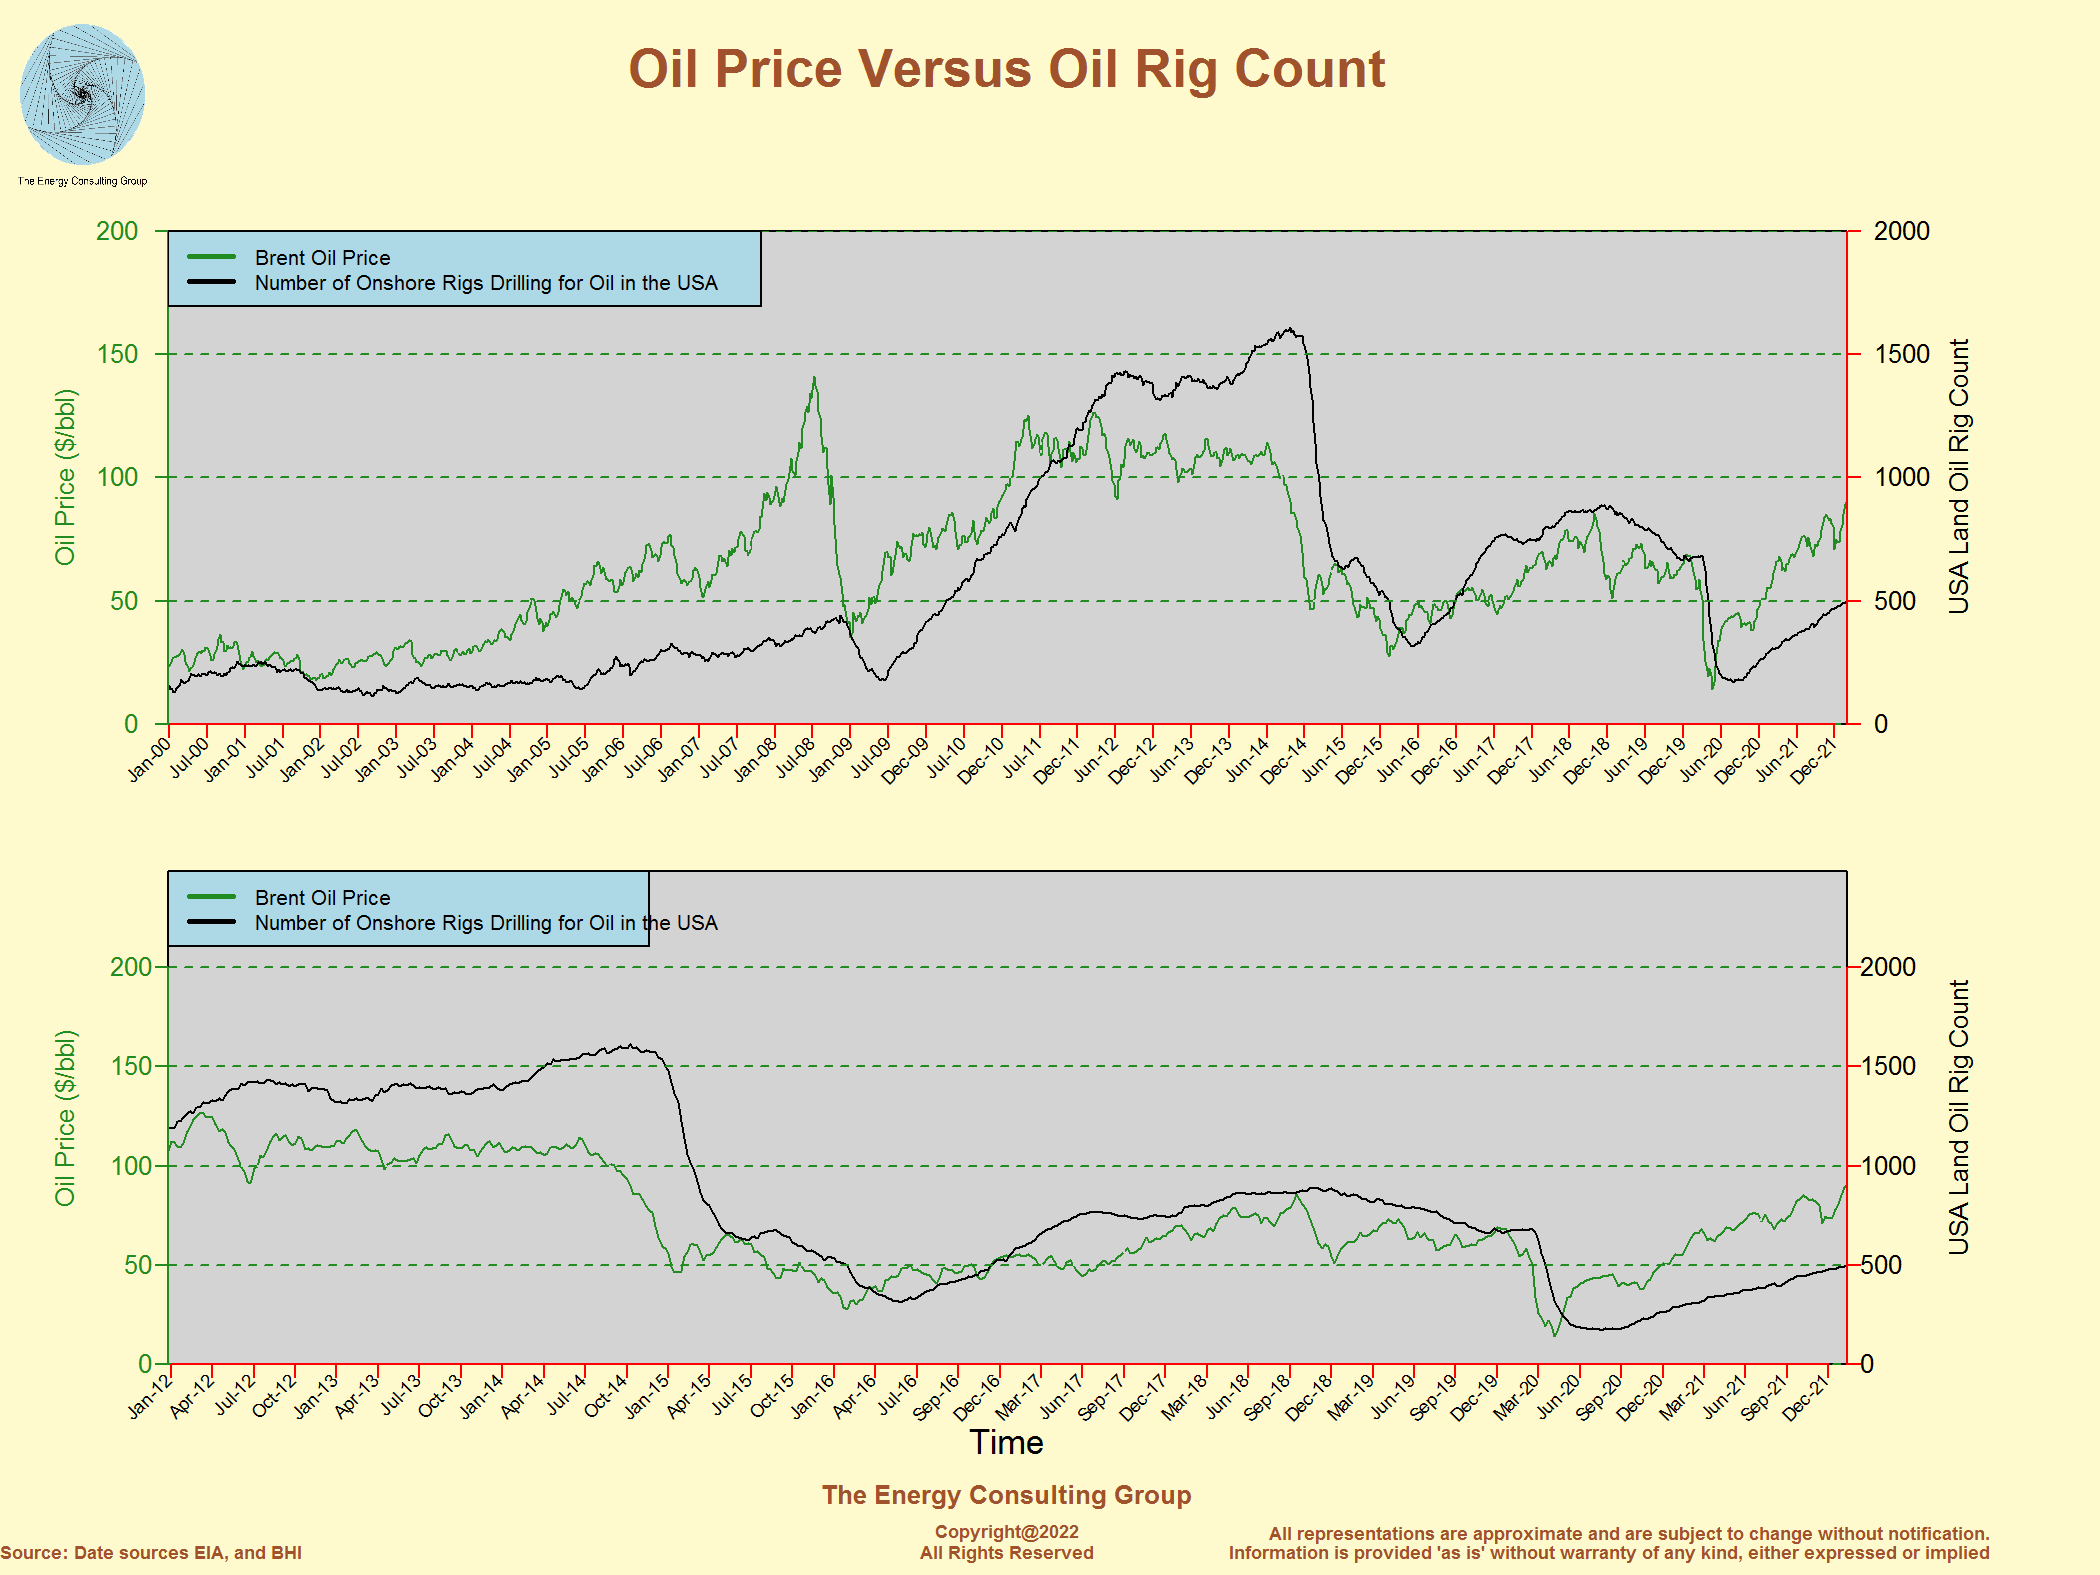 Click on the image for higher resolution version. |
Henry Hub Gas Price Versus USA Gas Drilling Rig Count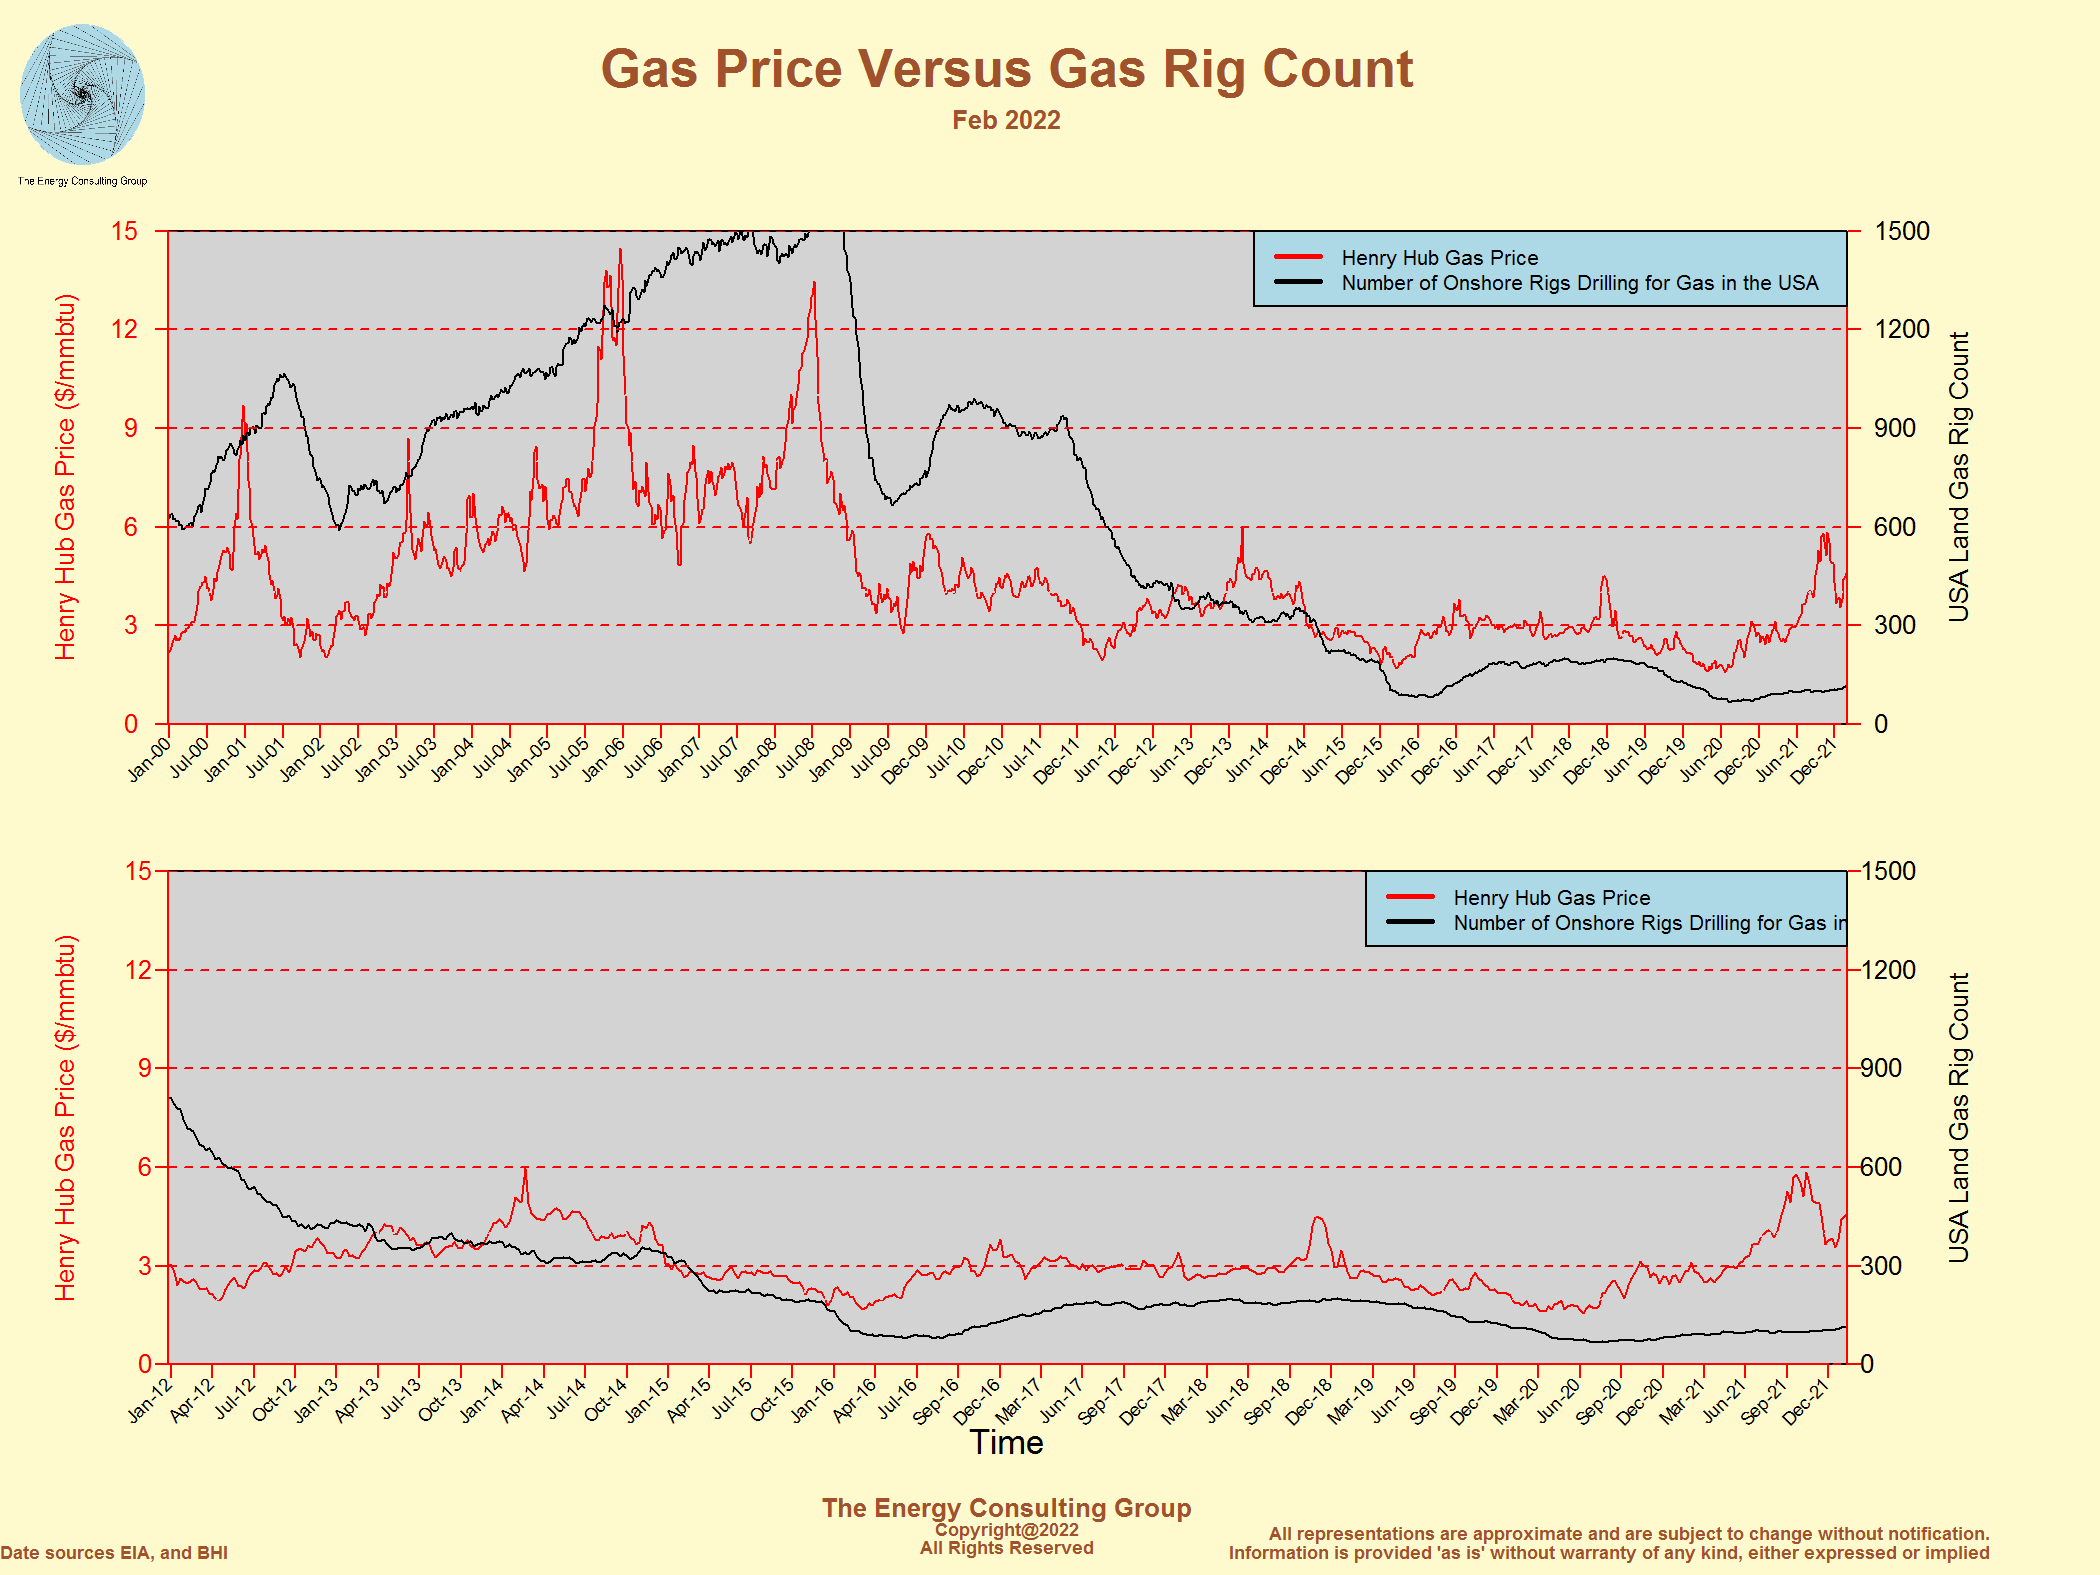 Click on the image for higher resolution version. |
Approximate
Permian Basin
Oil and Gas Drilling Rig Count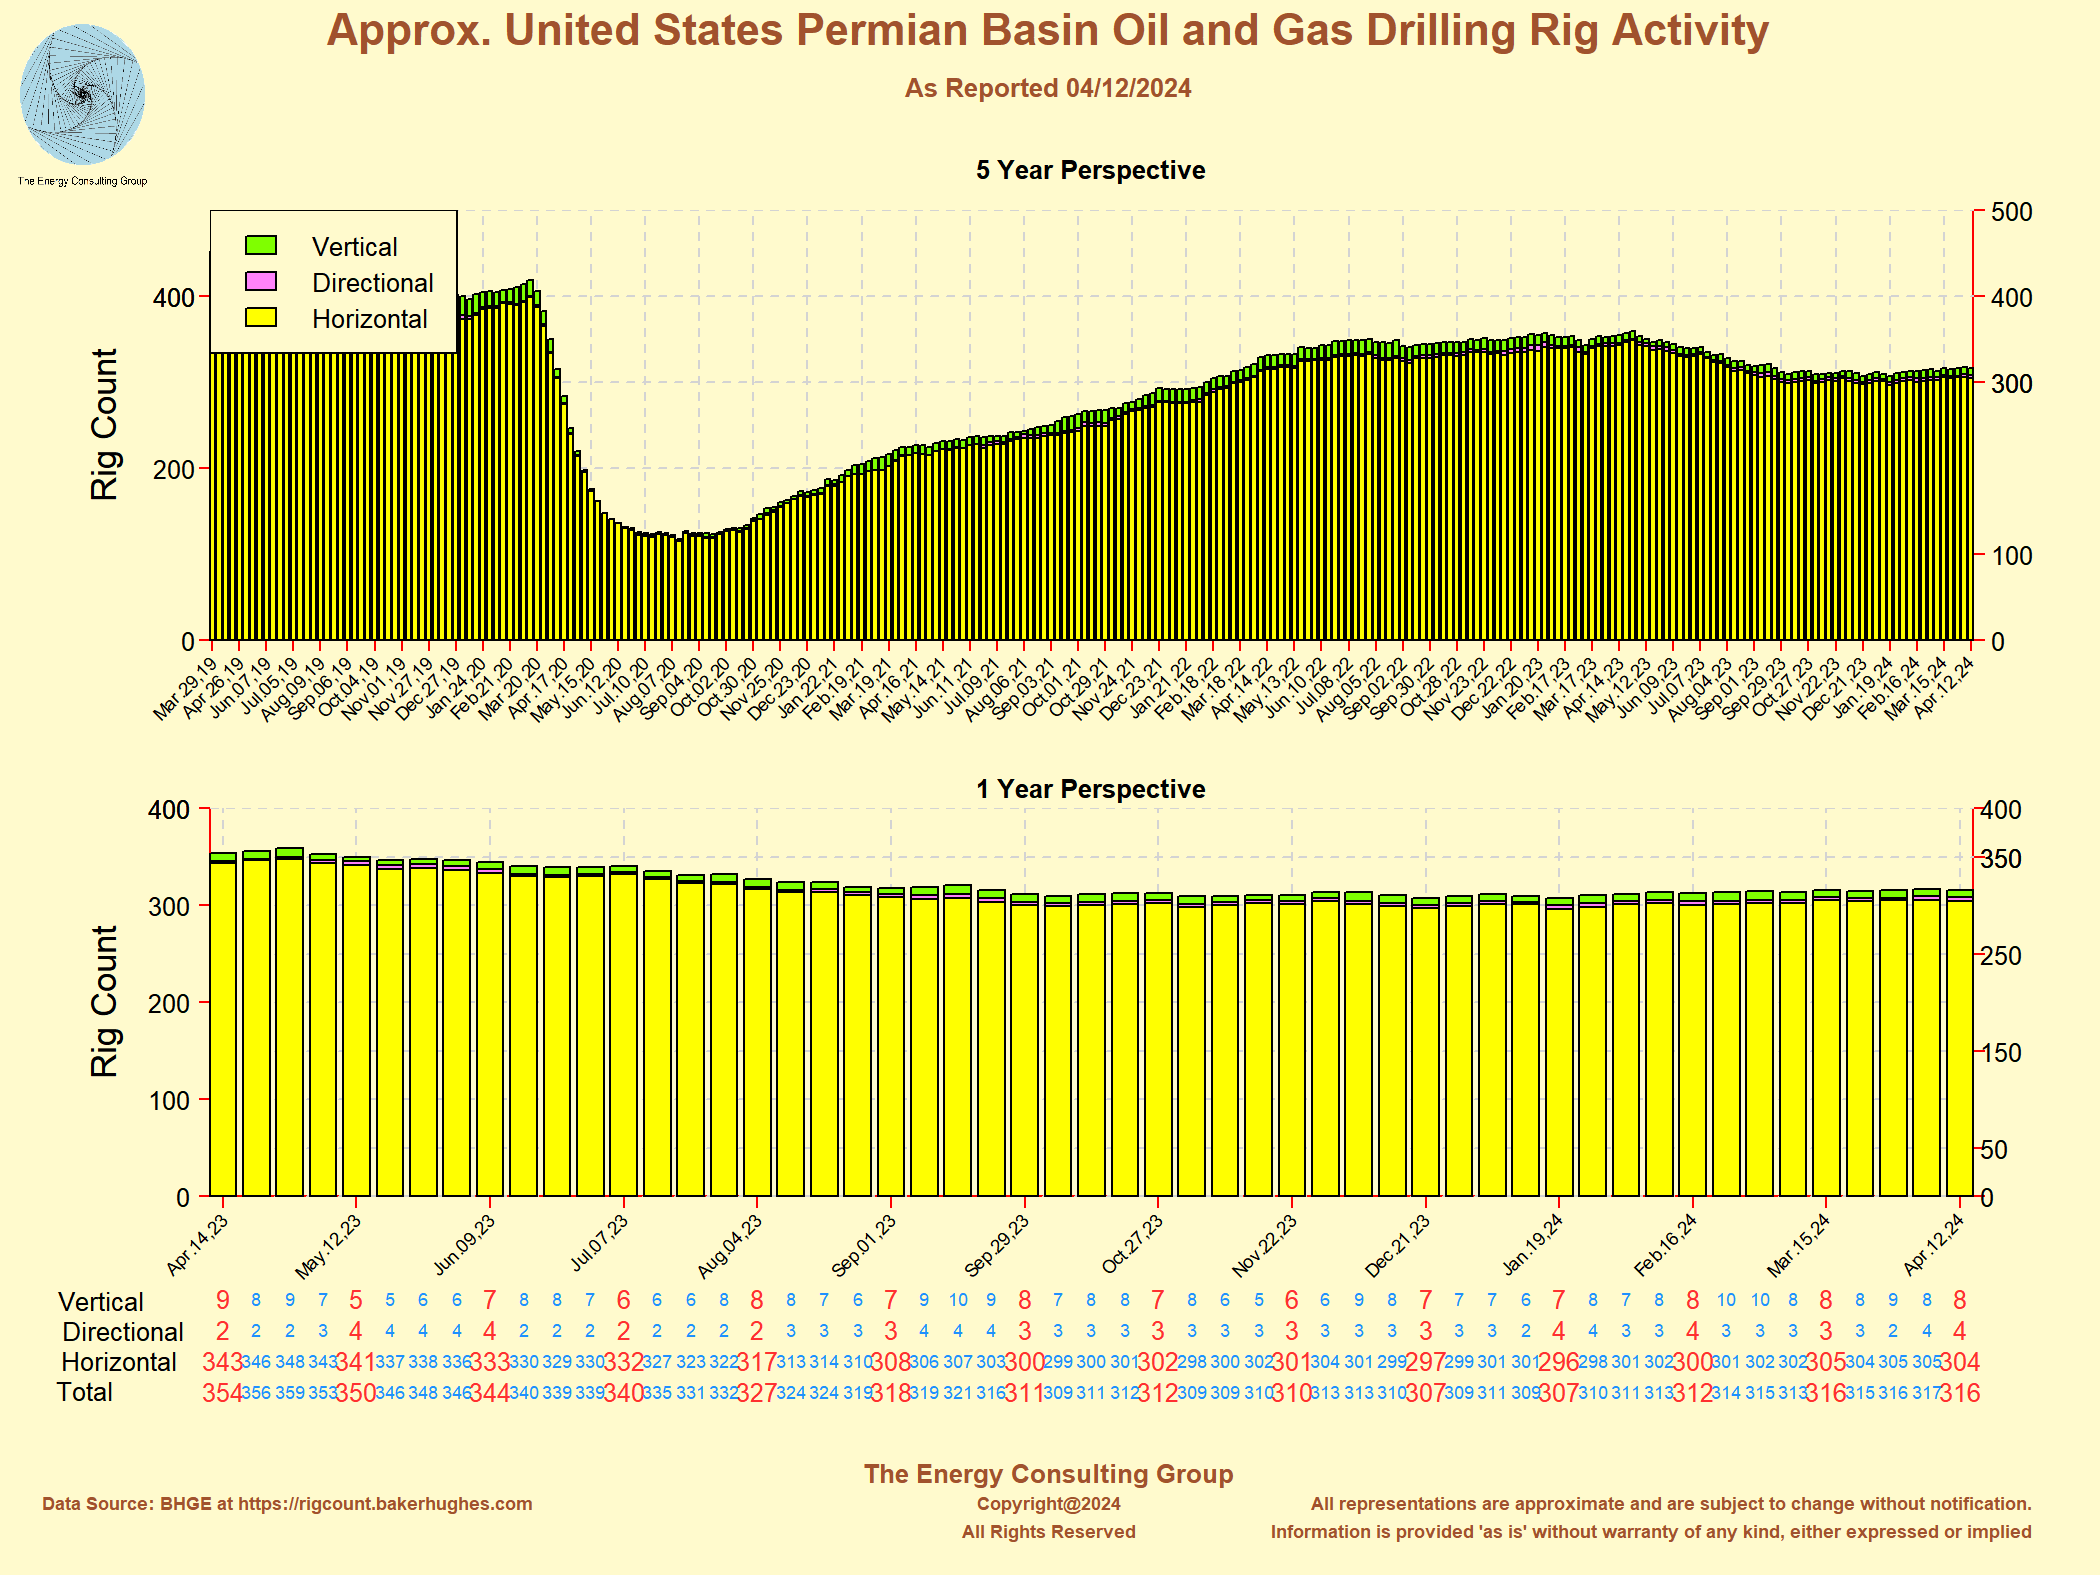 Click on the image for larger, higher resolution version. |
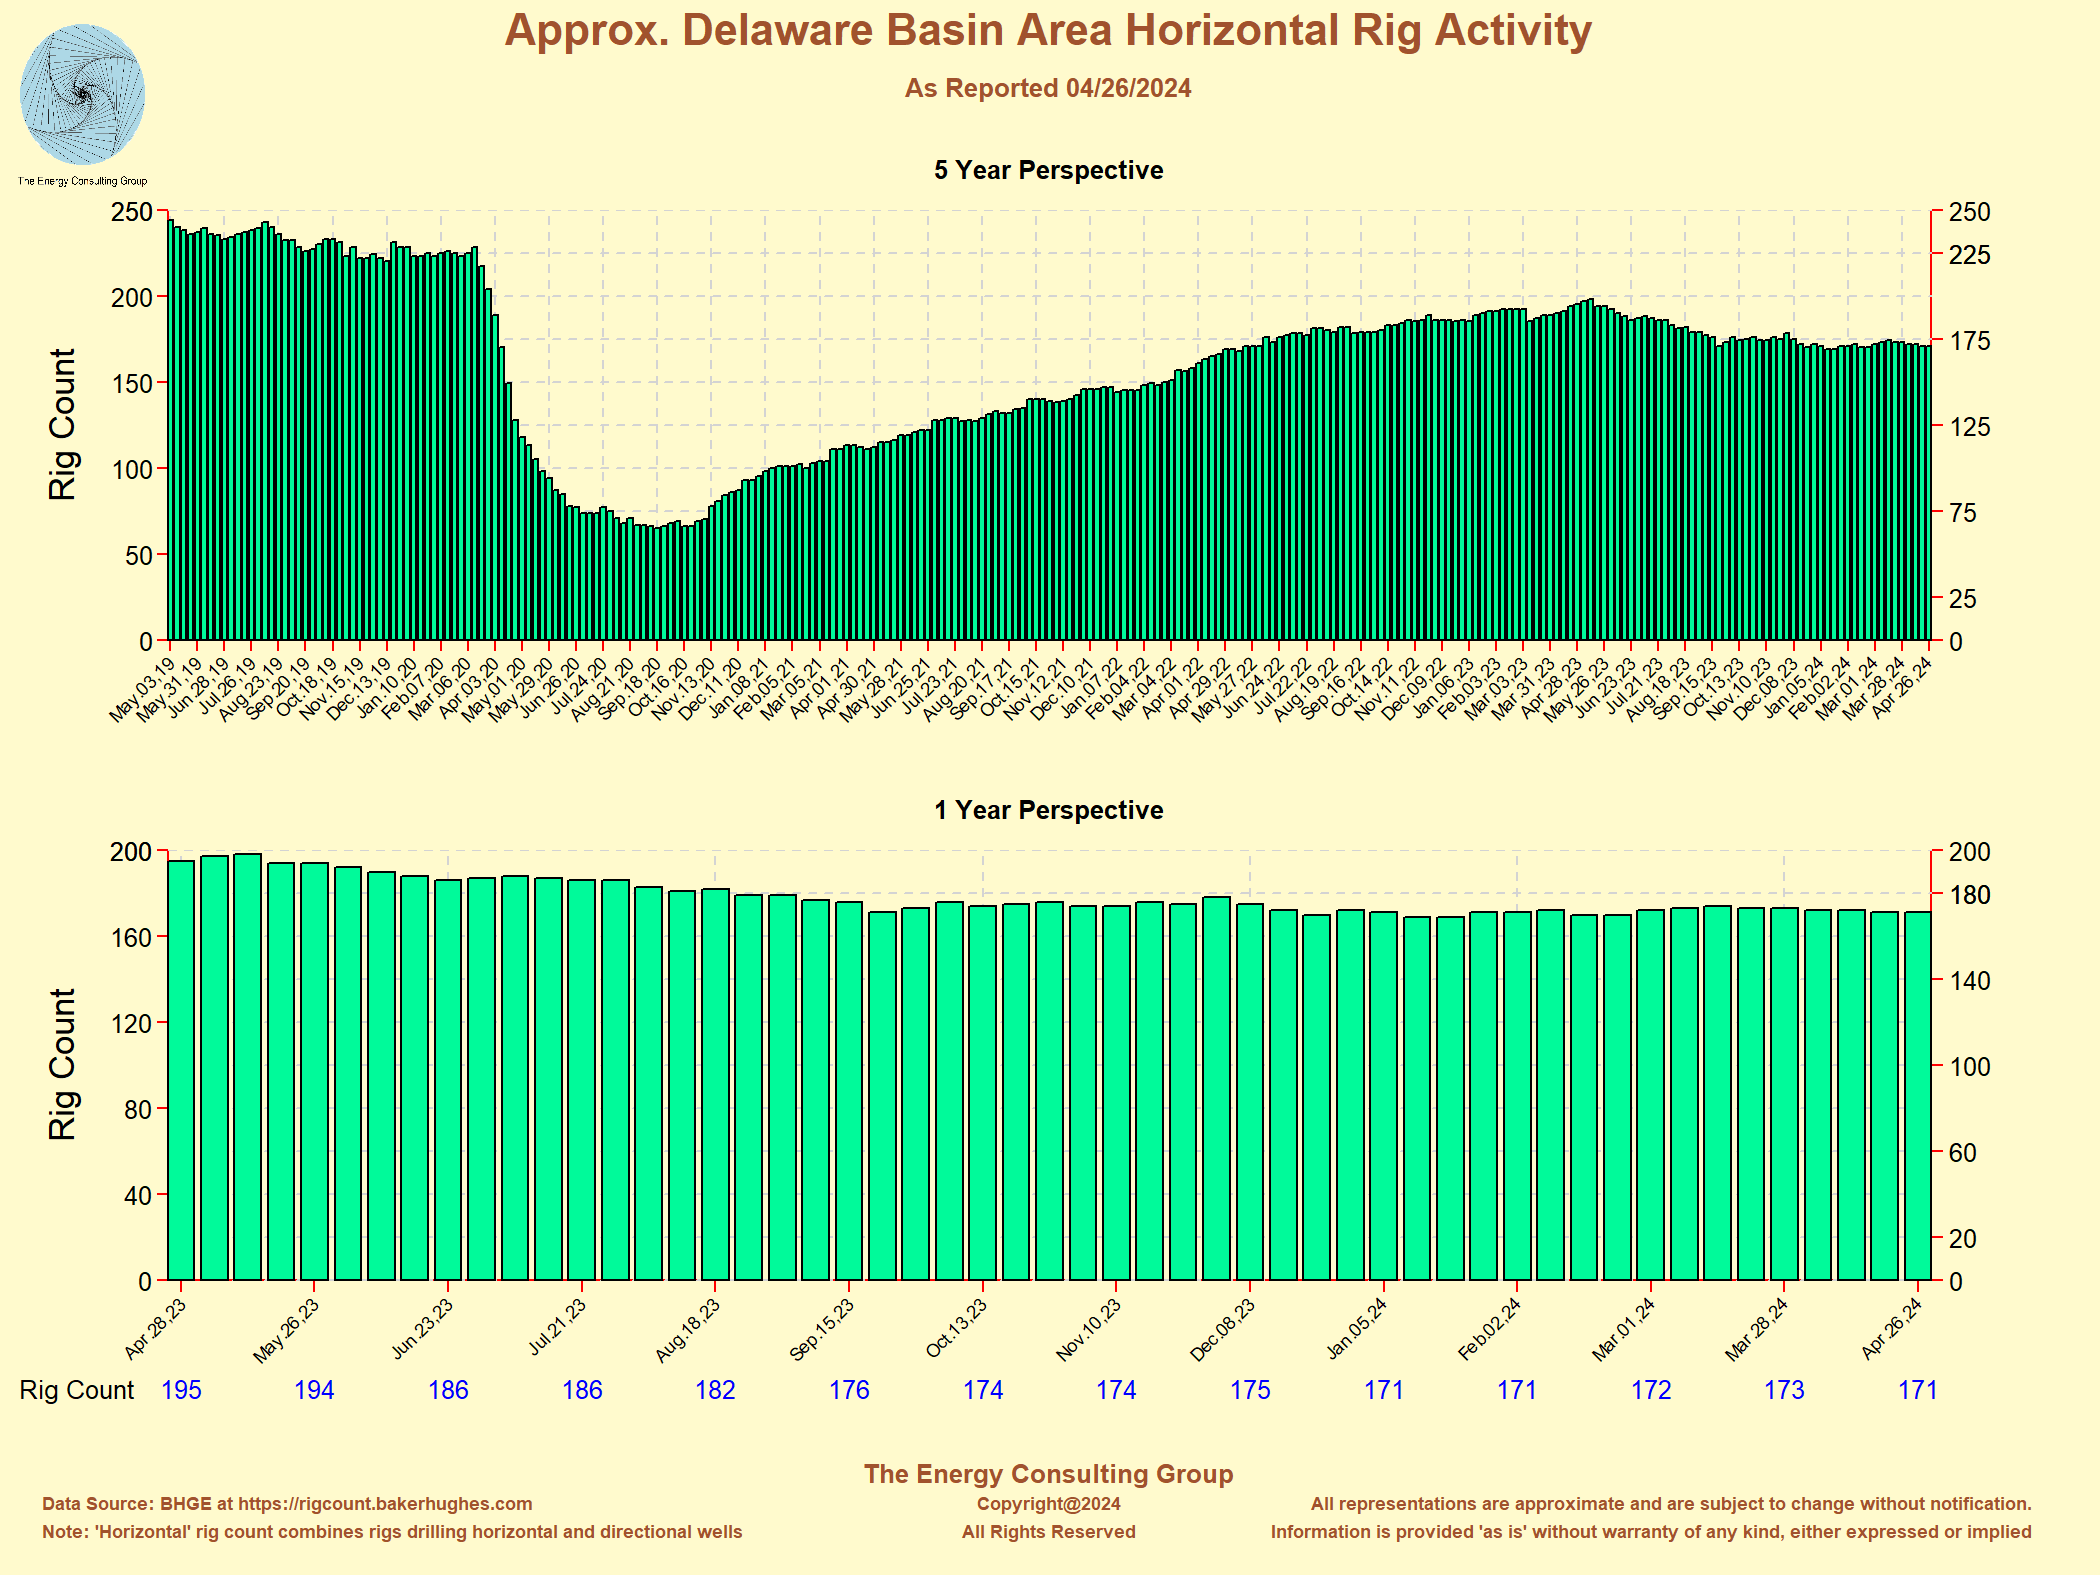
Approximate Delaware Basin
Oil and Gas Drilling Rig Count Click on the image for larger, higher resolution version. |
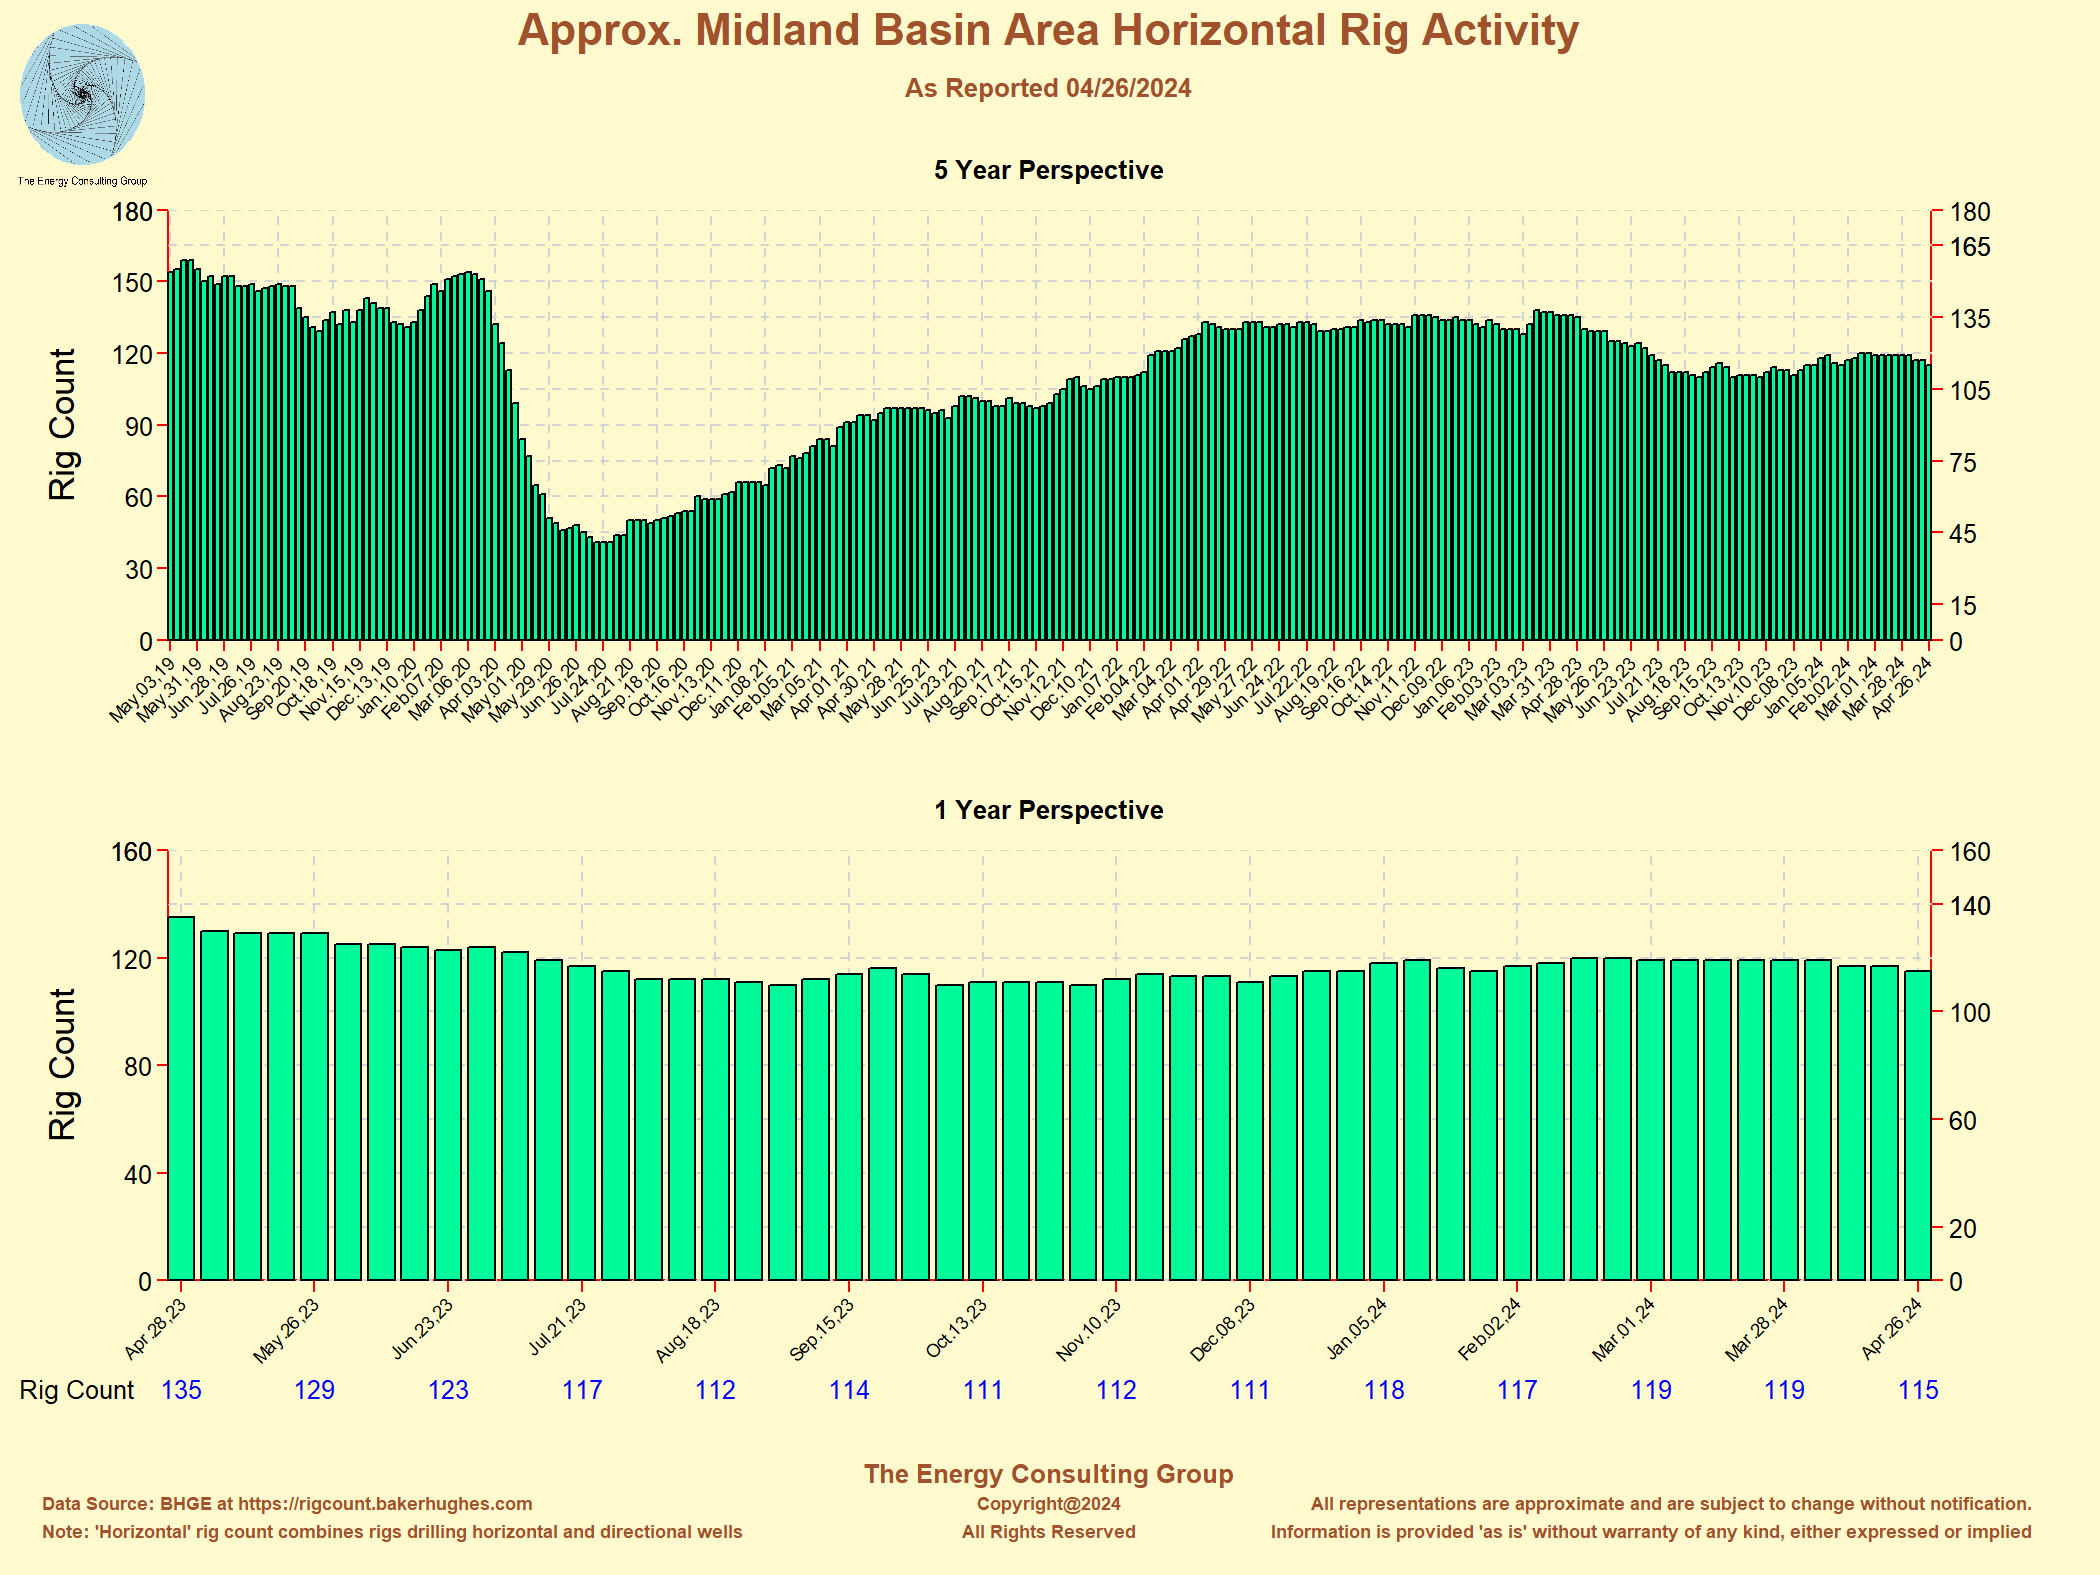
Approximate Midland Basin Oil and Gas Drilling Rig Count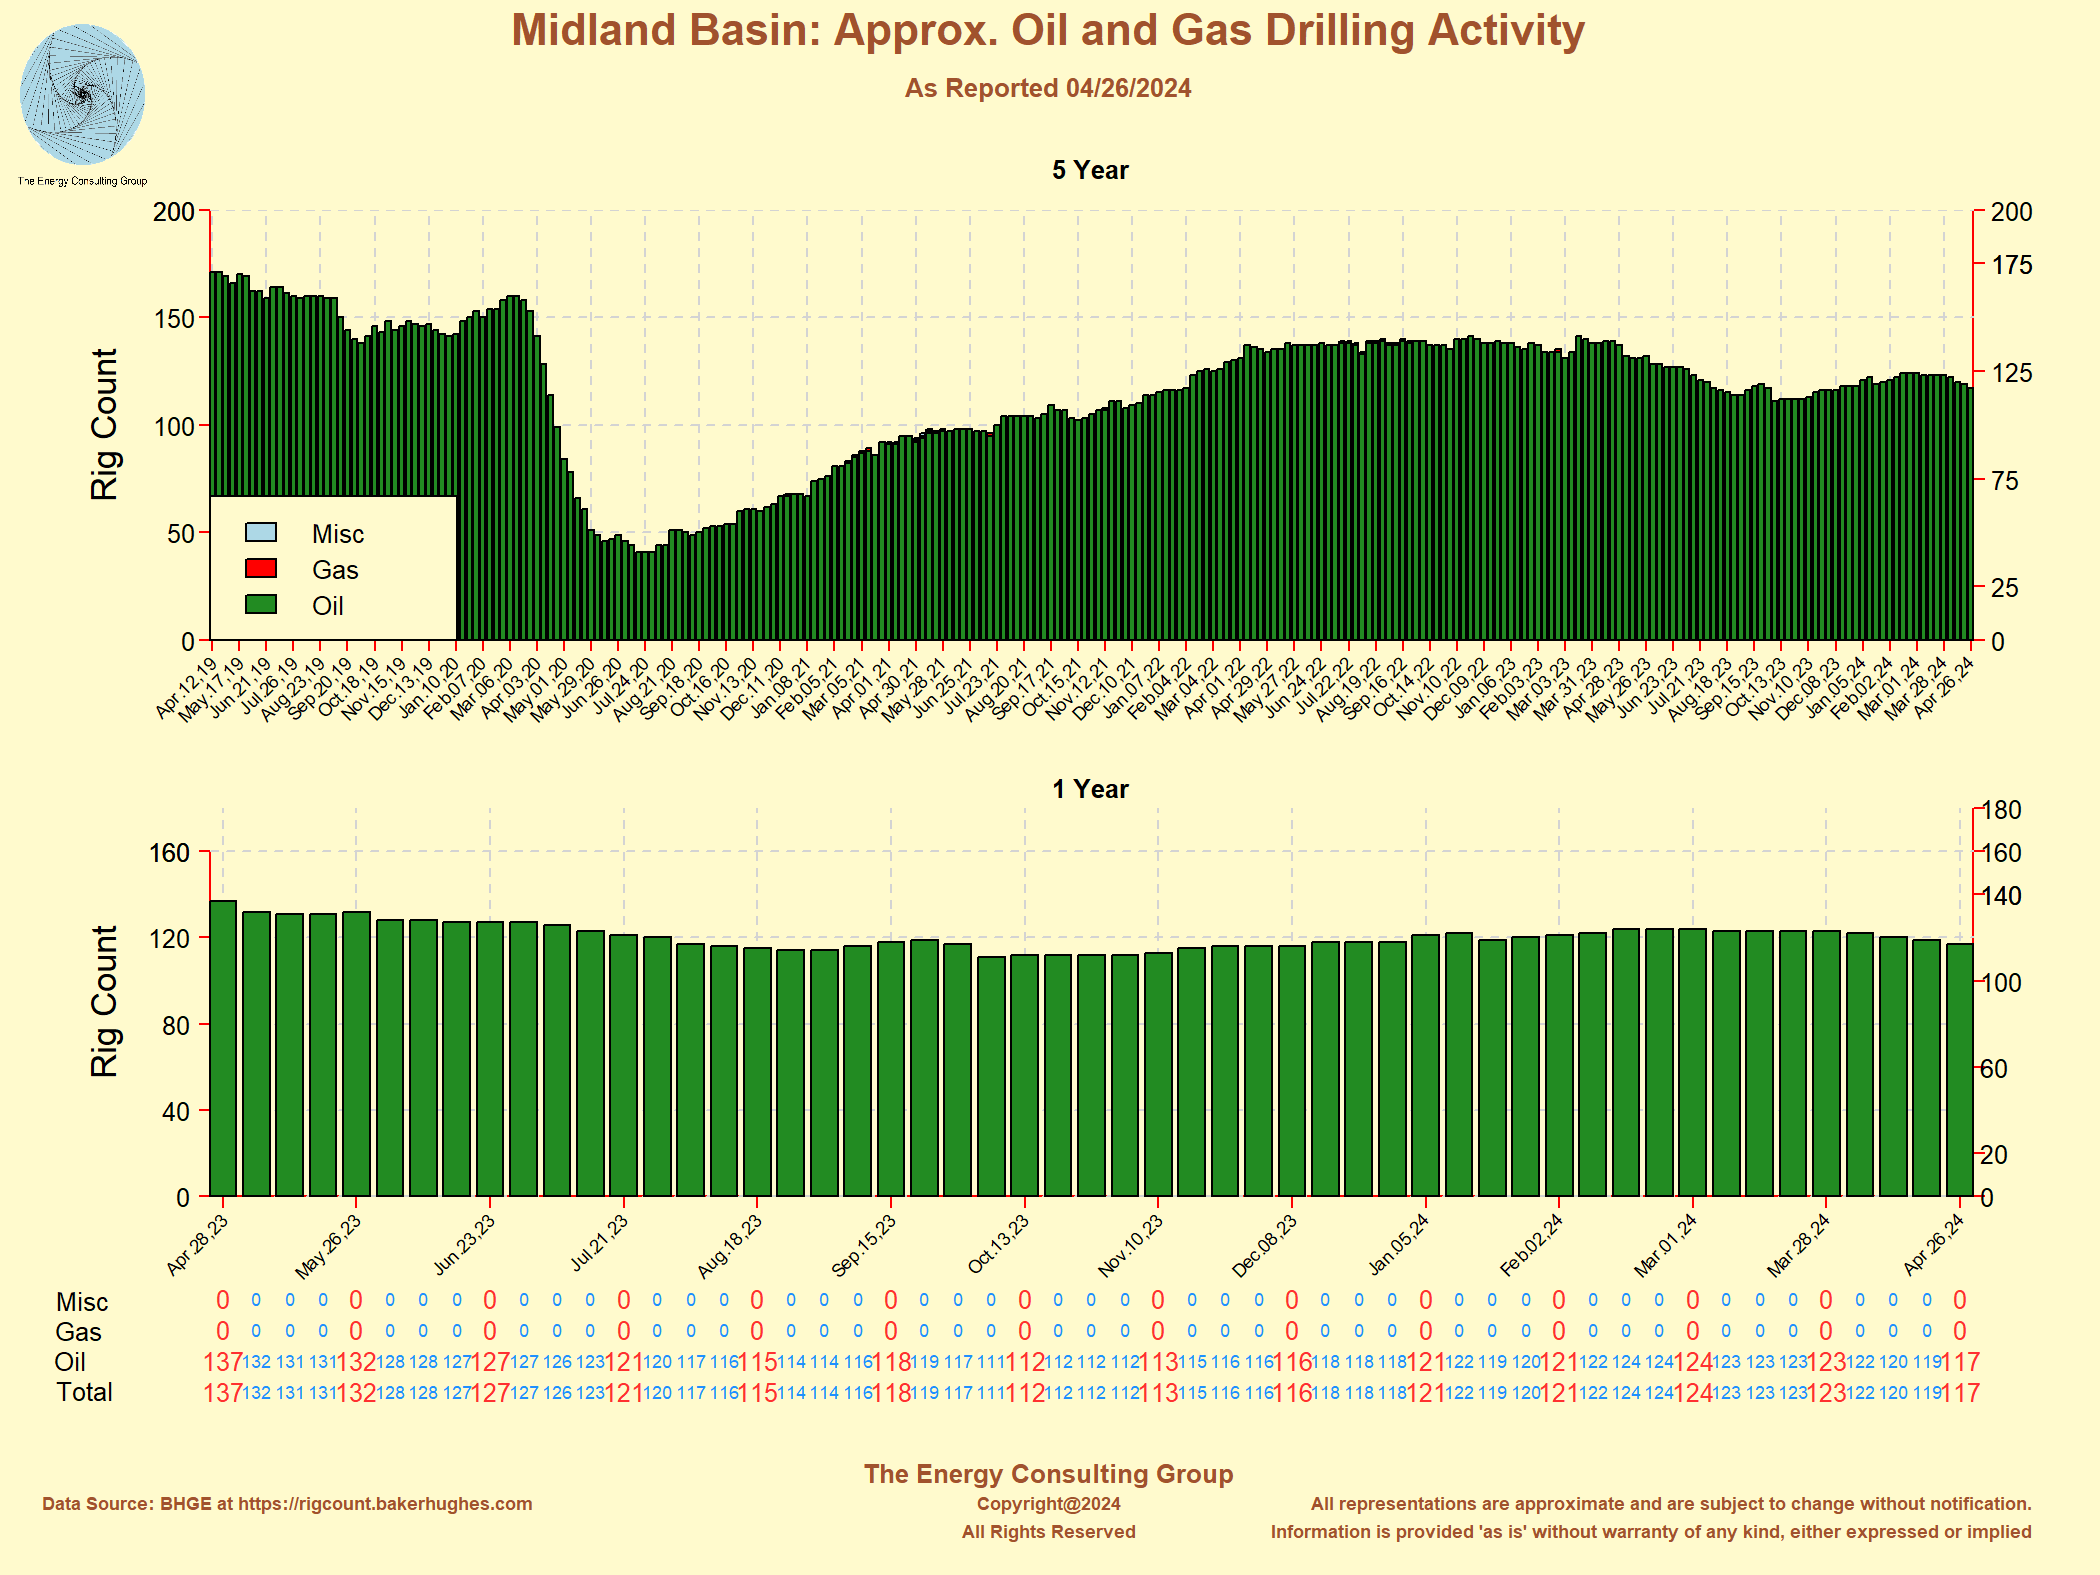 Click on the image for larger, higher resolution version. |
Approximate Central Carbonate Platform Oil and Gas Drilling Rig Count Click on the image for larger, higher resolution version. |
Progression of Permian Basin Rig Activity: 2016-2019 (The numbers inside the county outlines represent the number of rigs activily drilling for oil/gas in that county during the listed time frame.)  |
Oil and Gas Drilling Rig Activity Map - Anadarko Basin Click on the image for larger, higher resolution version. |
|
E&P News and Information Scandinavian International and National International Energy
Agency Department of Trade and Norwegian
Petroleum Ministry of Industry
and E&P Project Information |
|---|