The Energy Consulting Group
Management consultants for upstream oil and gas producers and service companies
Our focus is to work with management teams to develop and
implement business strategies that are practical, sustainable and allow
organizations to achieve their full potential. Our consultants have
long histories of working closely with senior executive teams of
firms of all sizes to help their companies not only be successful,
but achieve performance that stands out relative to
peers.
.
Contact us at insight@energy-cg.com to
find out how we can help you.
| Oil Supply/Demand Fundamentals |
US Crude Oil Inventory
|
2022 US Crude Oil Inventory Levels Compared With 5 Year History  Click on the image for full size version |
US Crude Oil Cross Year Comparison of Inventory Changes for
Specific Weeks in the Inventory Cycle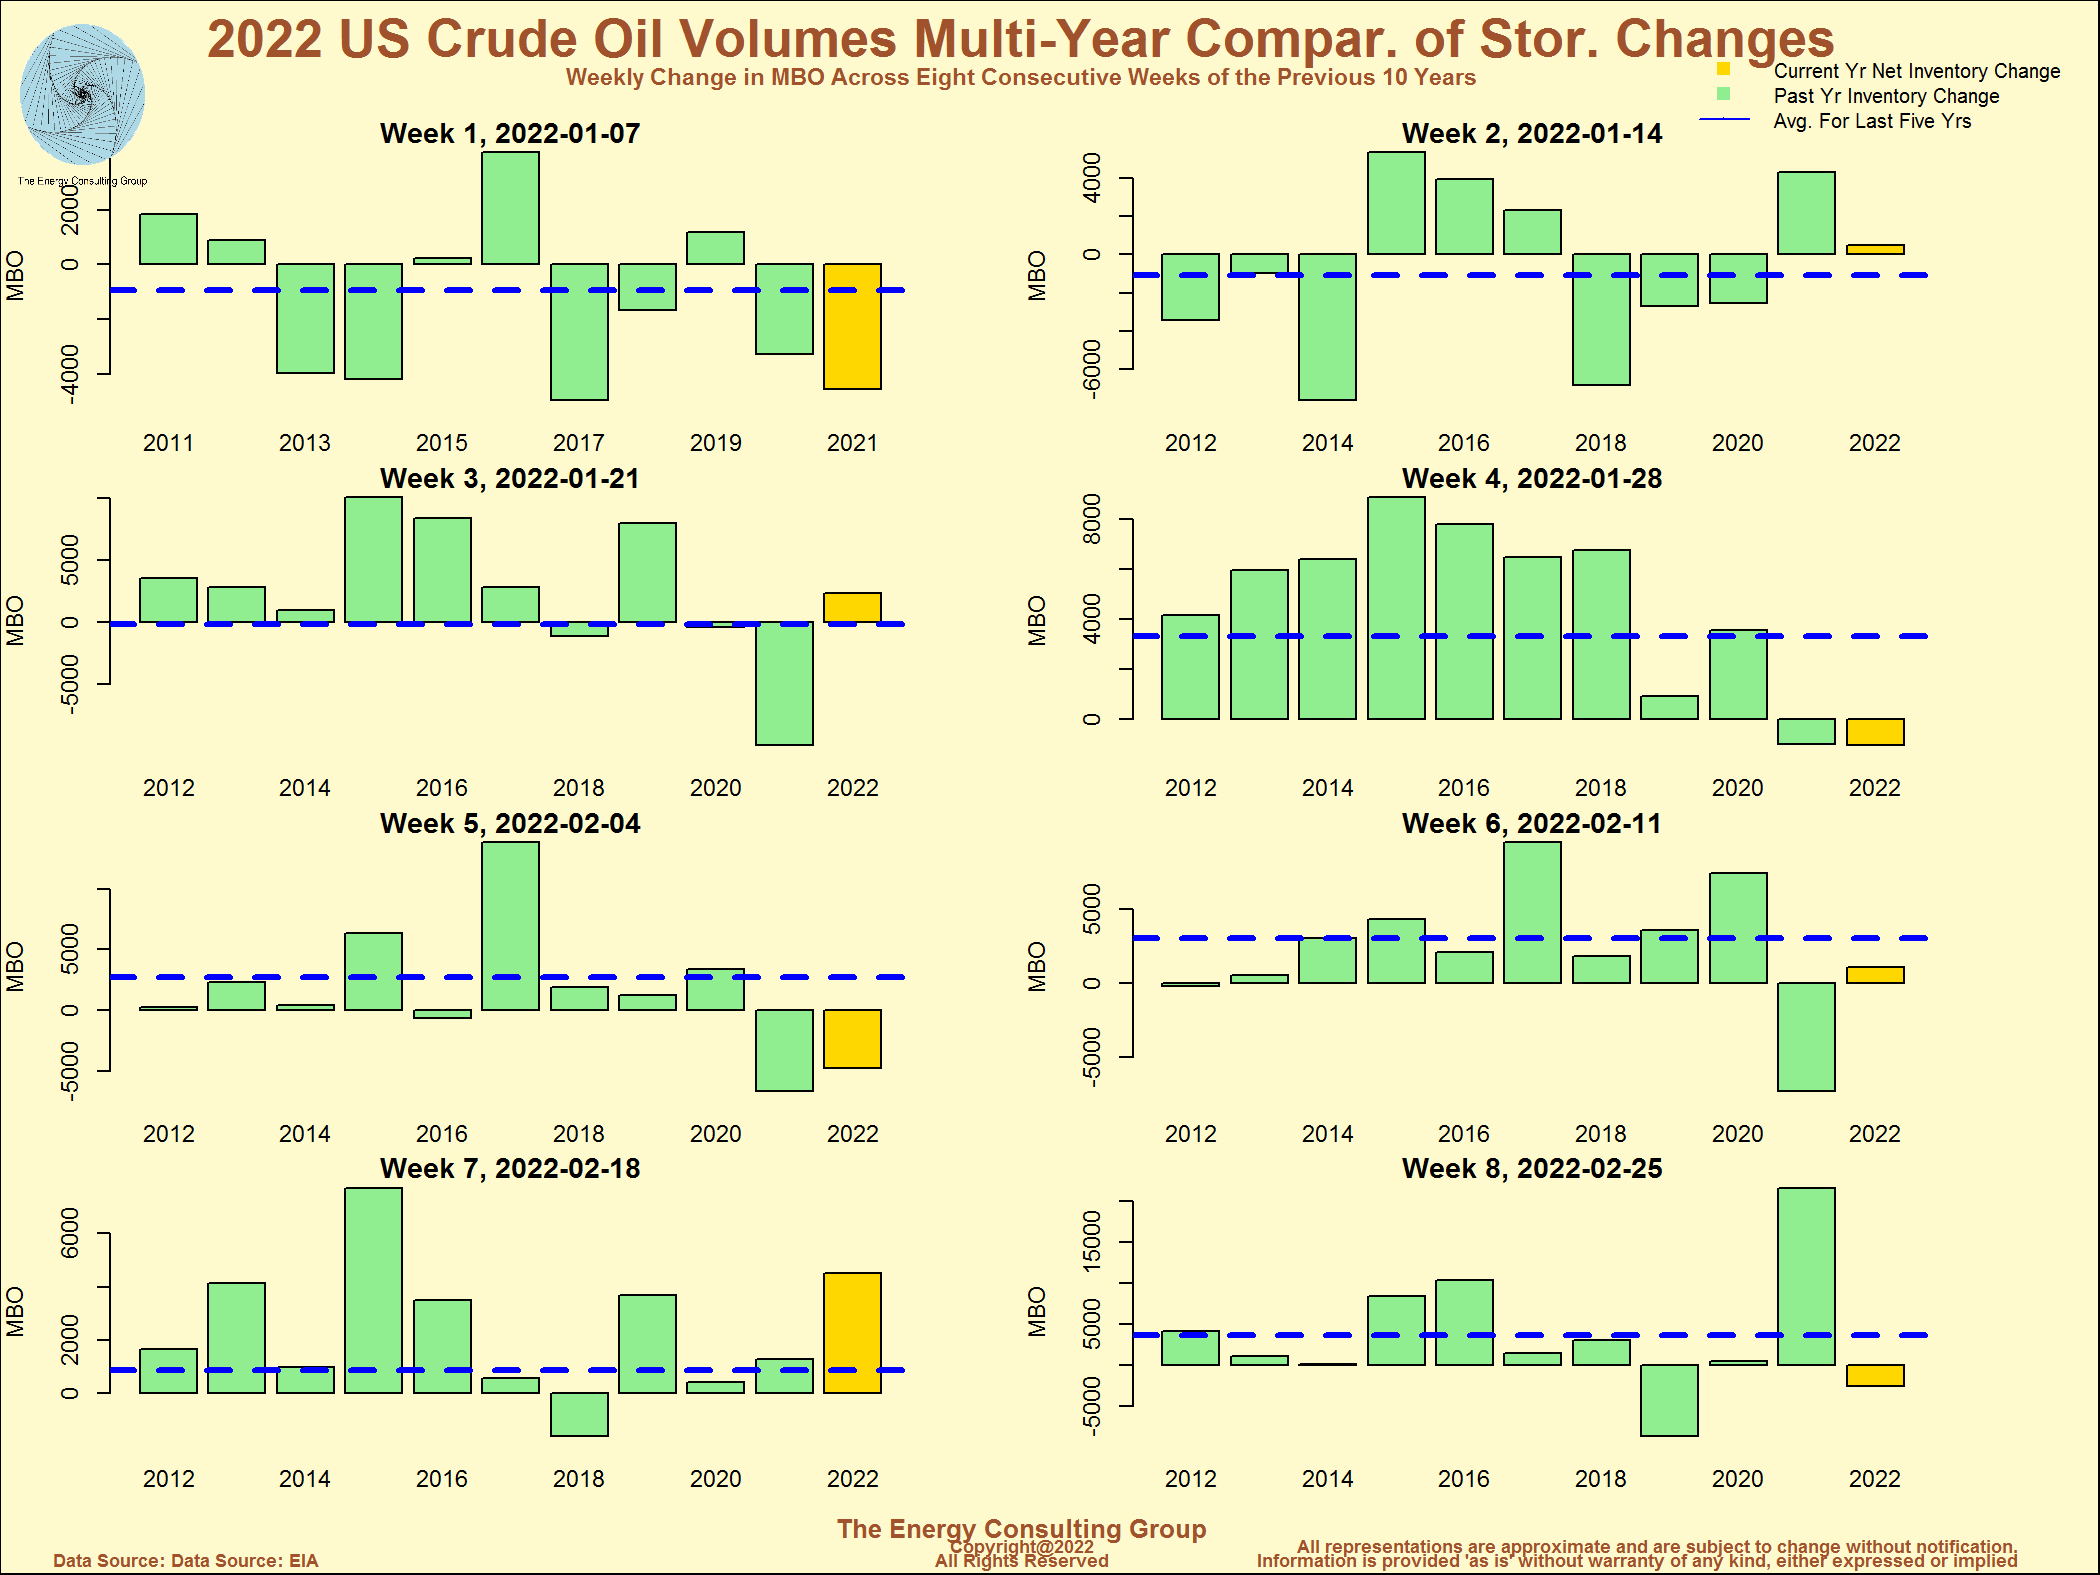 Click on the image for full size version |
WTI Oil Price at Cushing: 1 Year Perspective 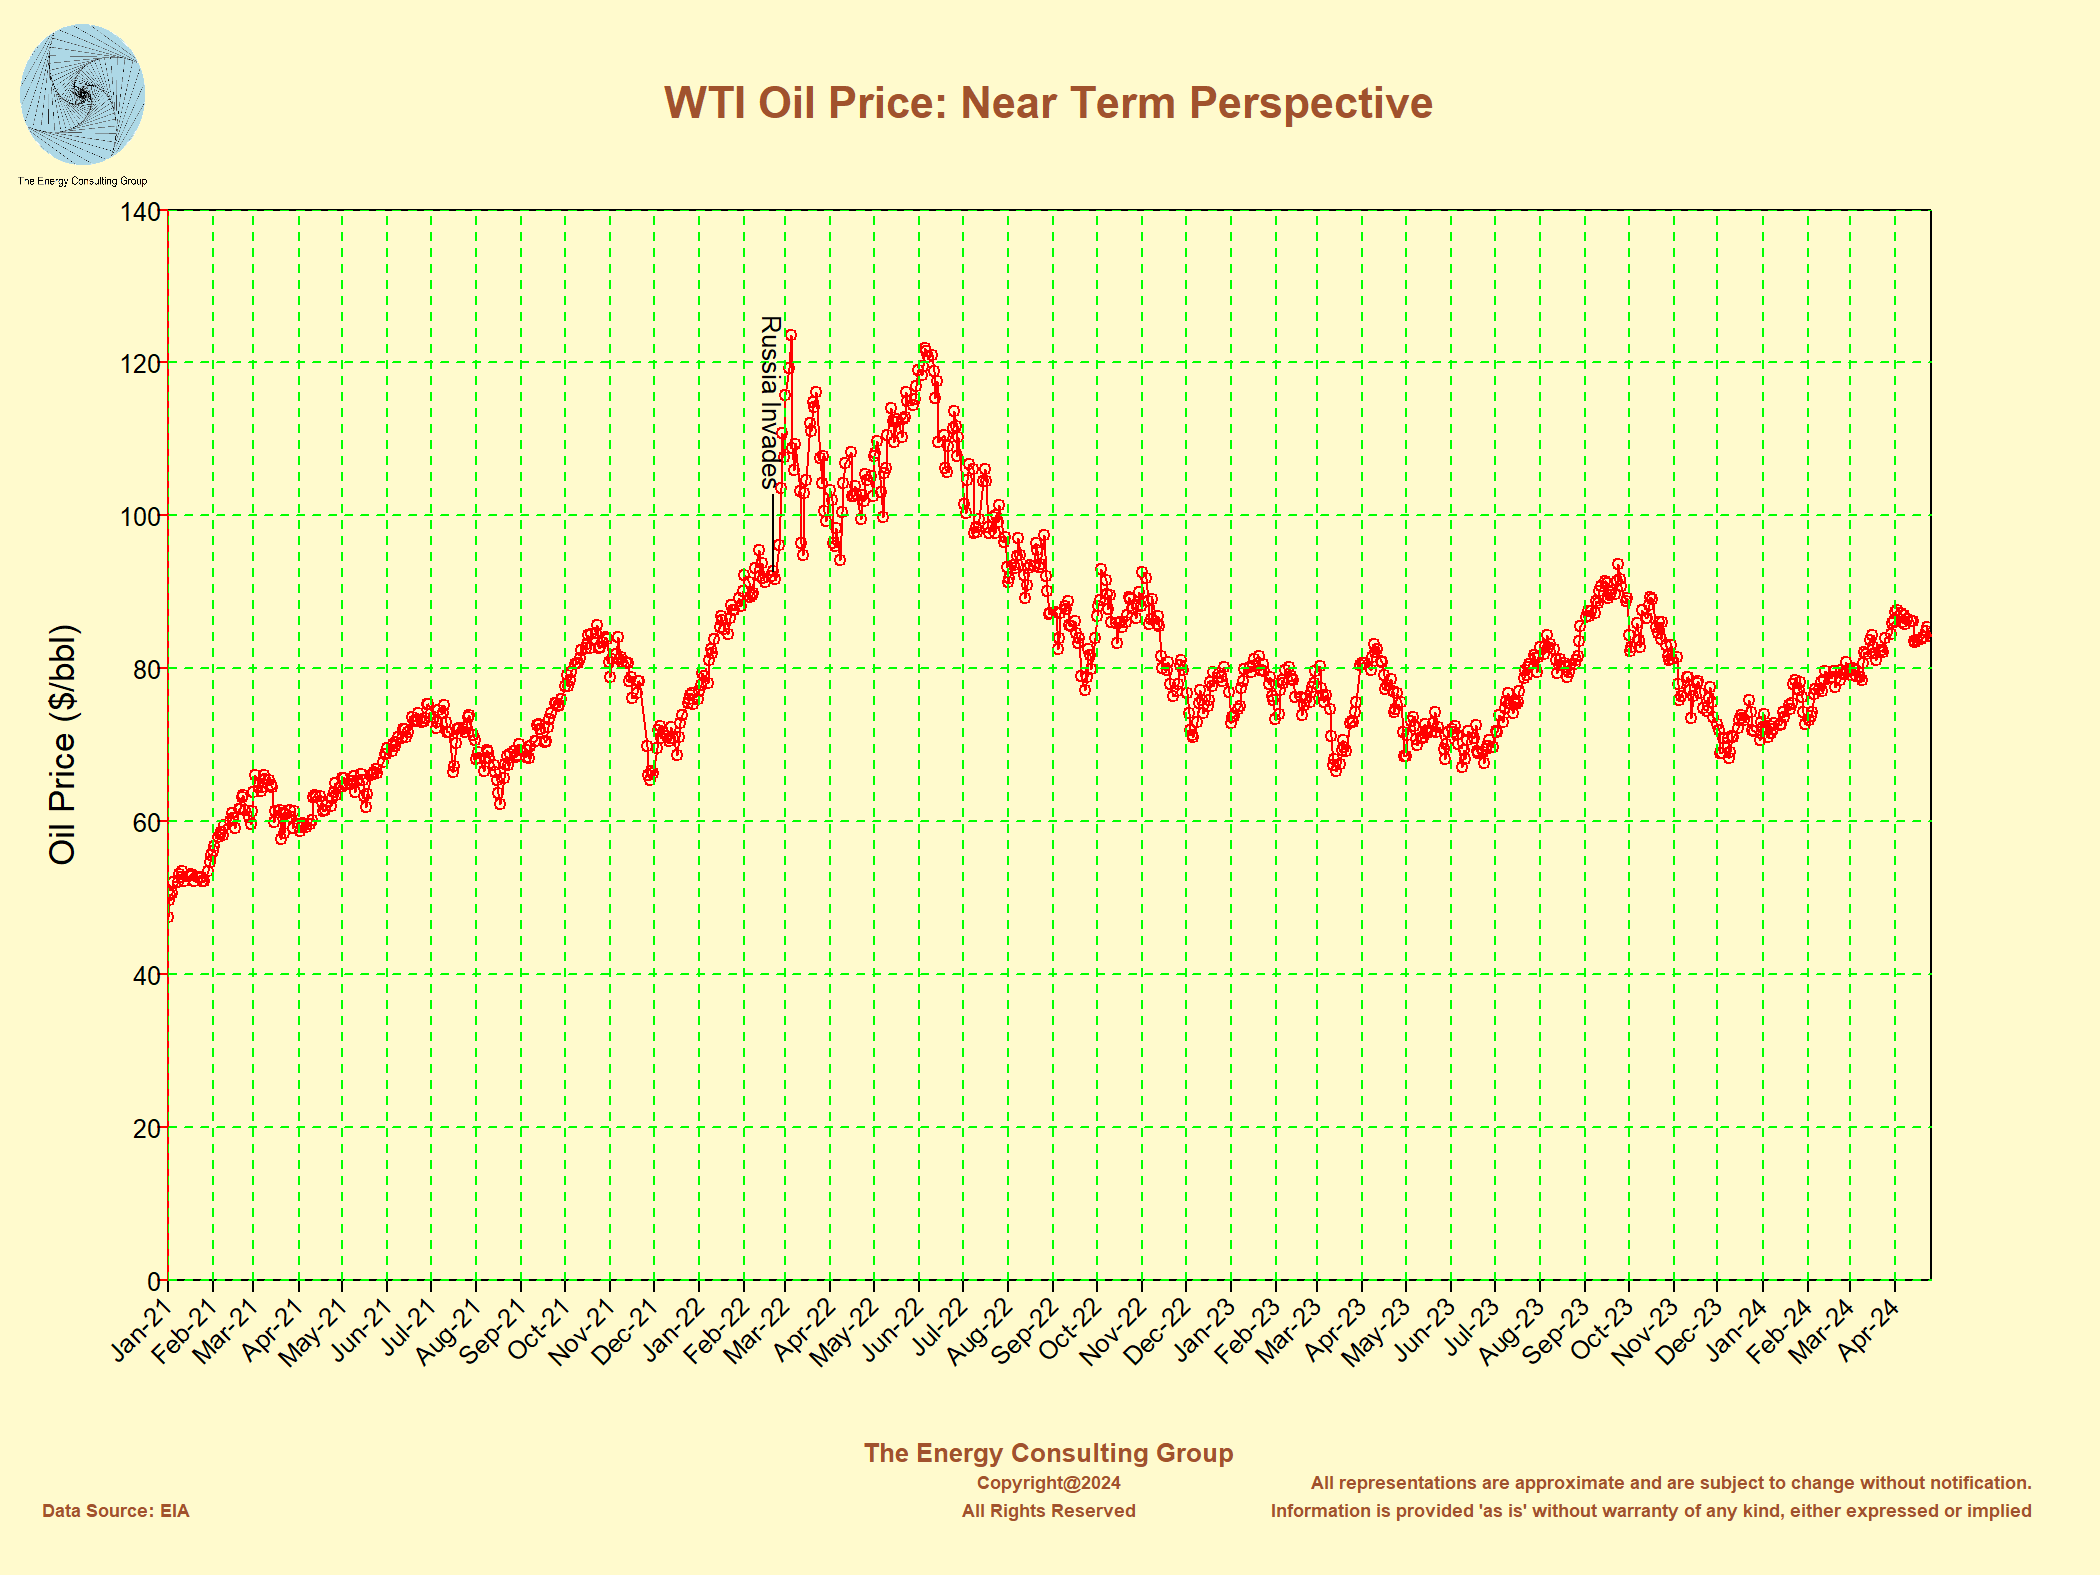 Click on the image for full size version |
US Oil Production
US Daily Oil Production as Reported Weekly by the EIA
on 1 year and 5 year Timeframes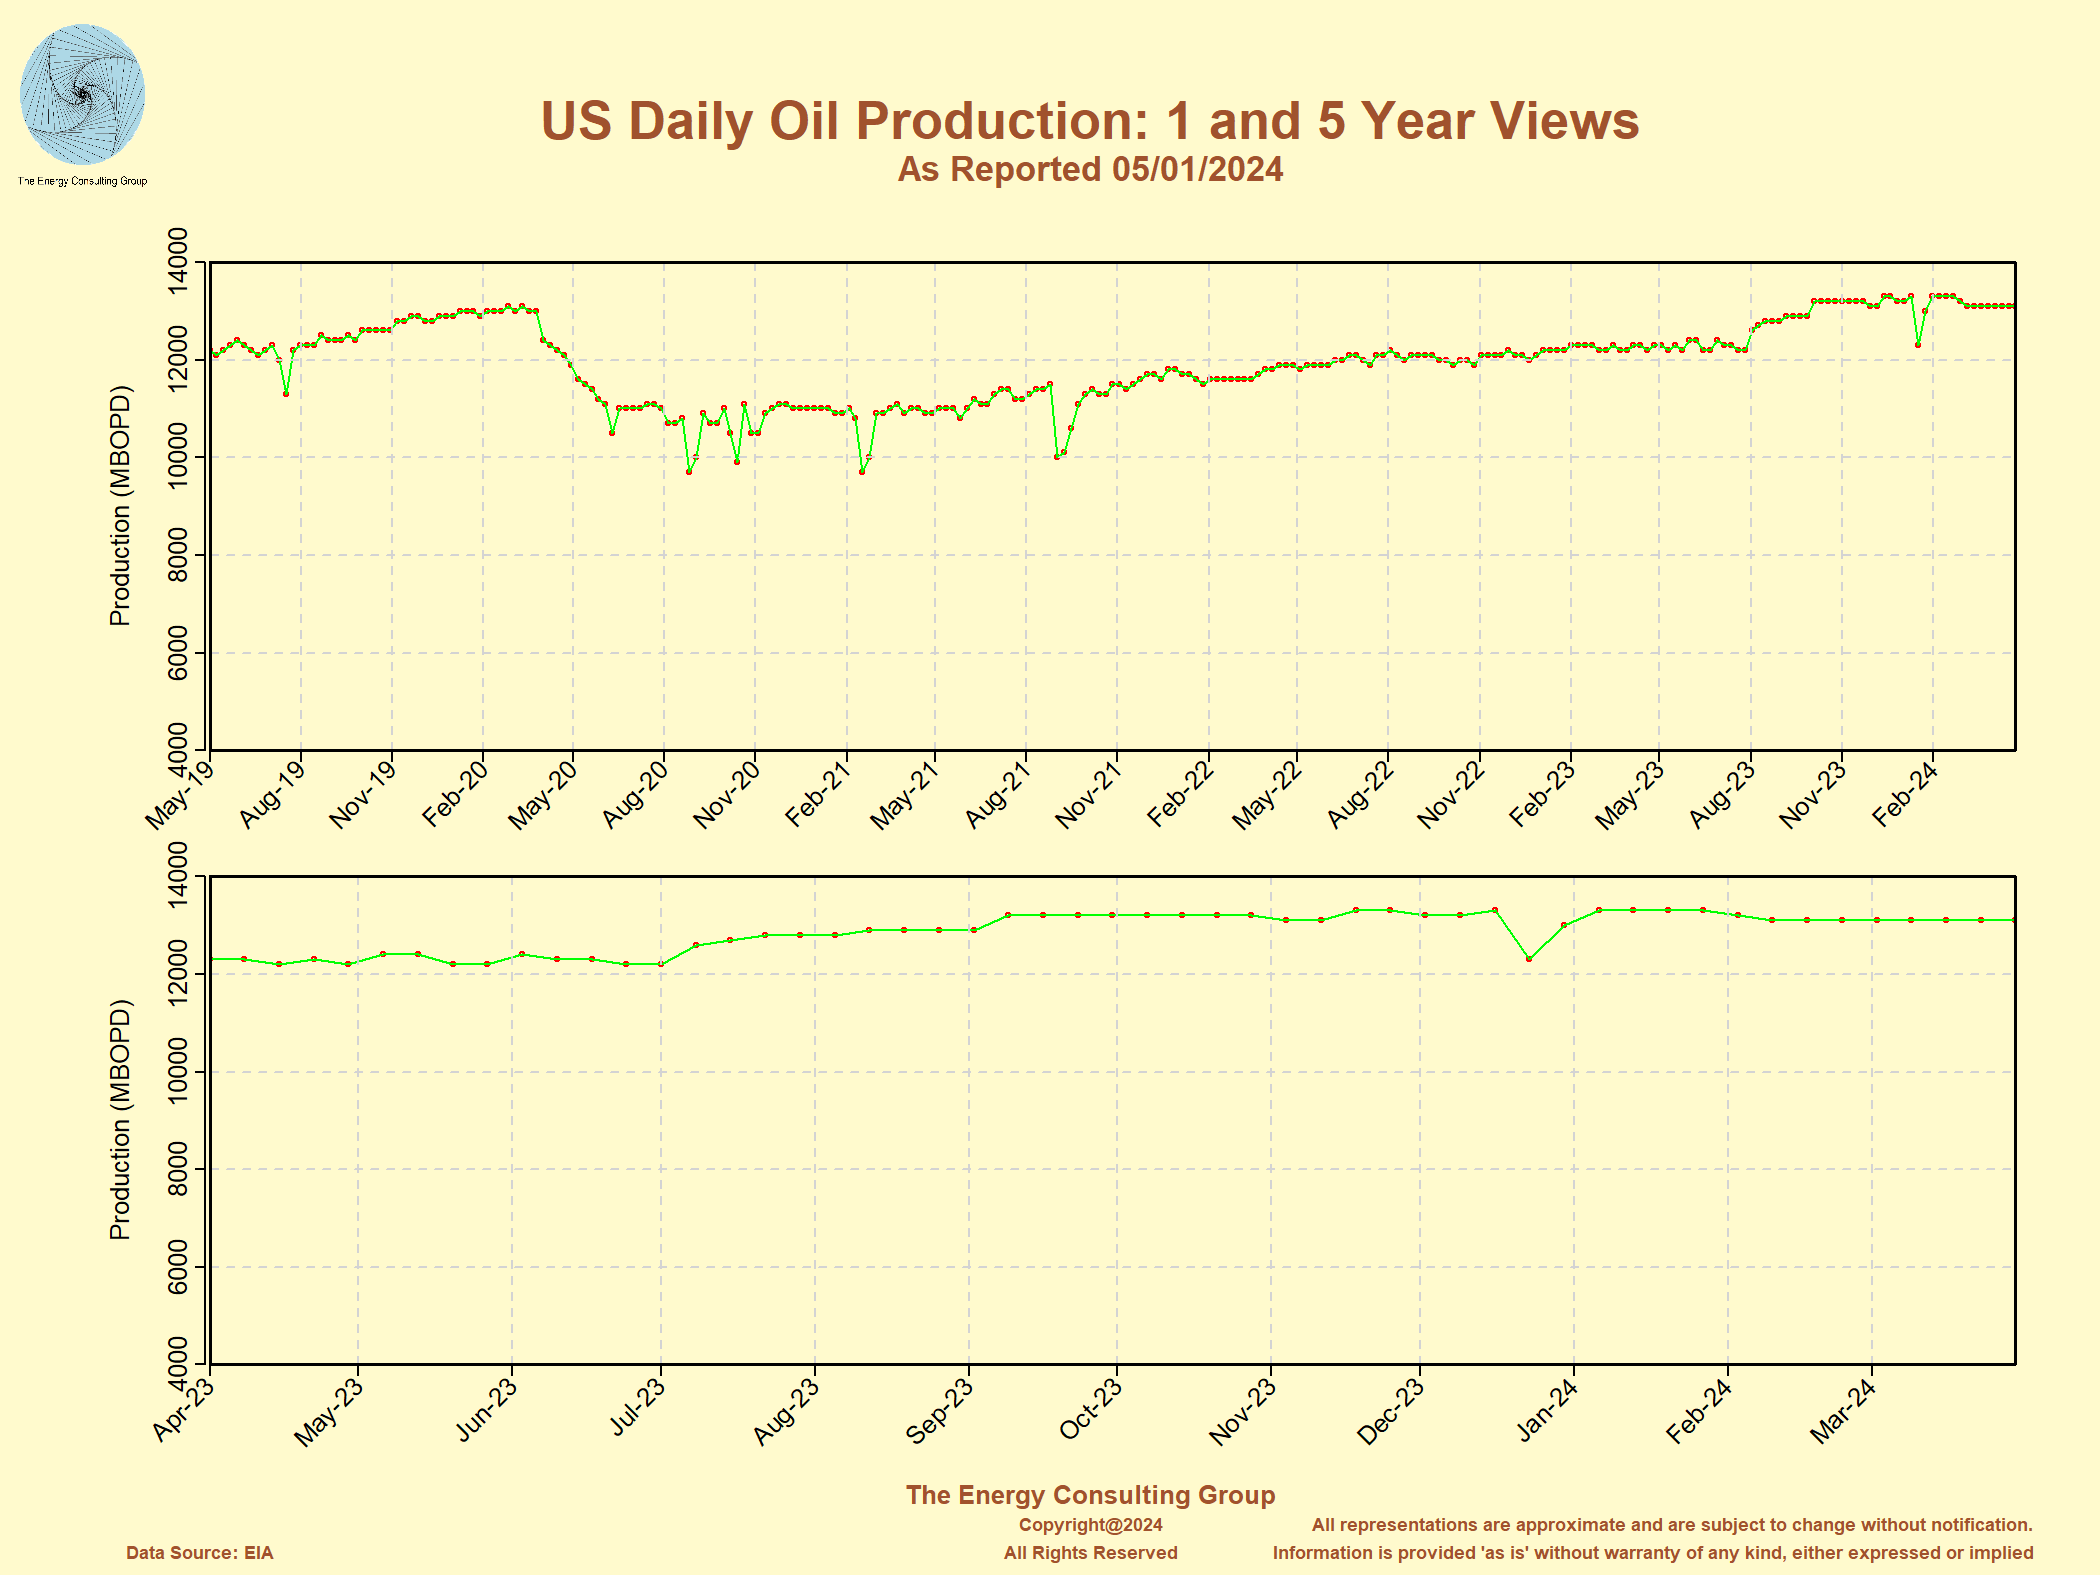 Click on the image for full size version |
US Daily Oil Production as Reported Weekly by the EIA
on 10 year and 40 year Timeframes (Note: Between October, 2019 and March 2020, the US was producing more oil per day than any other country had in history, including the USSR) 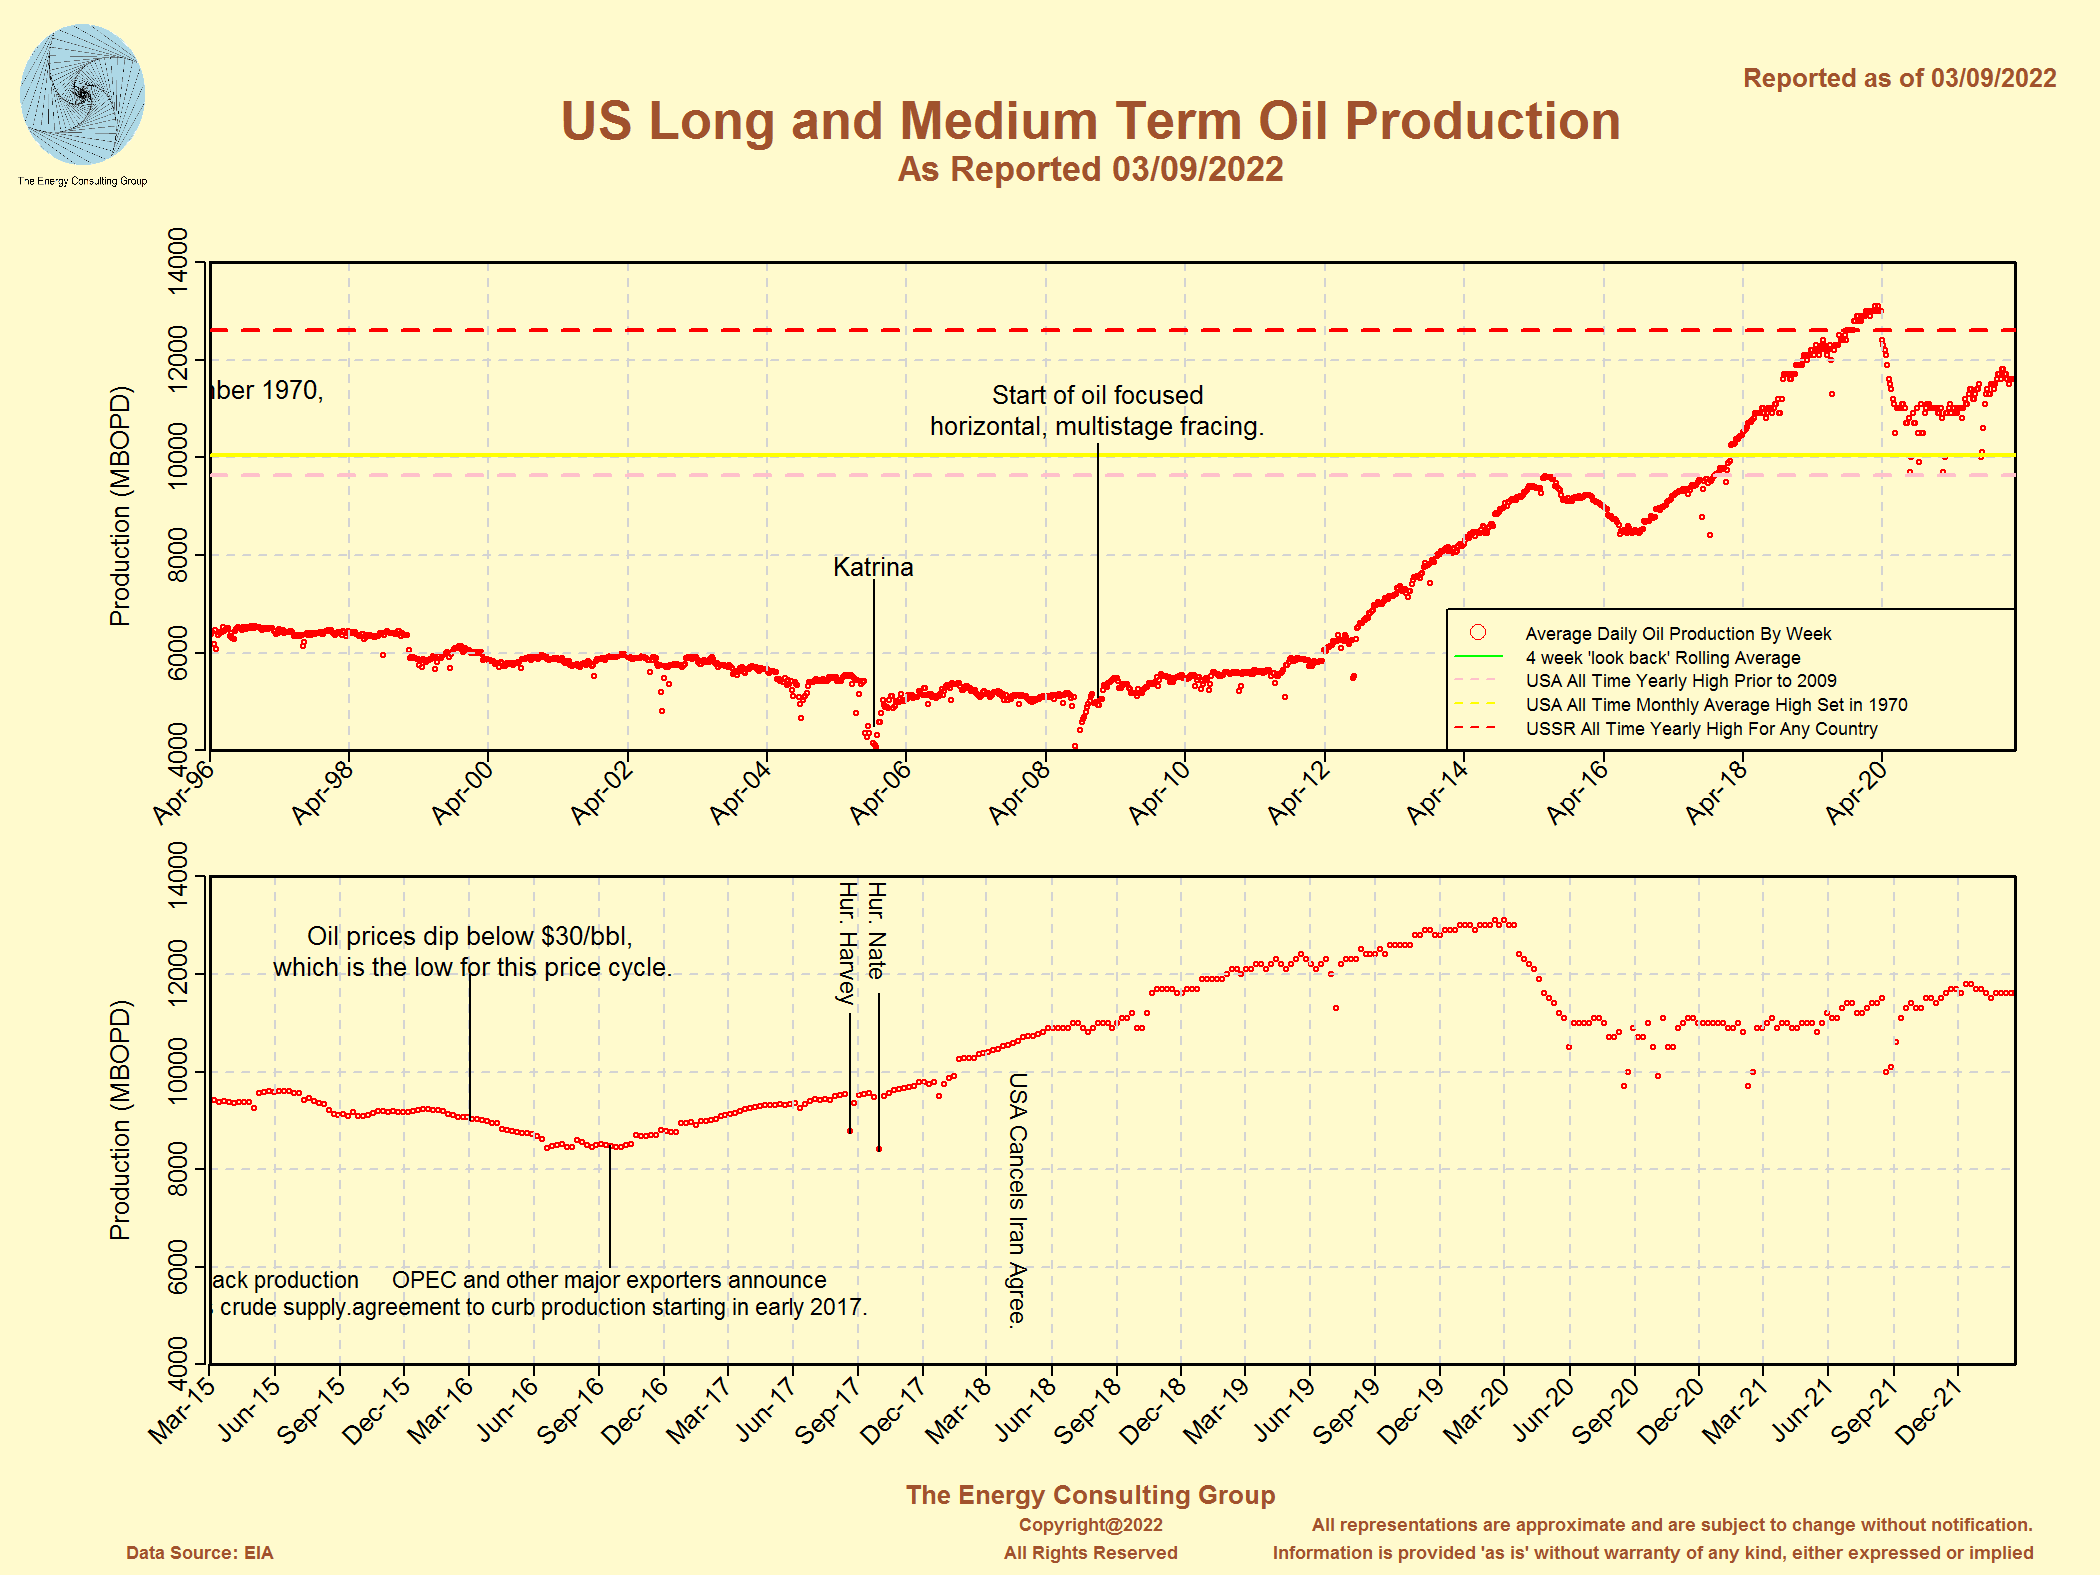 Click on the image for full size version |
Reported Oil Production for Main Non-Conventional Oil Regions Click on the image for full size version |
USA Gulf of Mexico Production - Federal Waters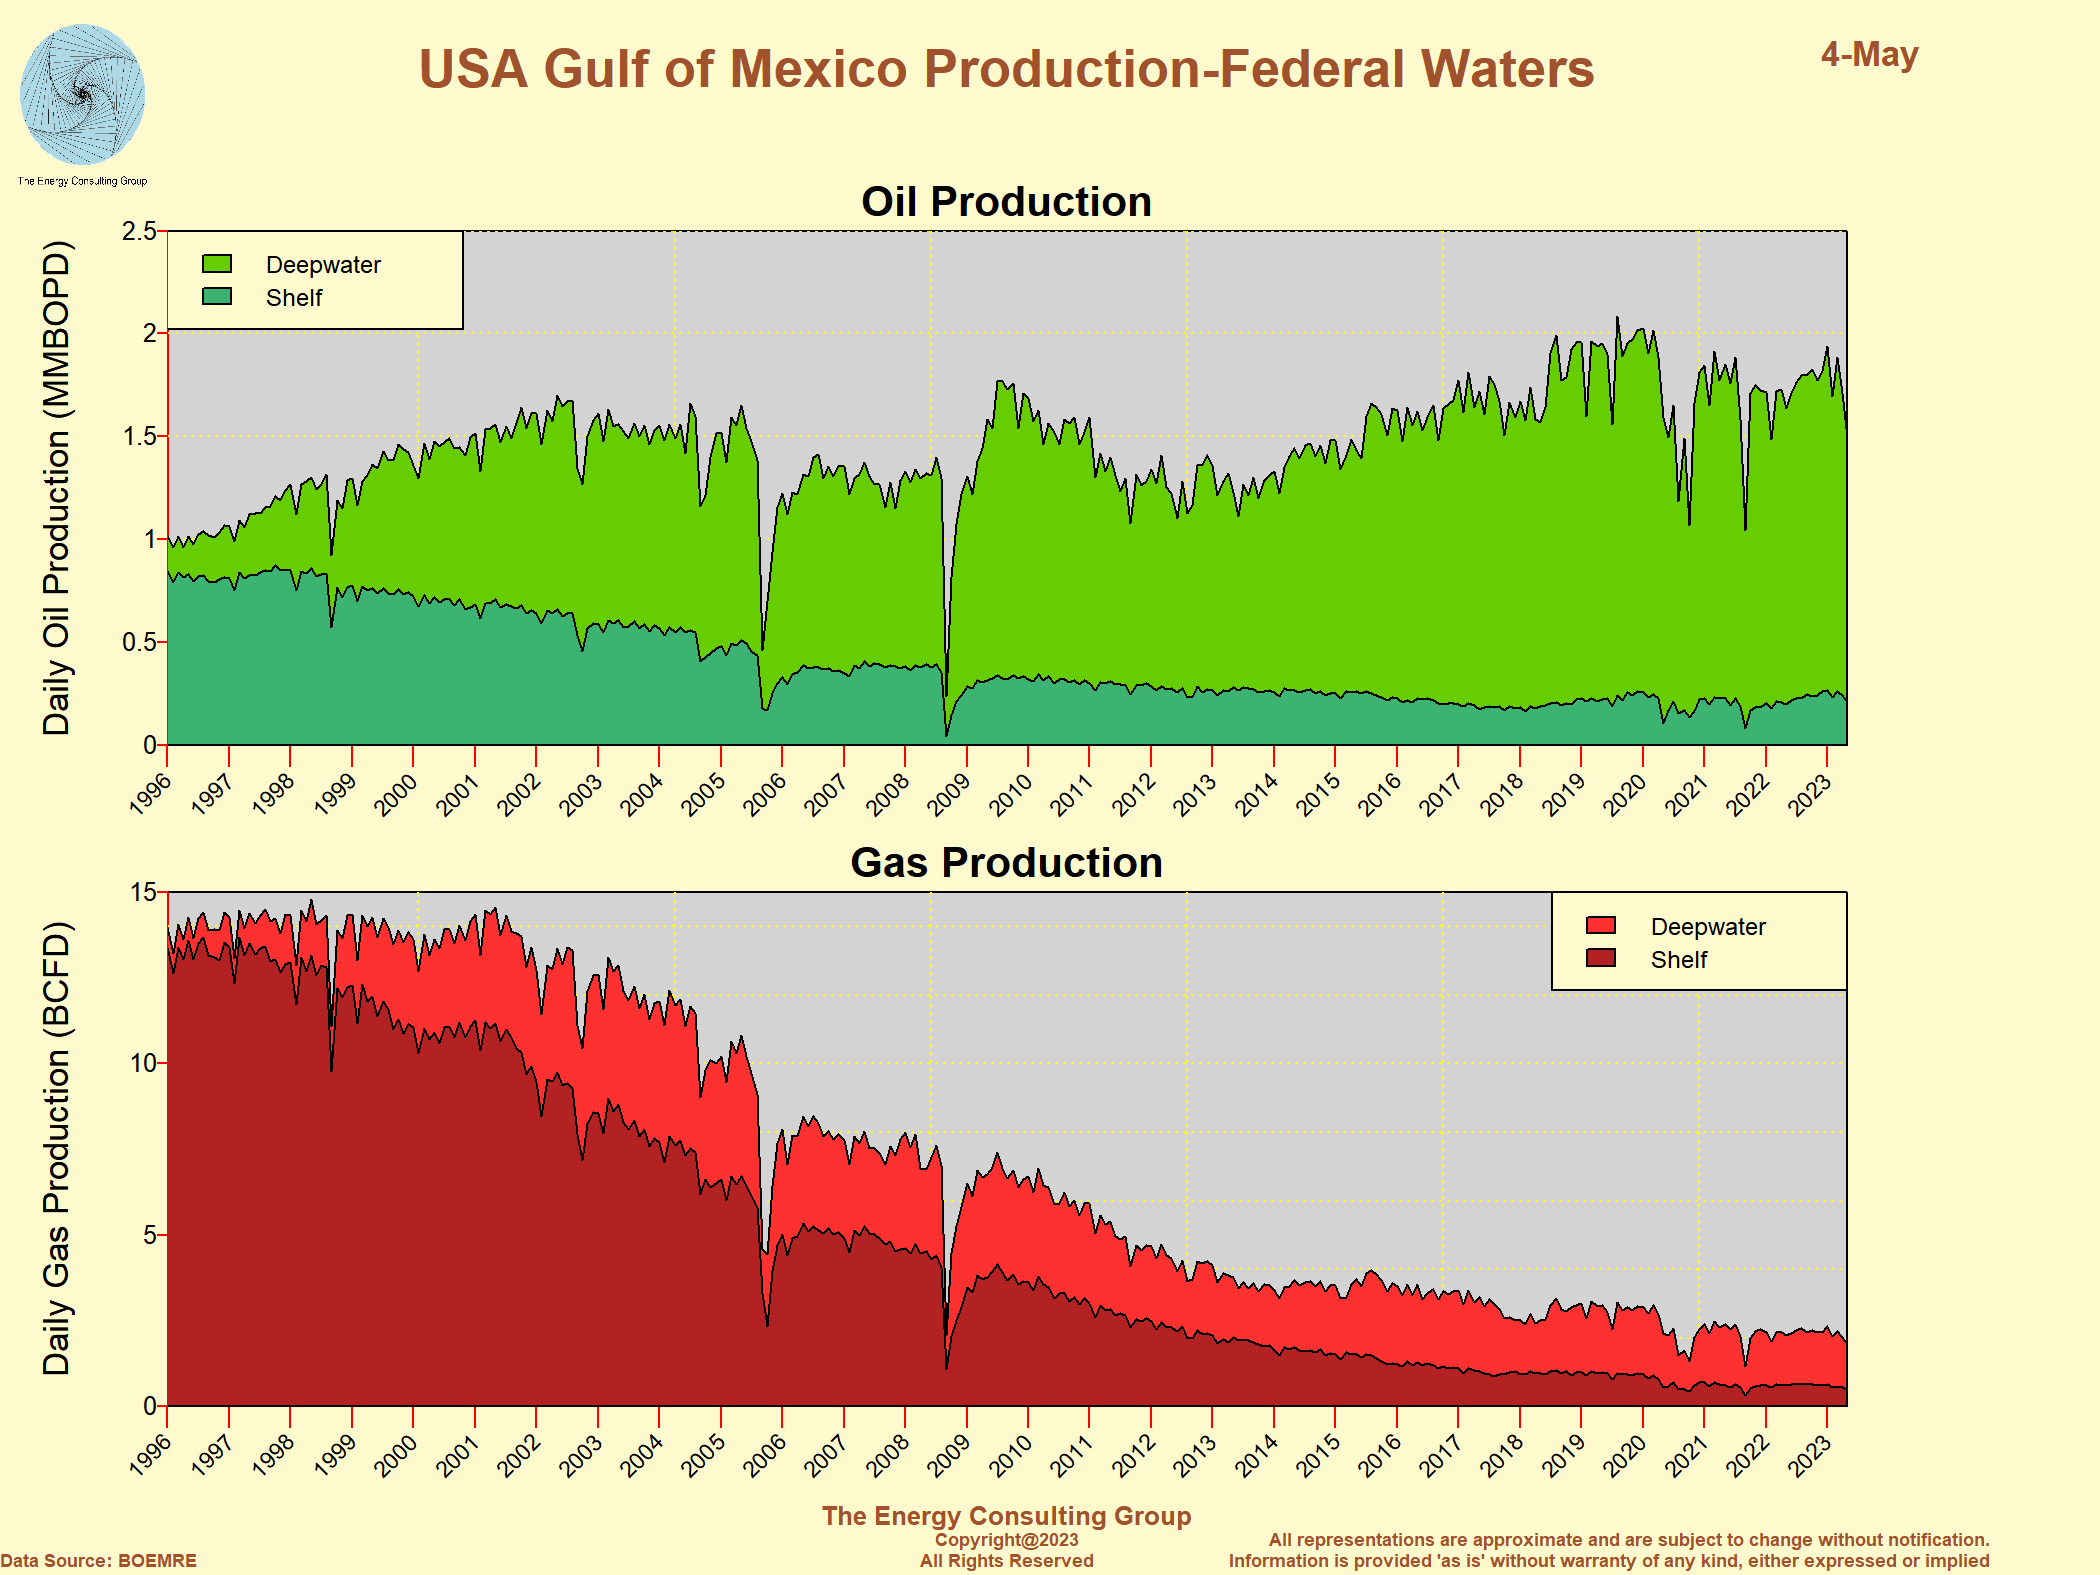 Click on the image for full size version For more information about oil and gas activities in the US Gulf of Mexico (GOM), including current drilling rig locations, and production profiles for most of the large deep water fields, go to our GOM web page, here. For the really adventurous and curious, check out the 3D tools and models we have developed to multidimensionally visualize the GOM. We use these representations in our work to give a sense as to how deep is deep when discussing the Gulf of Mexico deepwater sector.They can be accessed here and here. Note, these are large files that require a hi-speed internet connection and some patience. It may take 10 - 15 seconds for each to load. Enjoy! (FYI: the 3D images are zoomable and roamable, and can be rotated for better viewing angles. Map controls: to rotate use the left mouse button, to zoom in/out use the mouse wheel, and to roam use the right mouse button. ) |
US Demand for Oil and Associated Products
|
Daily Implied US Total Product Demand as Reported in the Weekly EIA Updates 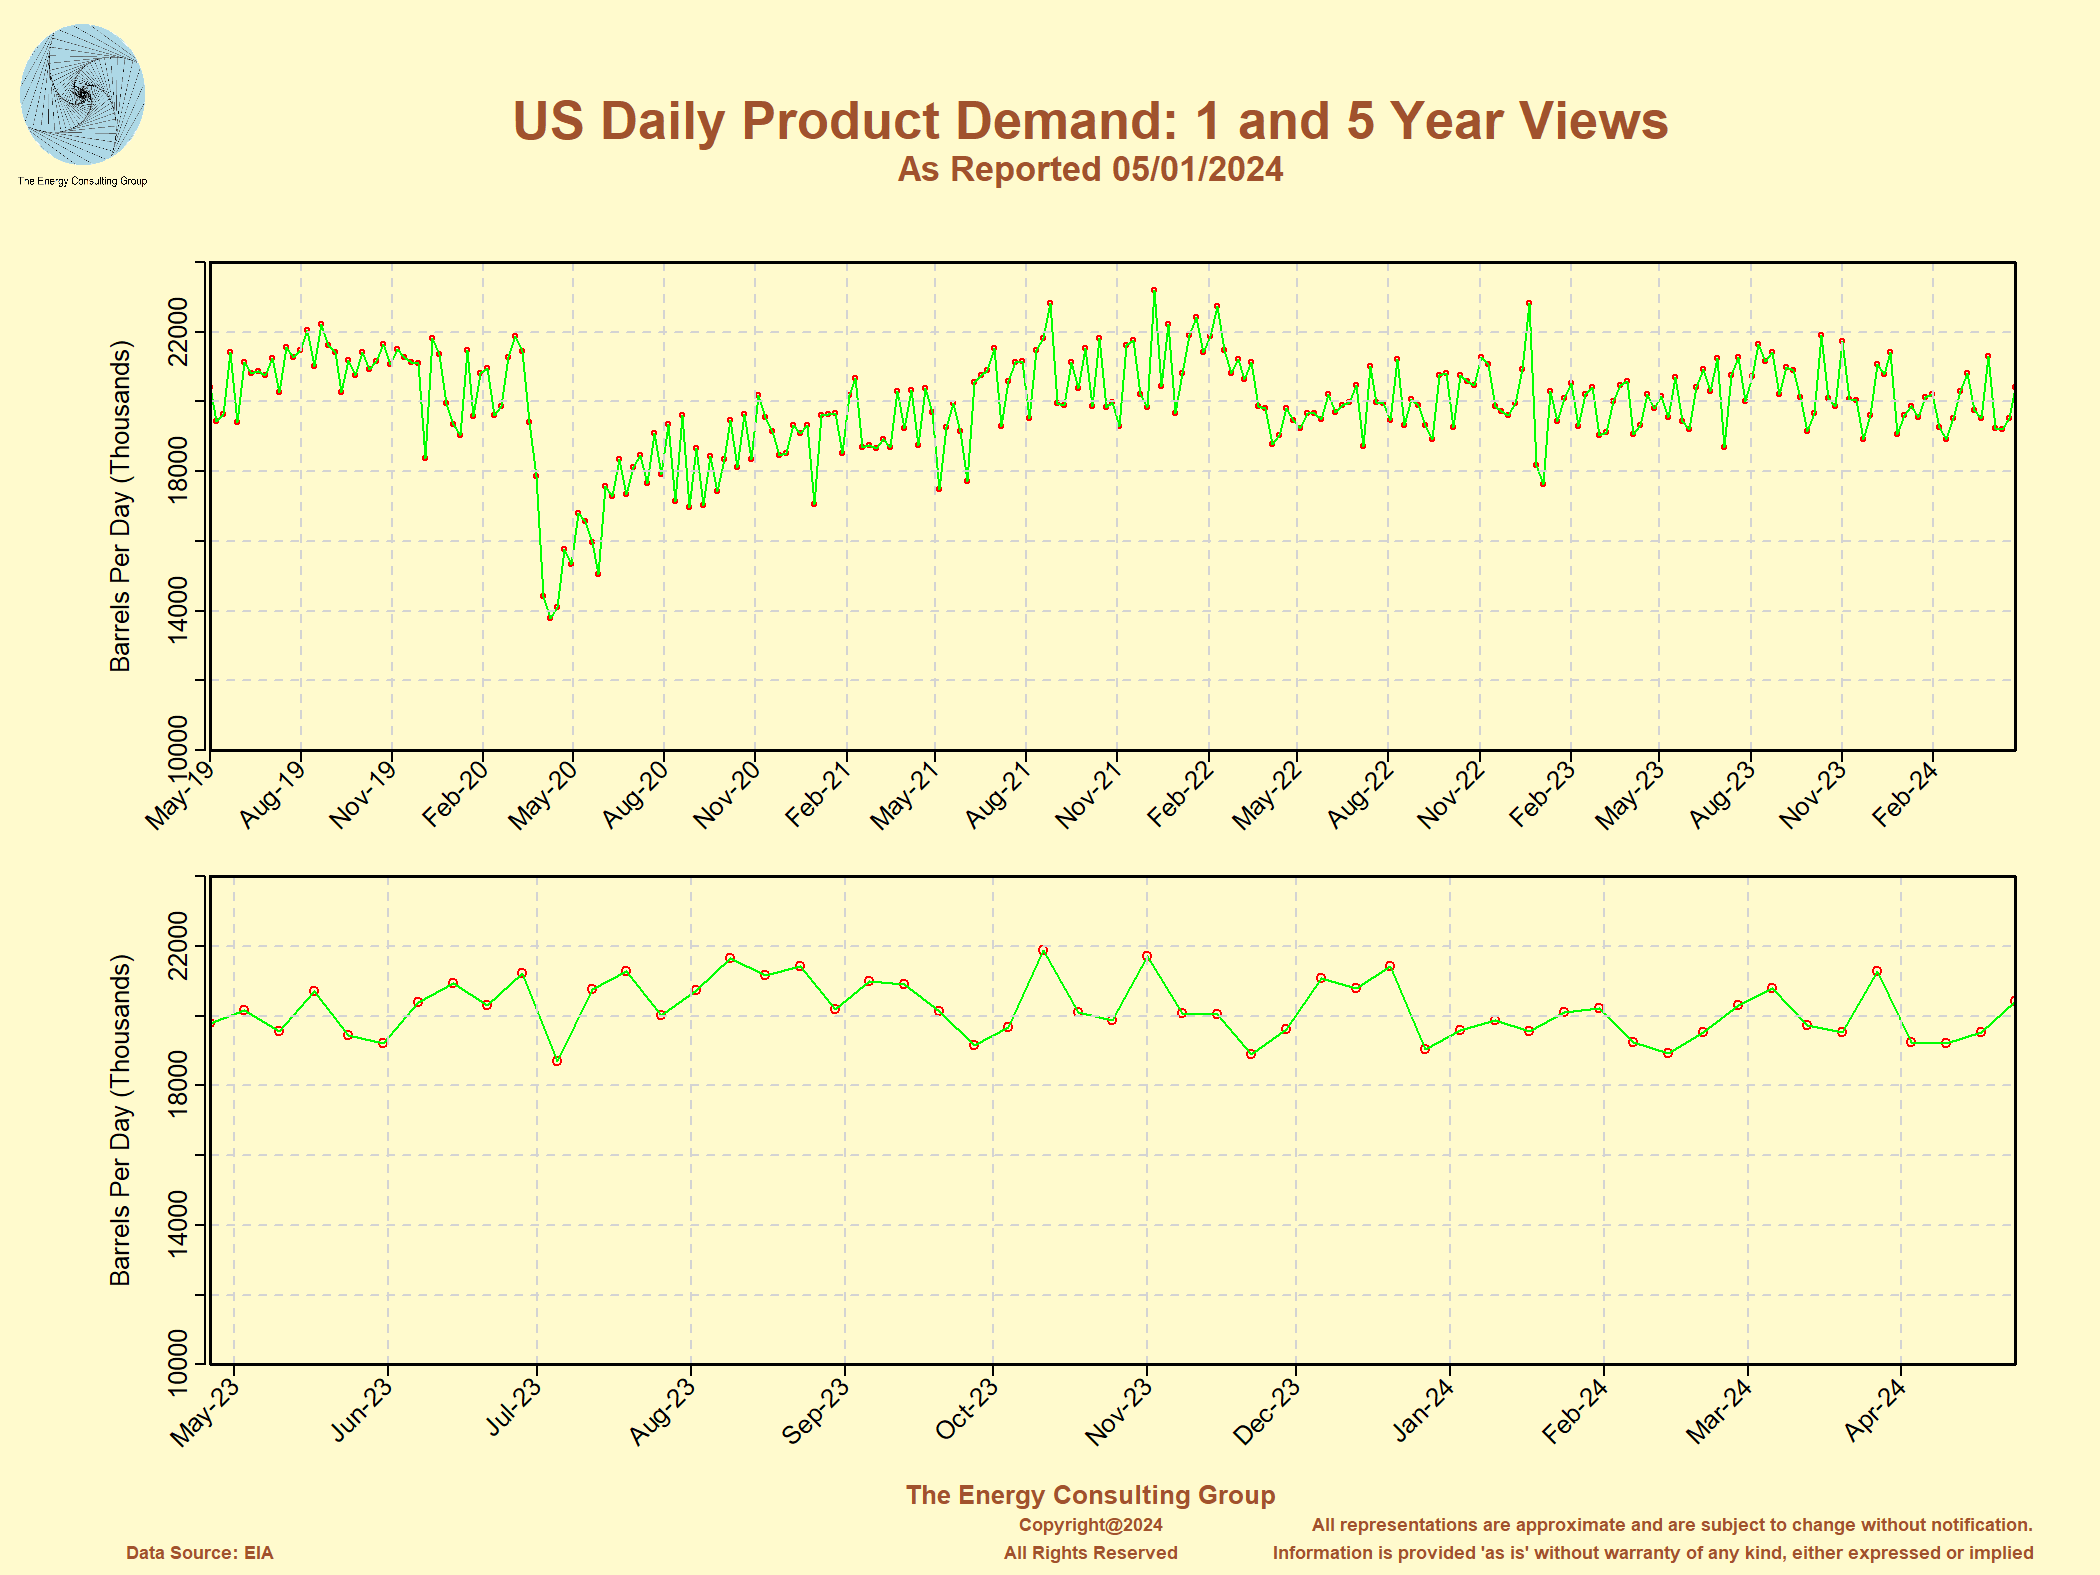 Click on the image for full size version |
2022 US Total Petroleum Inventory Levels vs 5 year History (Total petroleum includes crude oil, gasoline, distillate, propane, natural gas liquids, etc.)  Click on the image for full size version |
Brent Oil Price: Short Term Perspective 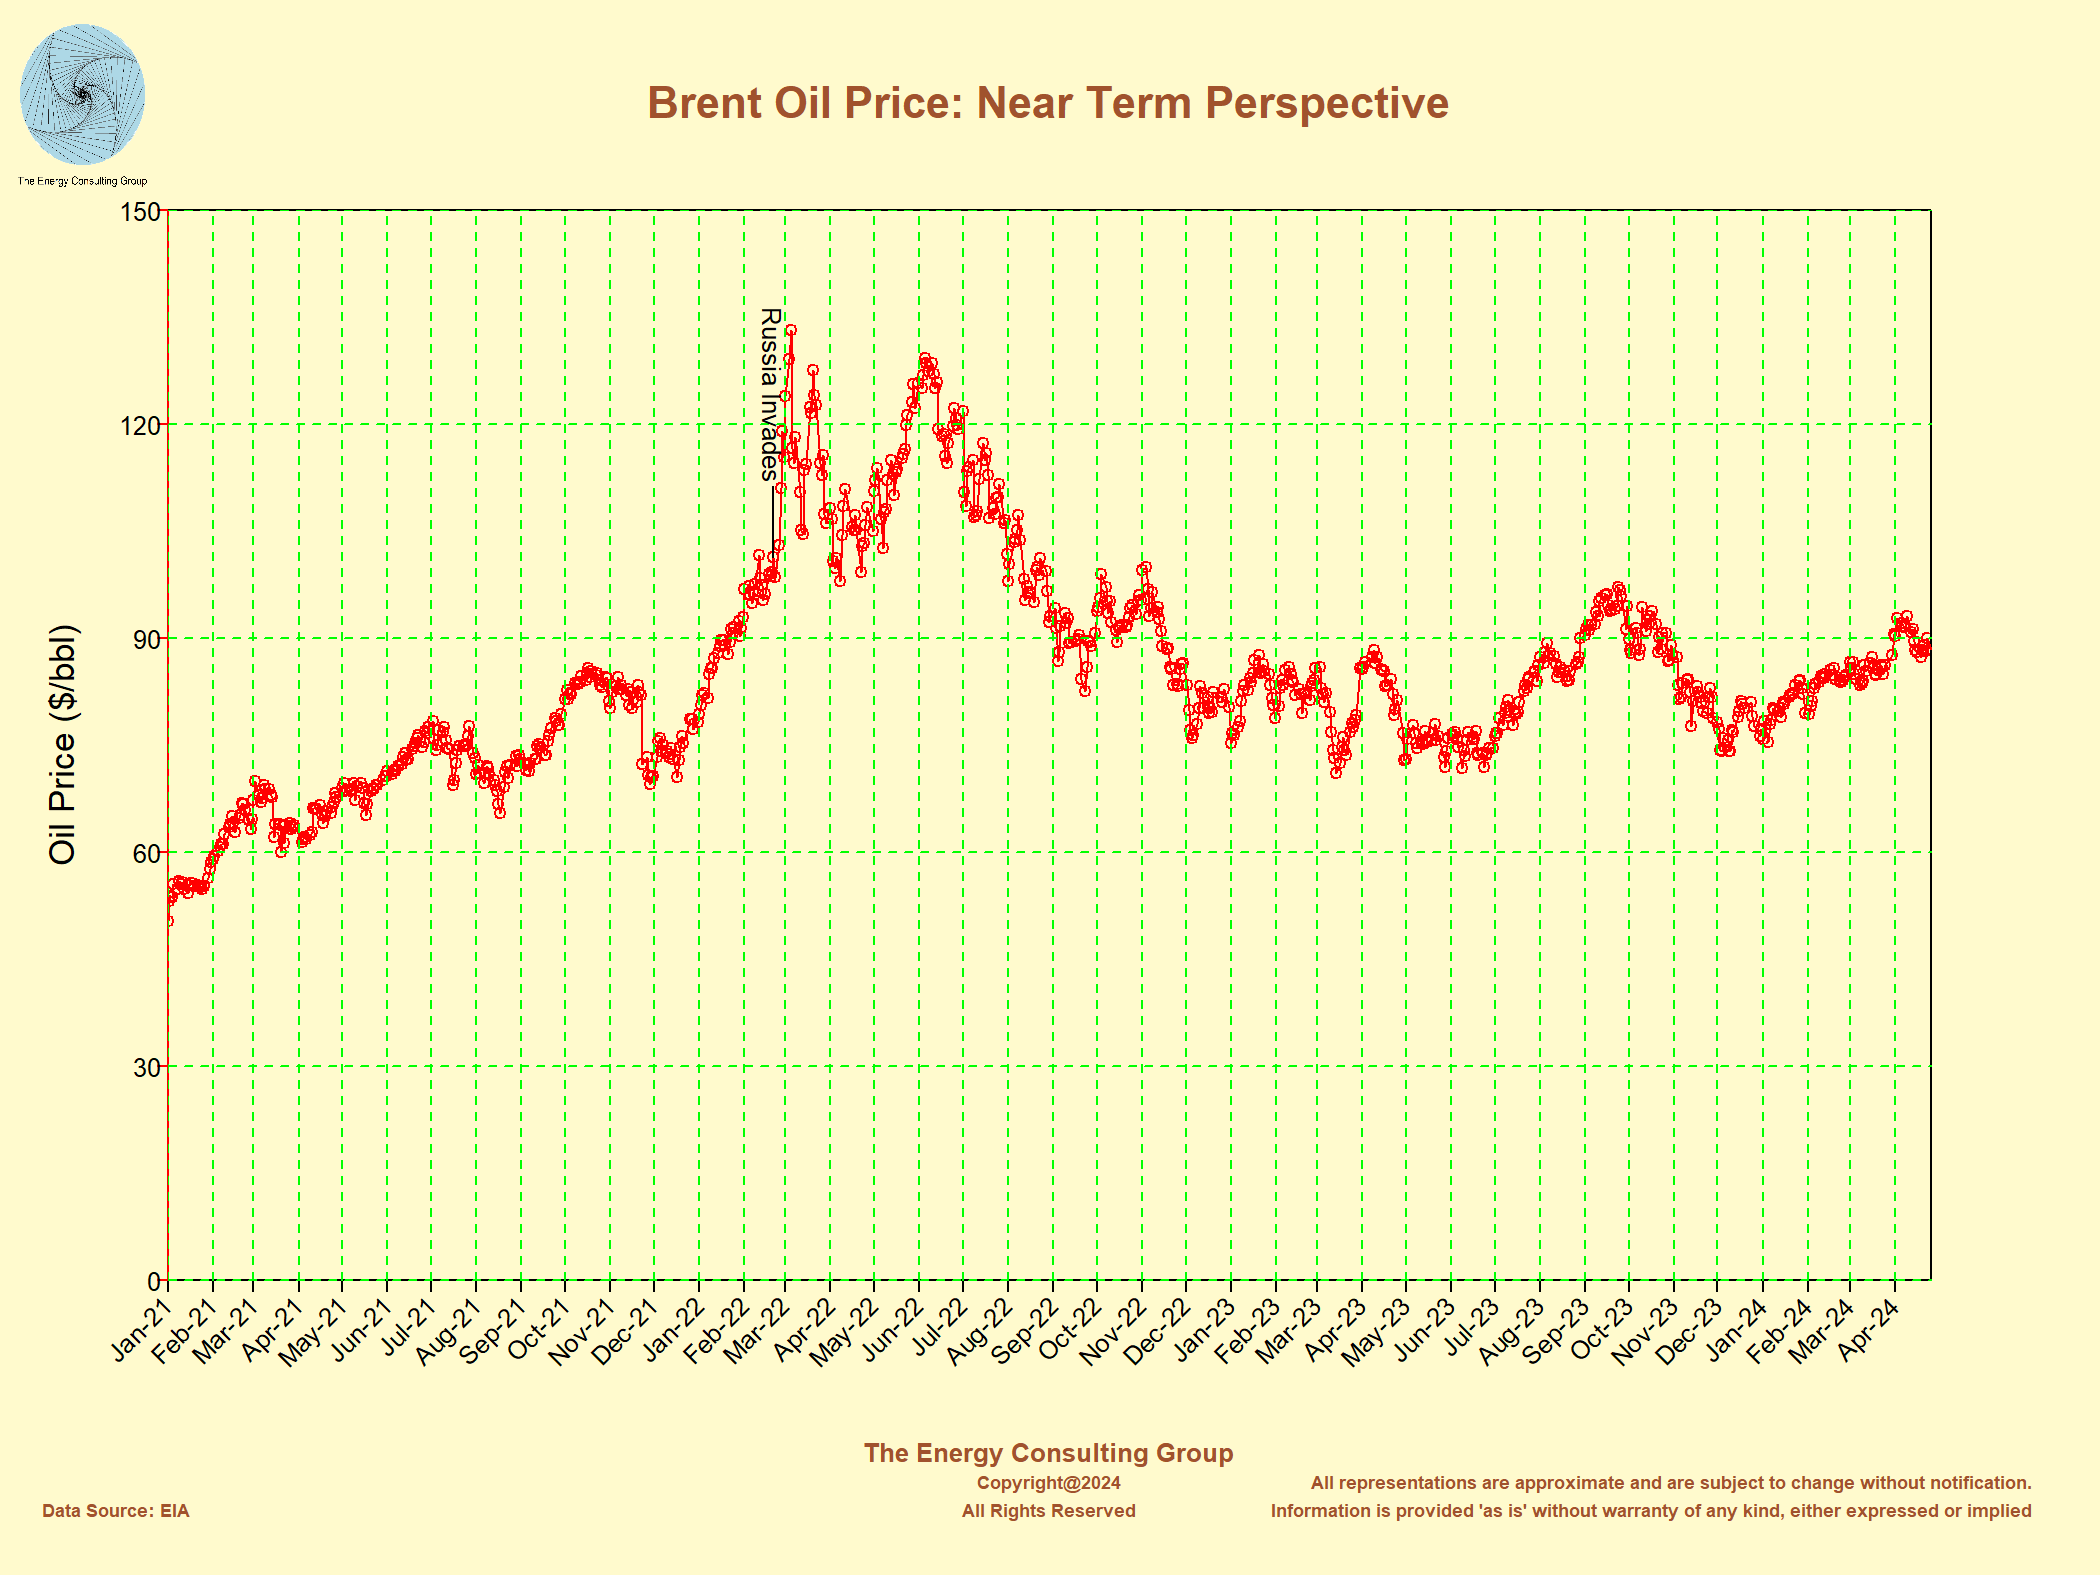 Click on the image for full size version |
Daily Implied US Gasoline Demand as Reported in the Weekly EIA
Updates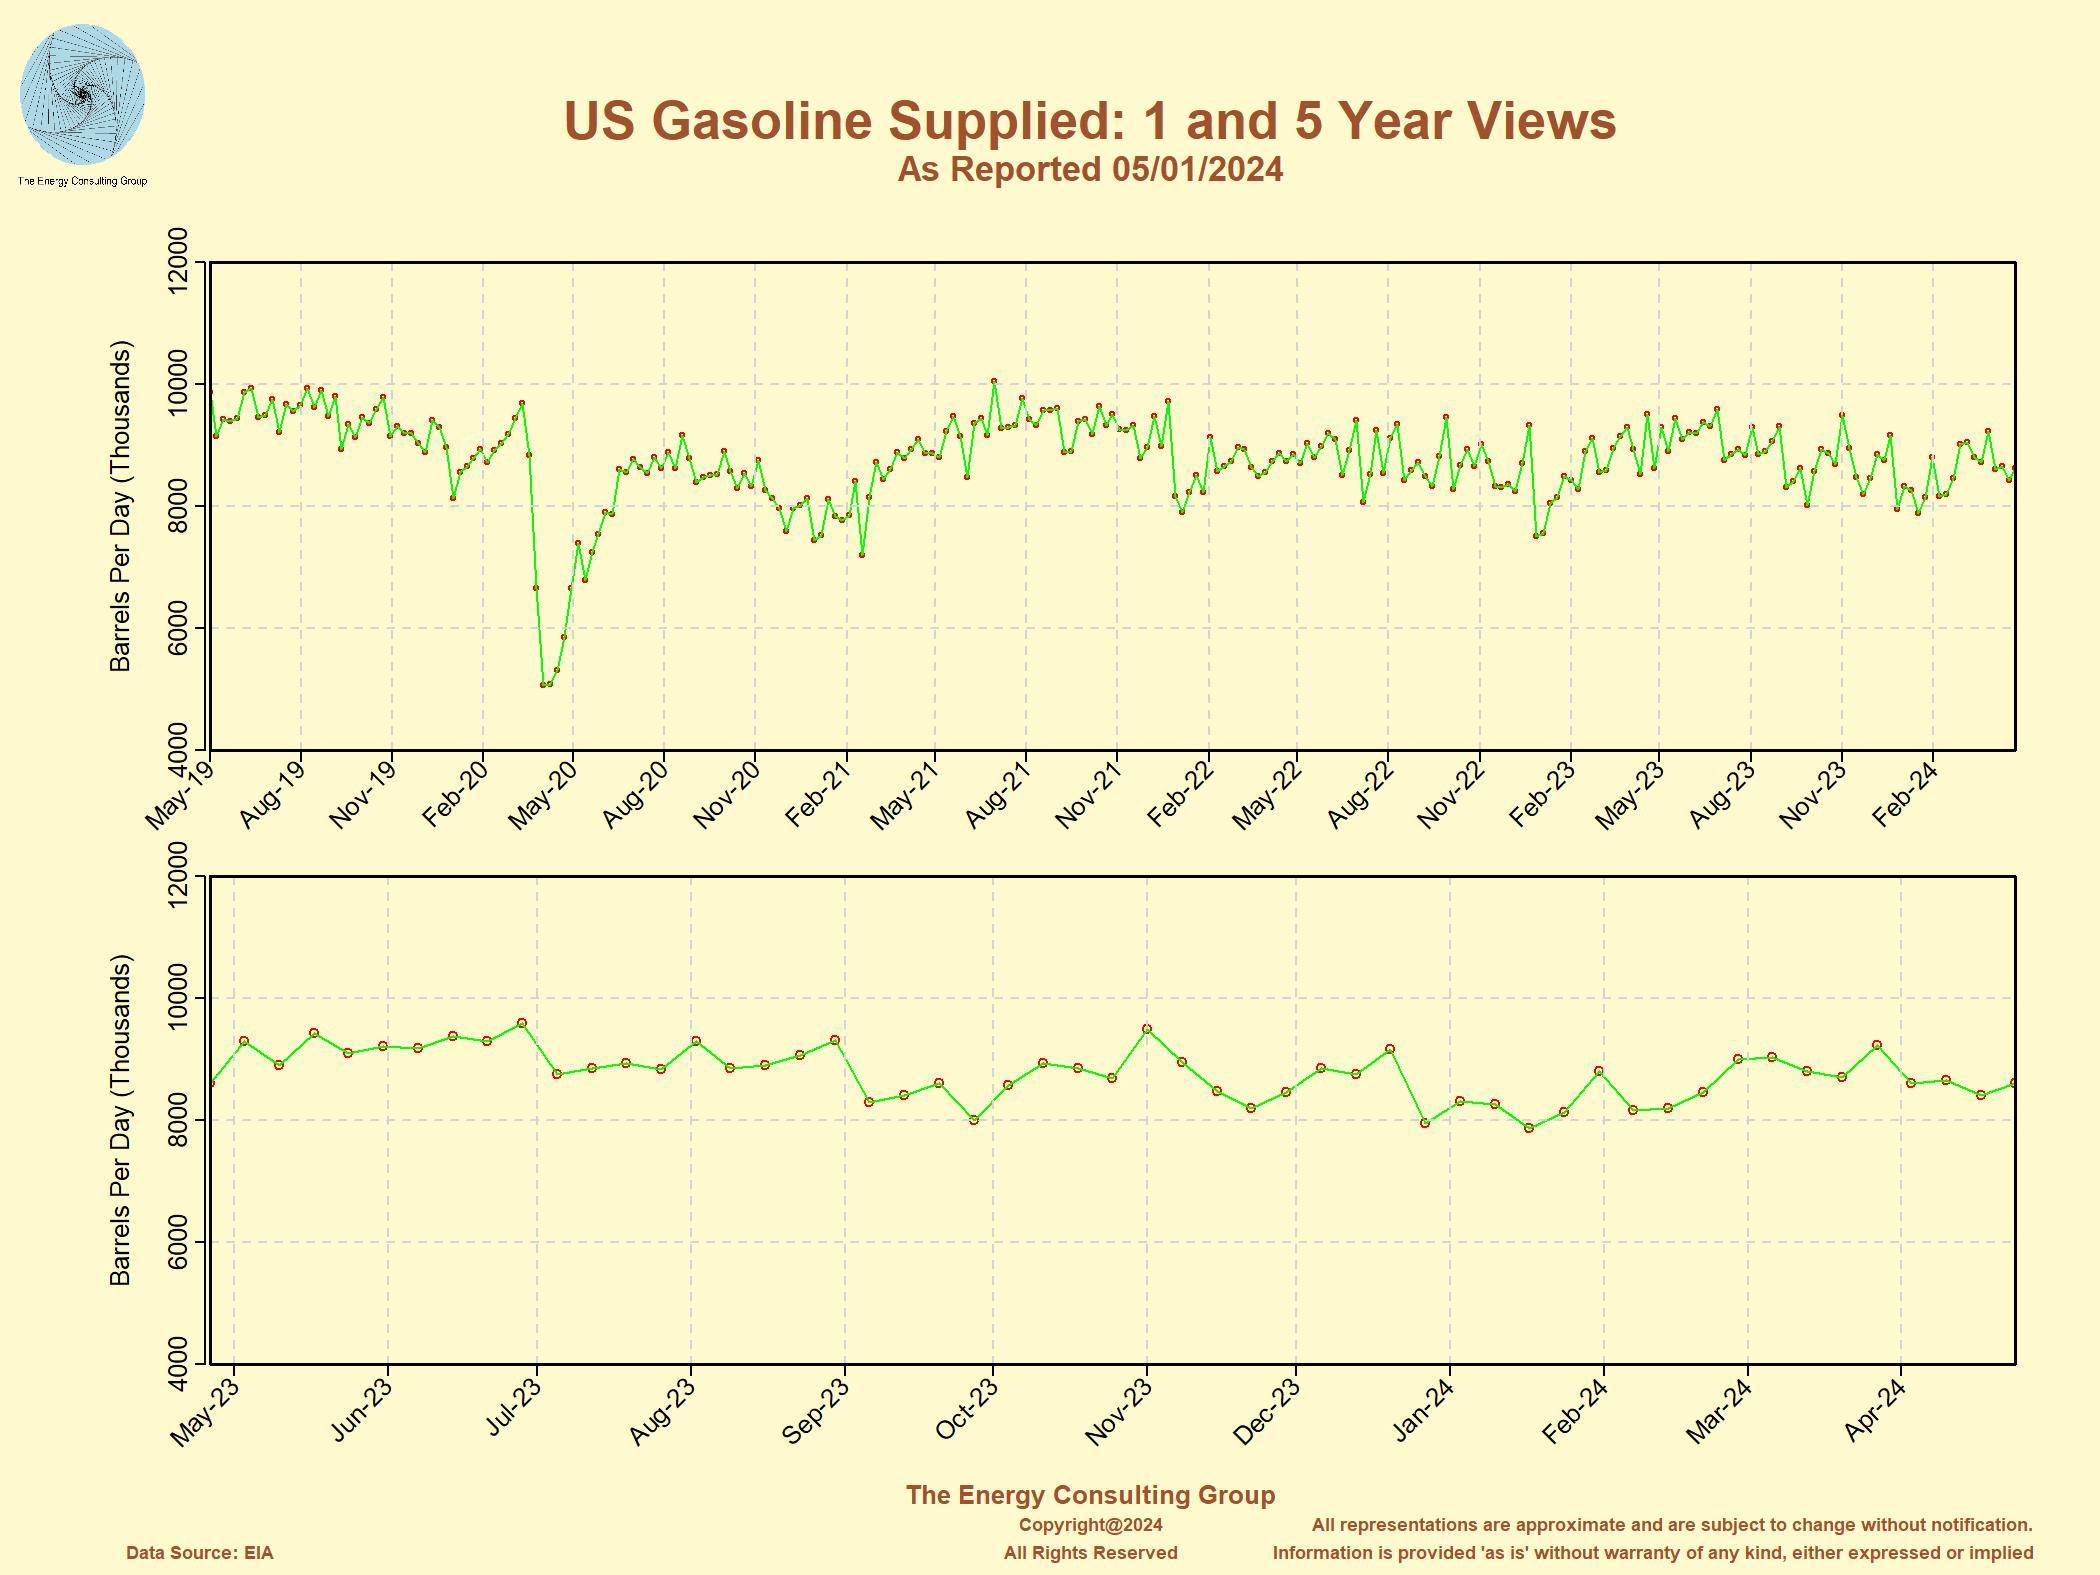 Click on the image for full size version |
US Gasoline Inventory Levels Compared with 5 Year History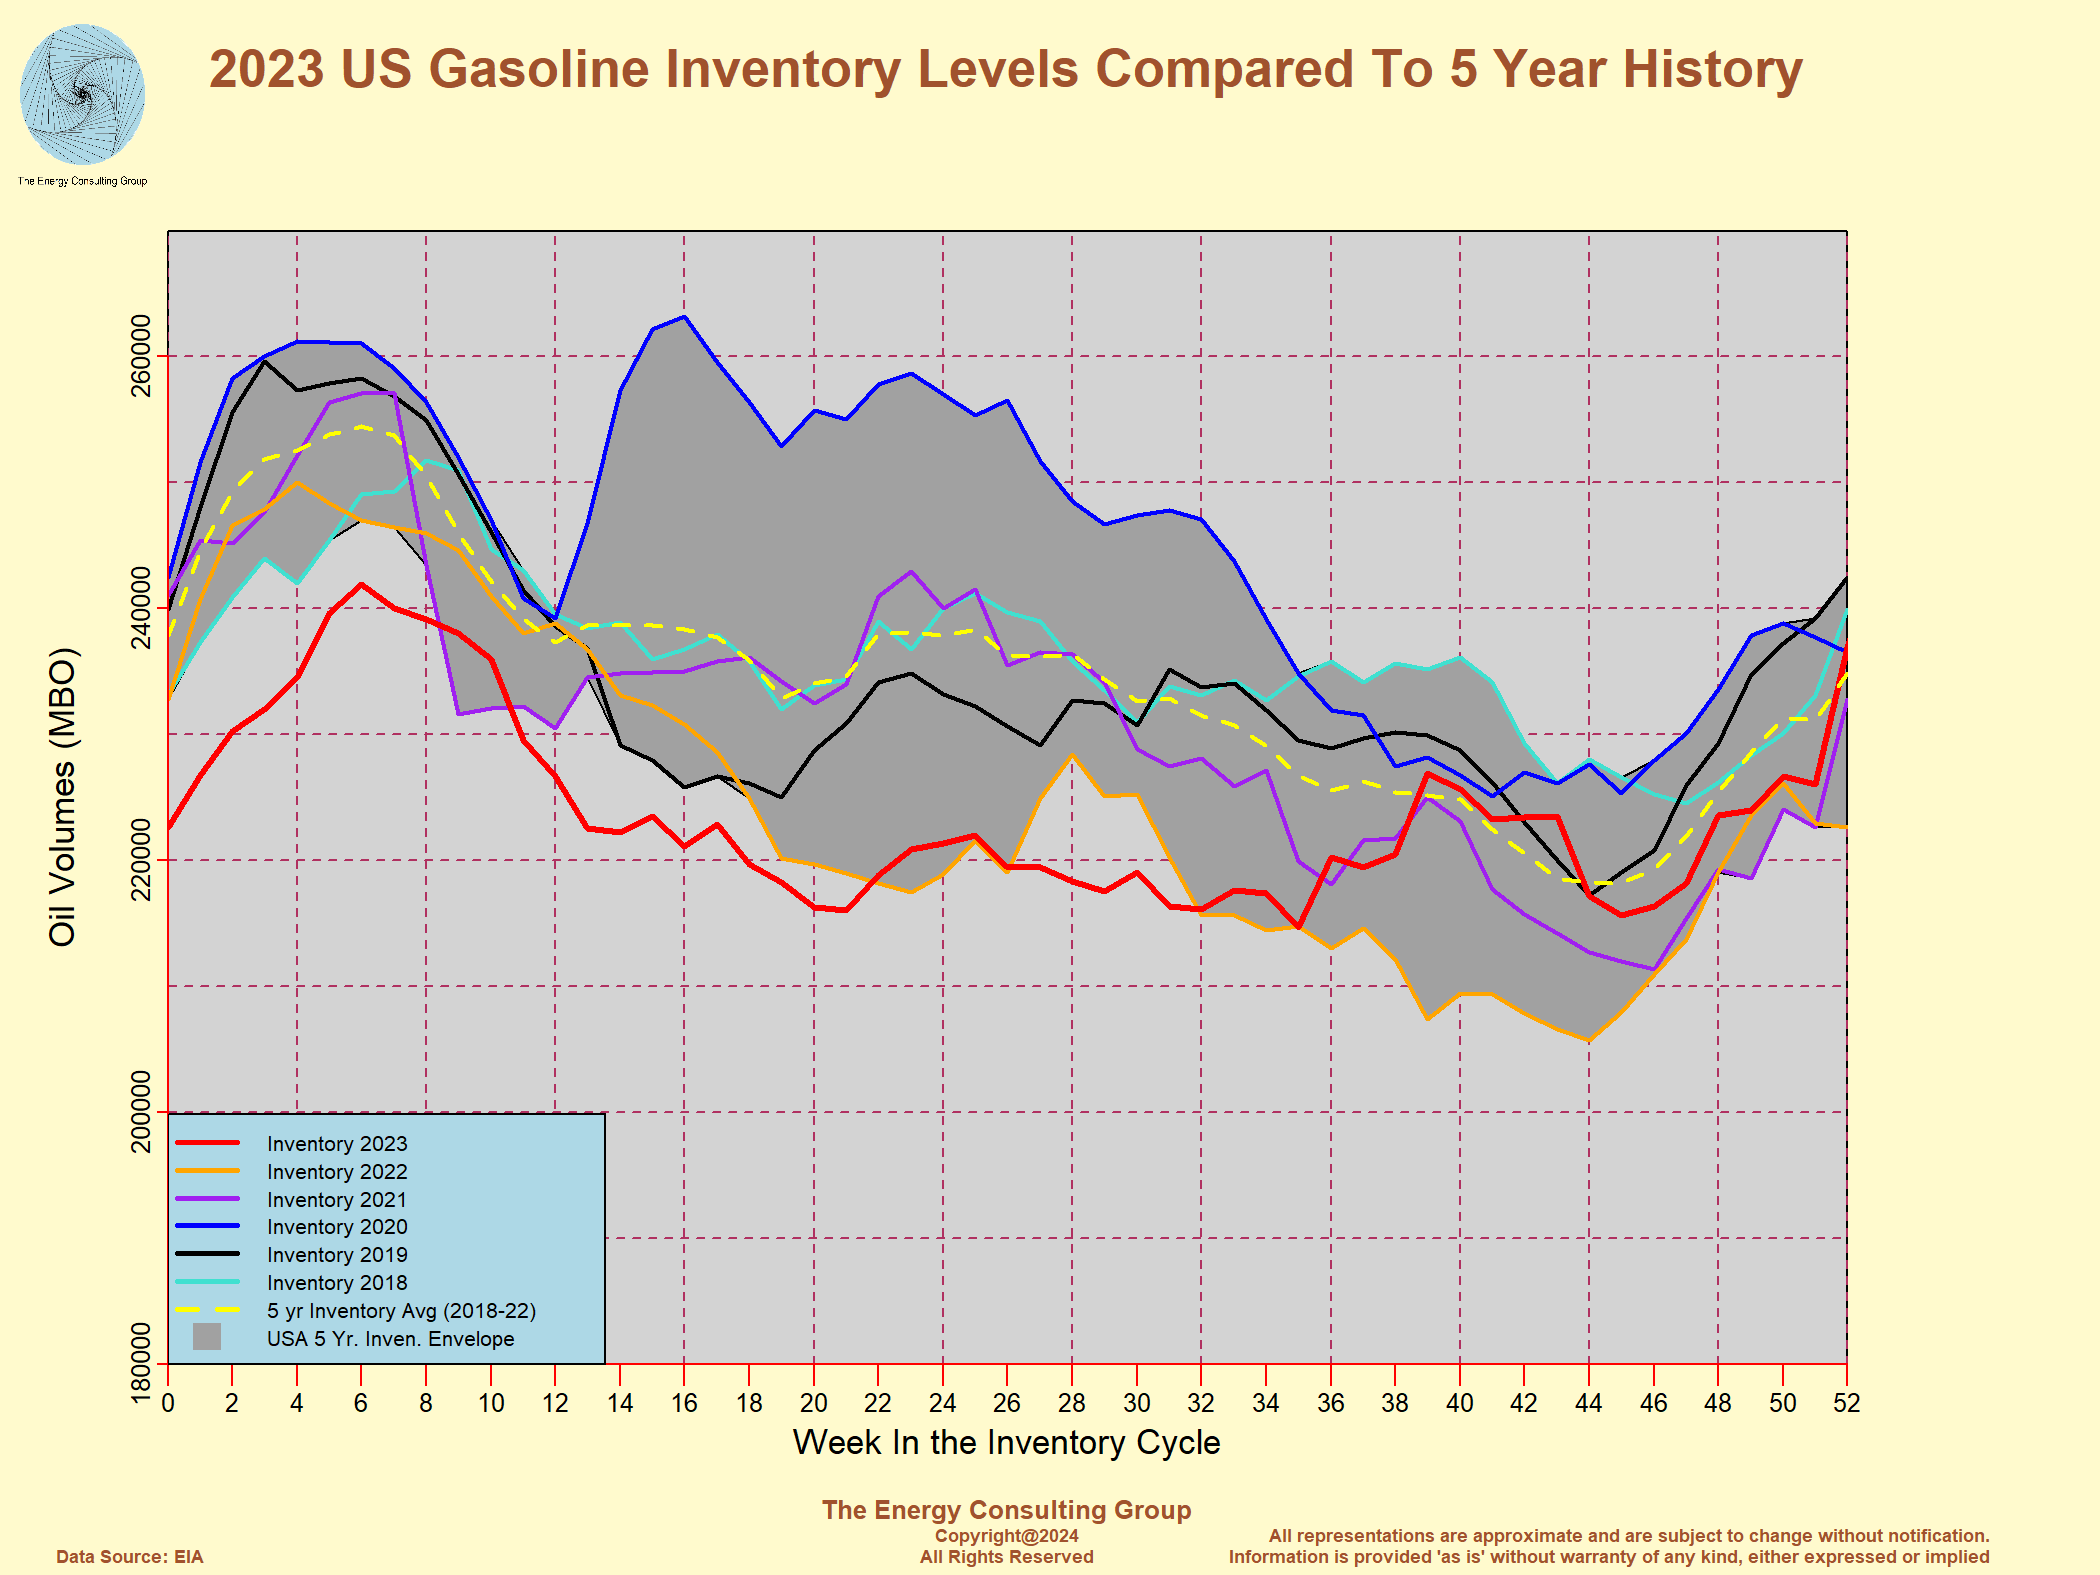 Click on the image for full size version |
Gasoline Price ($/gal) RBOB, Los
Angeles Harbor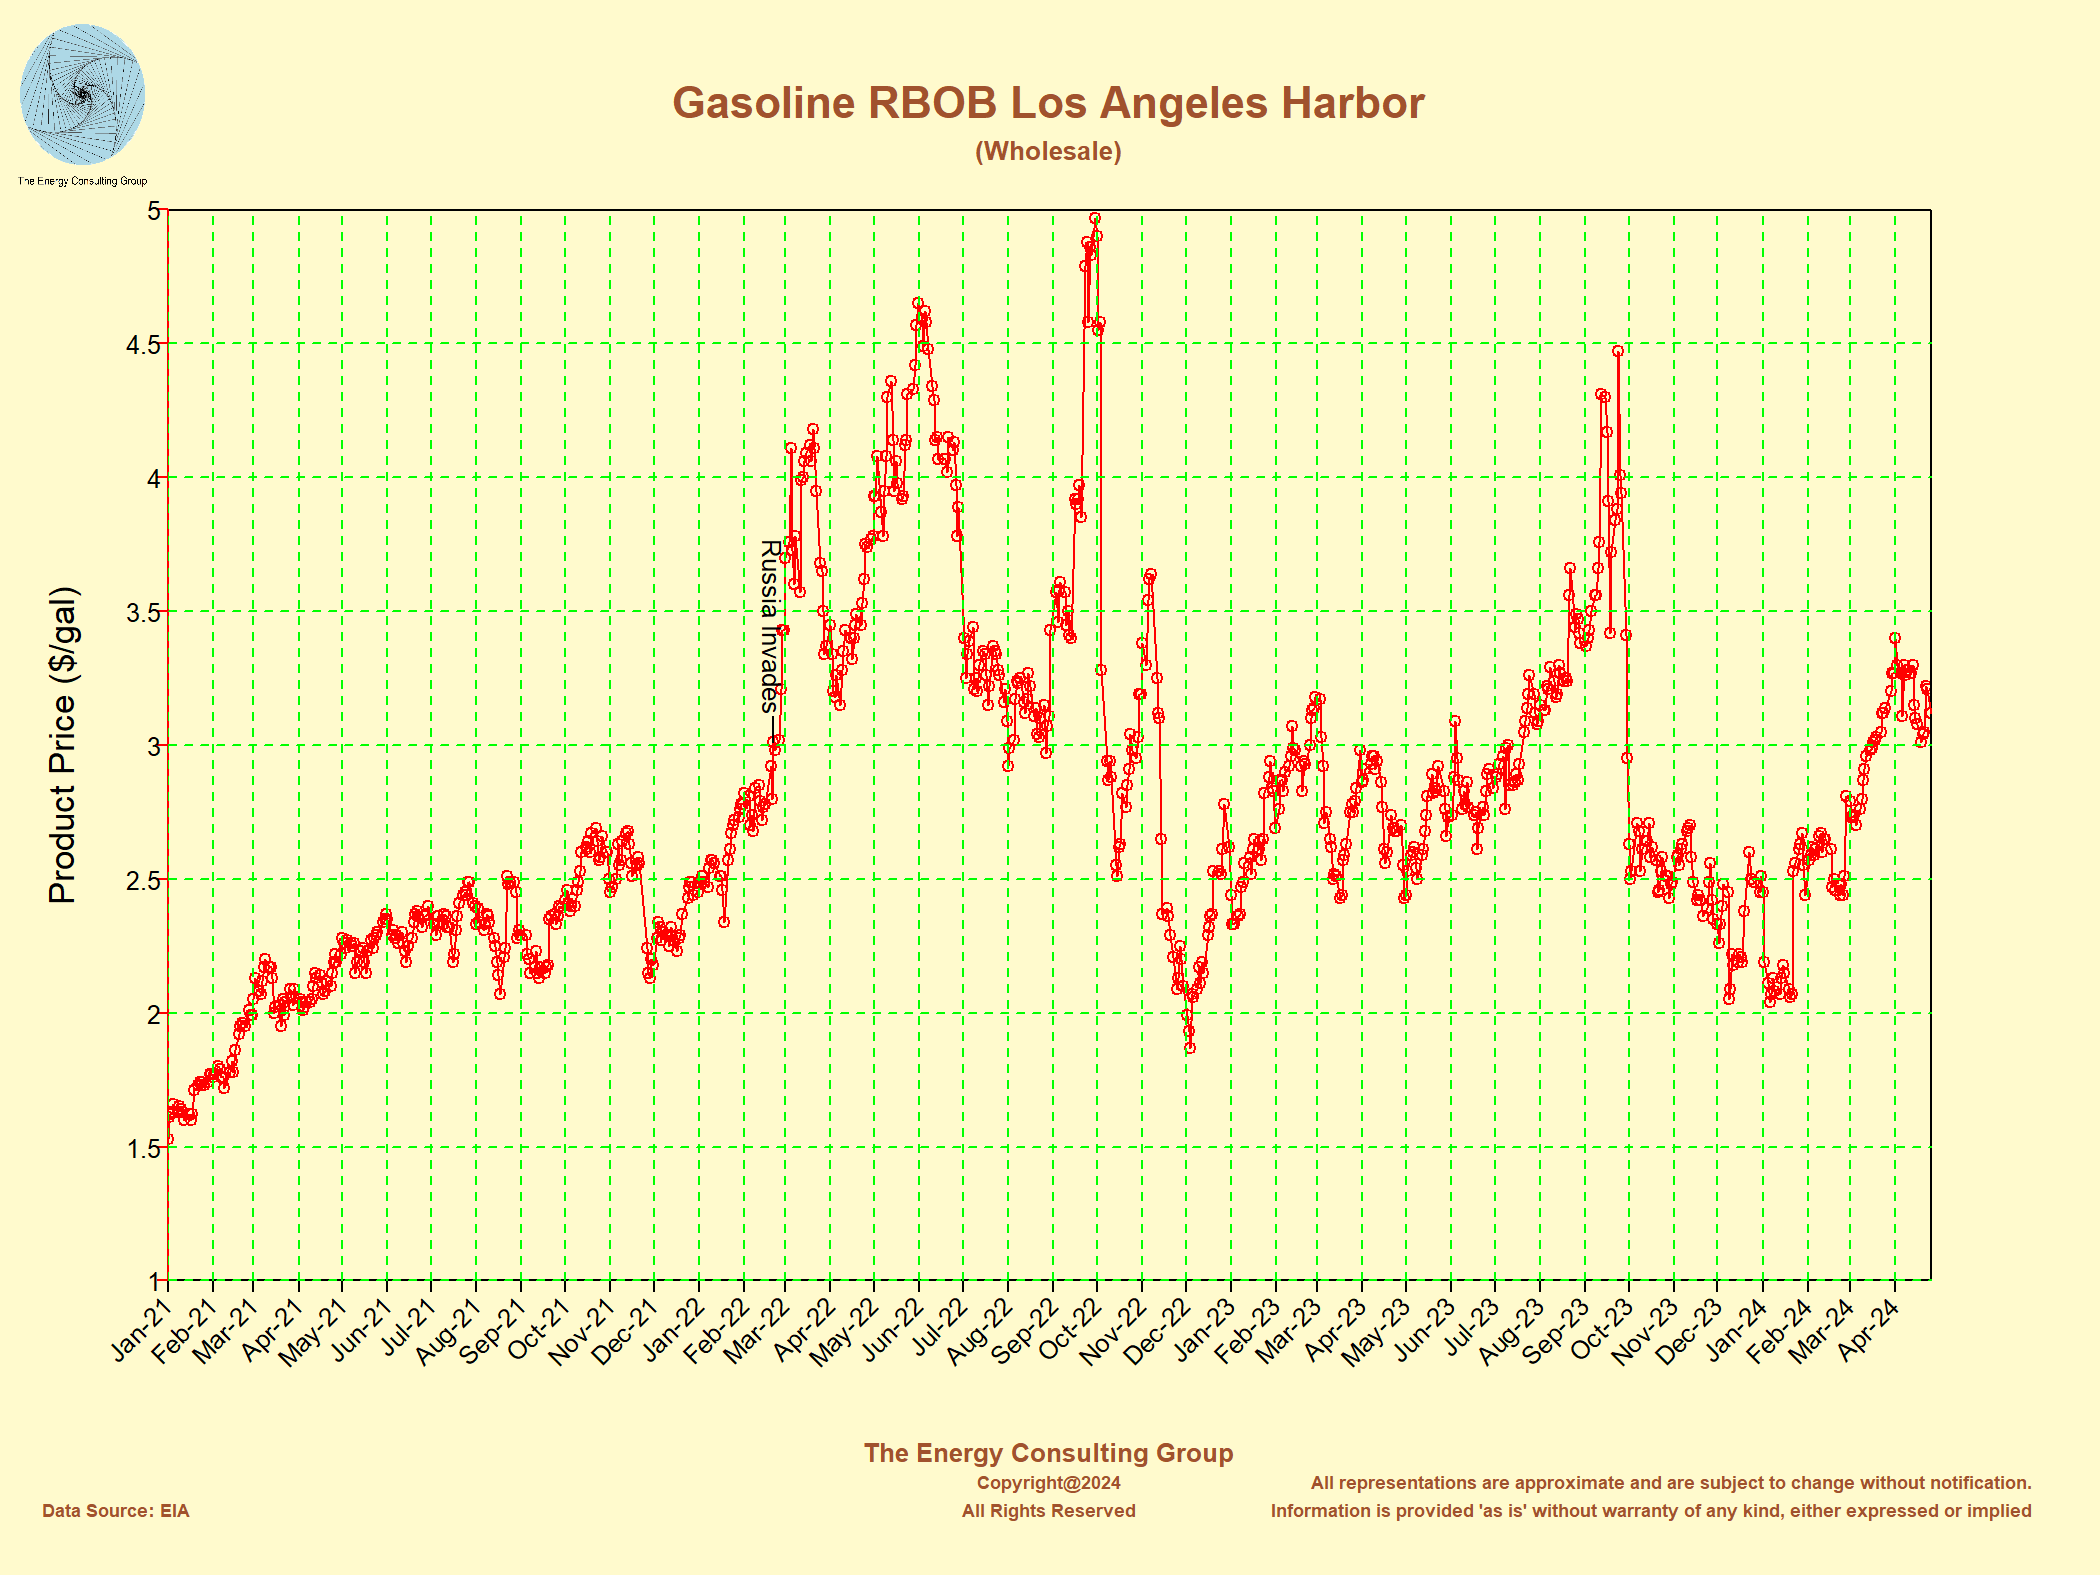 Click on the image for full size version |
Daily Implied US
Distillate (Diesel) Demand as Reported in the Weekly EIA
Updates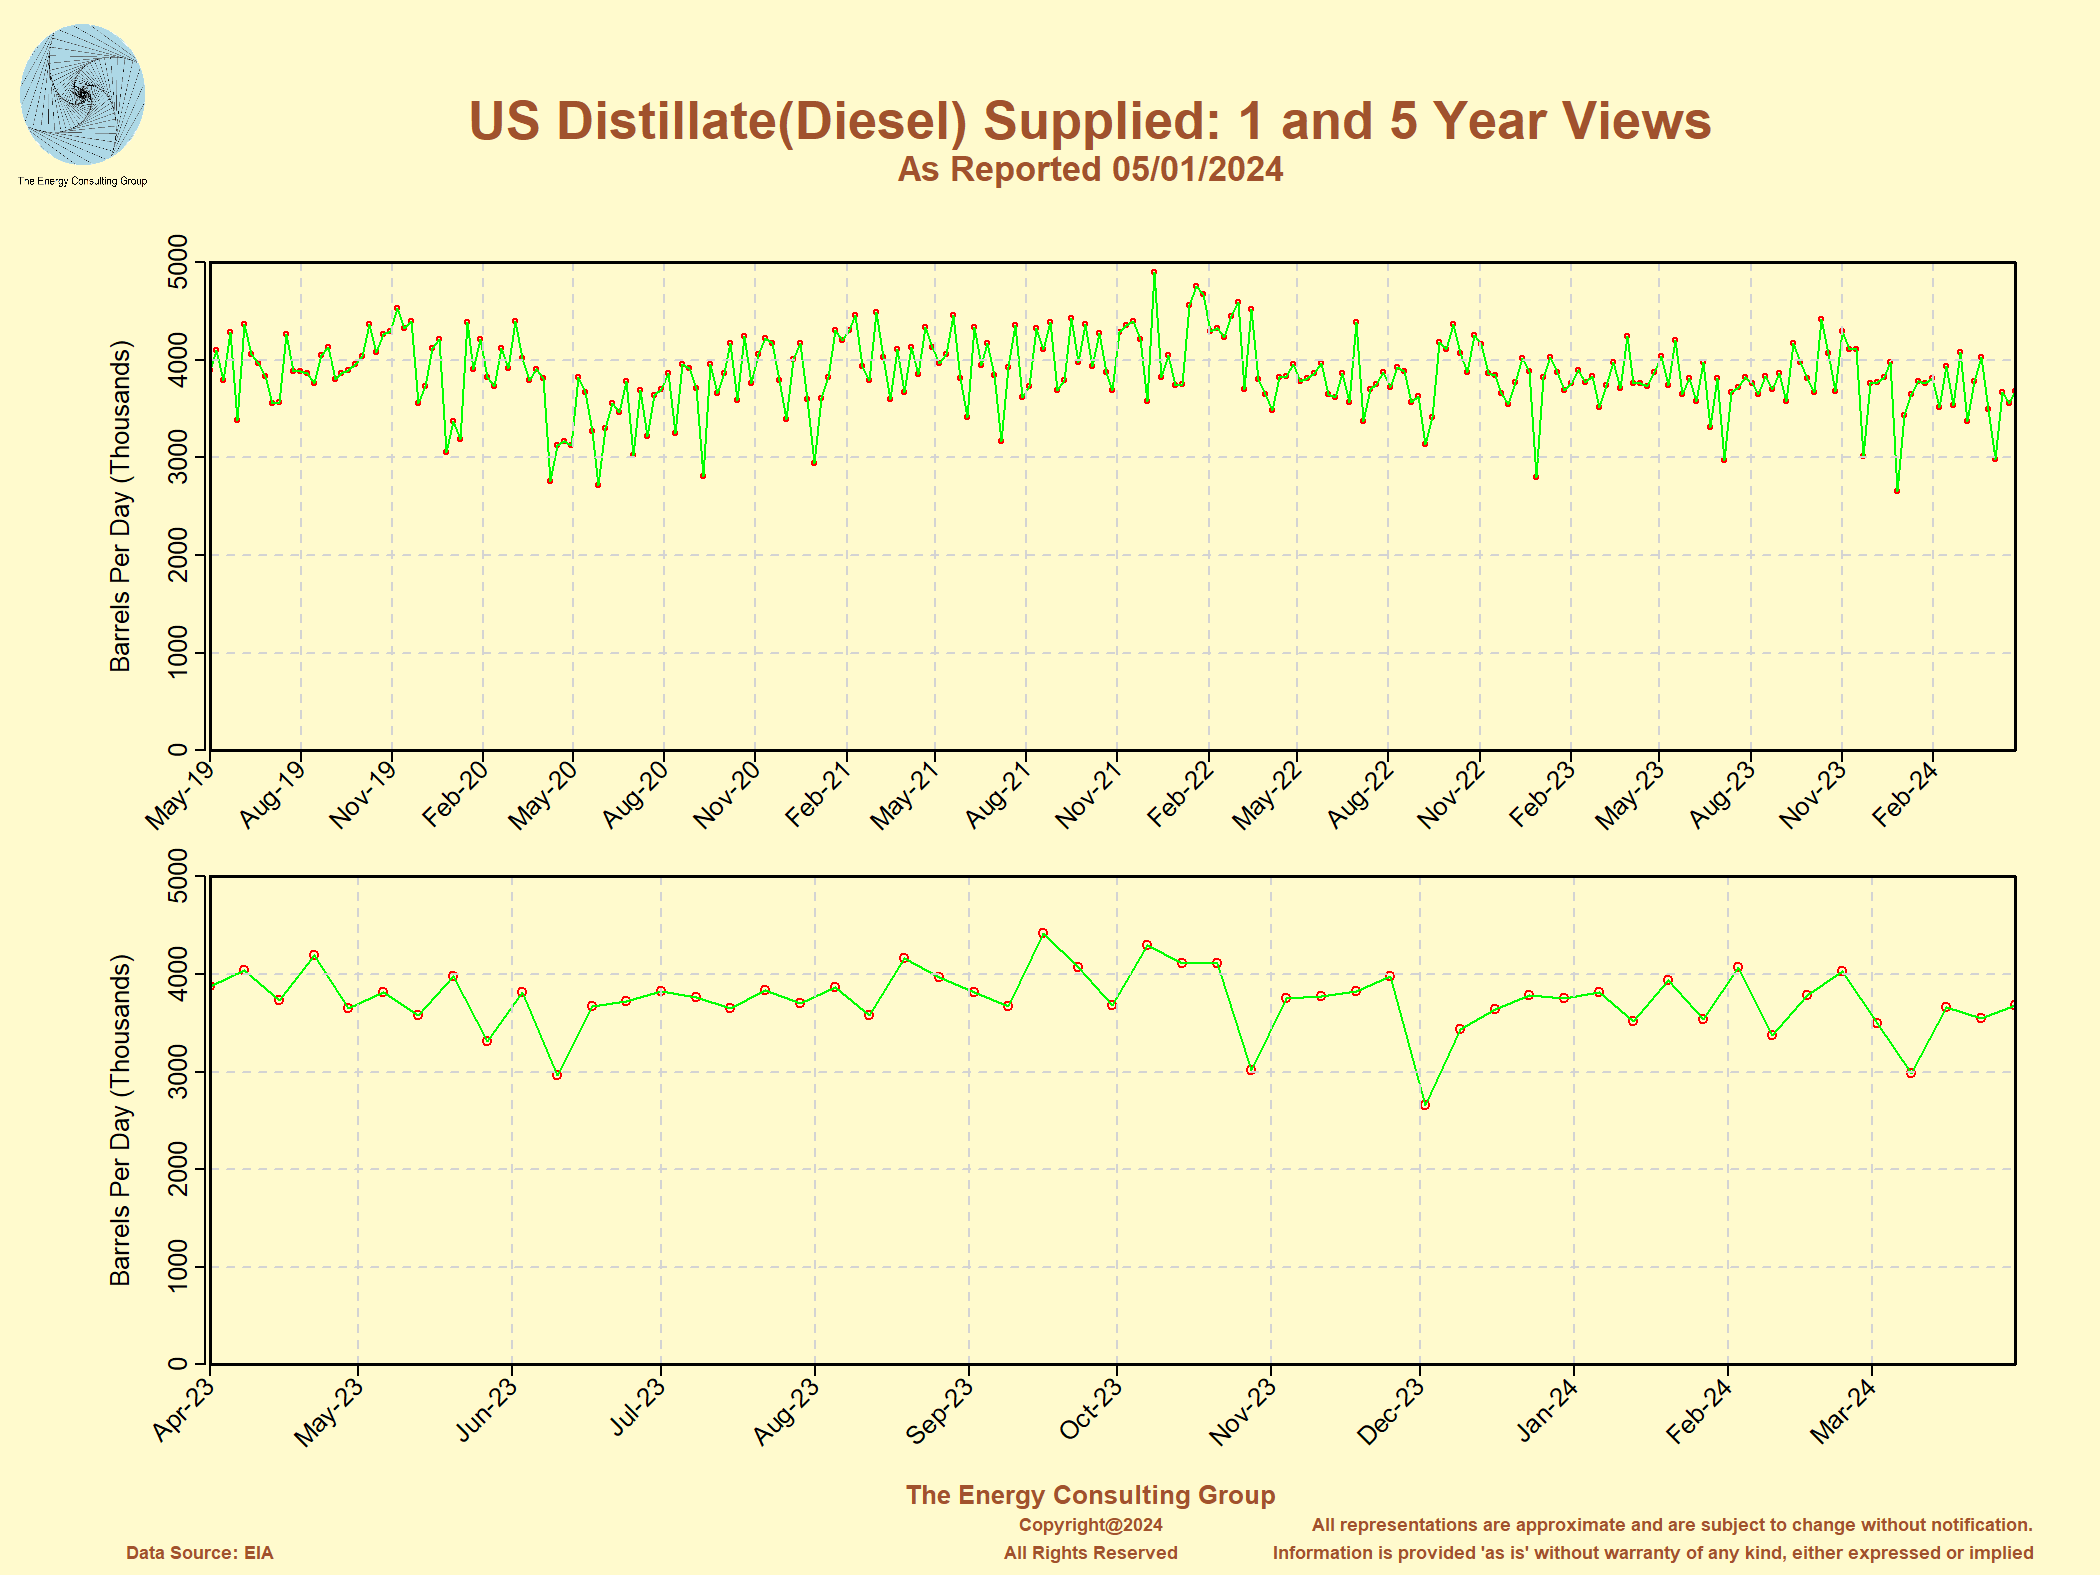 Click on the image for full size version Click on the image for full size version |
US Distillate Inventory Levels Compared with 5 Year History 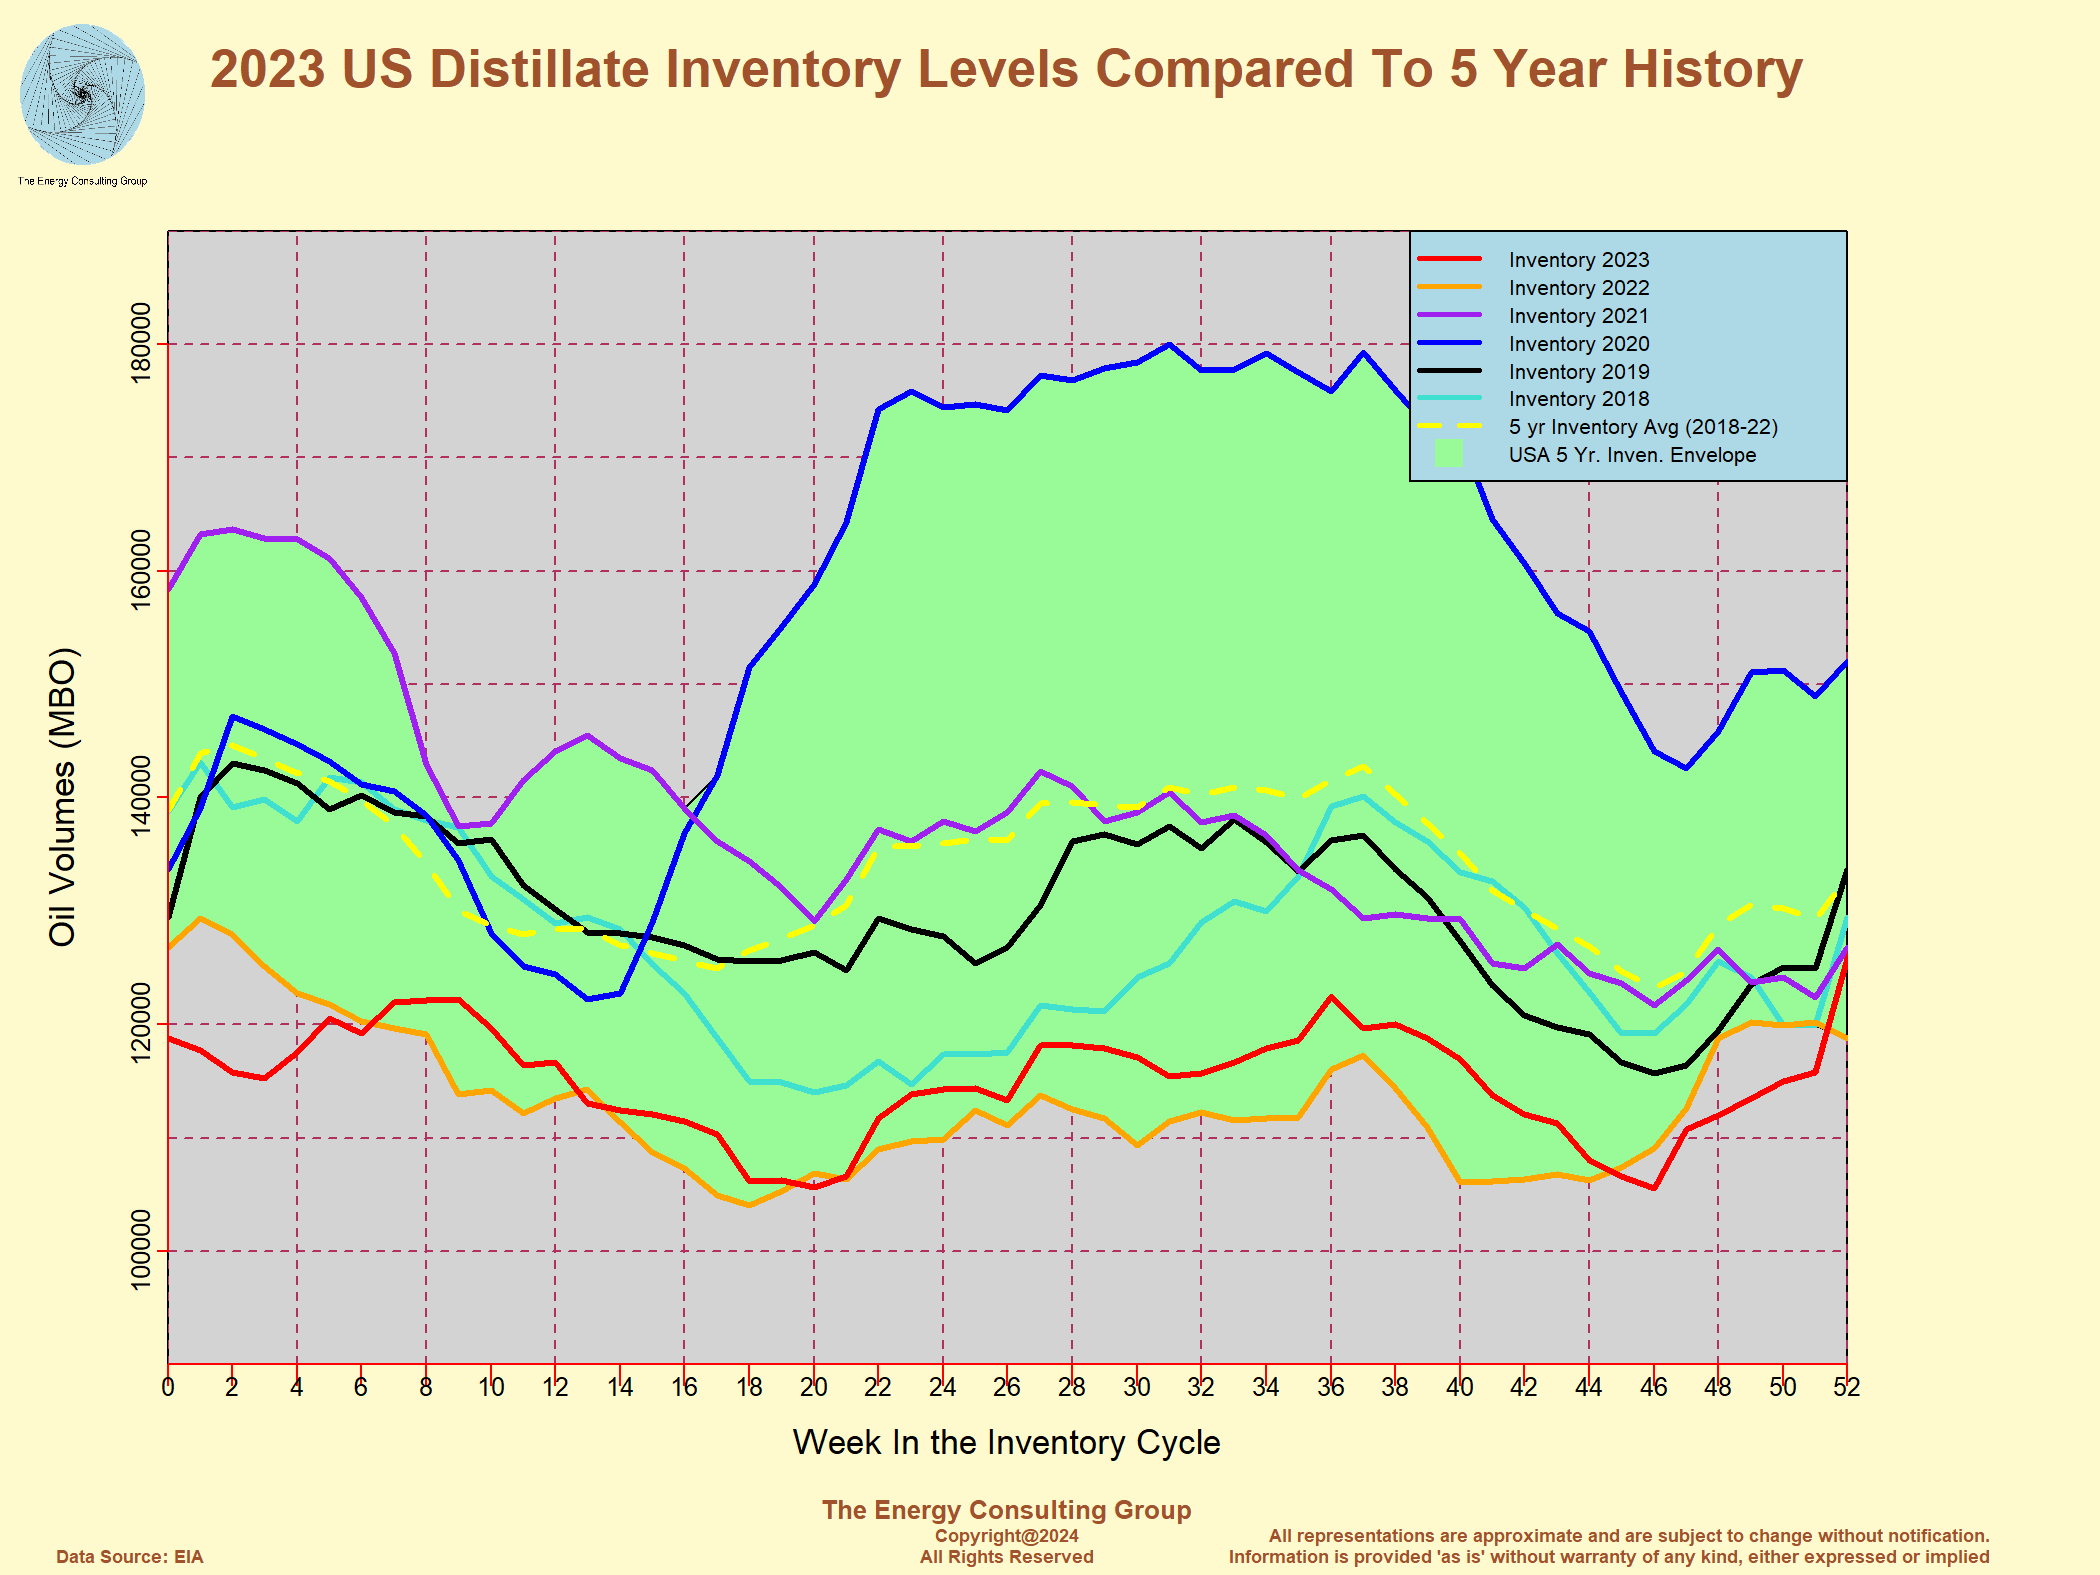 Click on the image for full size version |
Diesel Price ($/gal) No2, Ultra Low Sulfur, Los Angeles Harbor 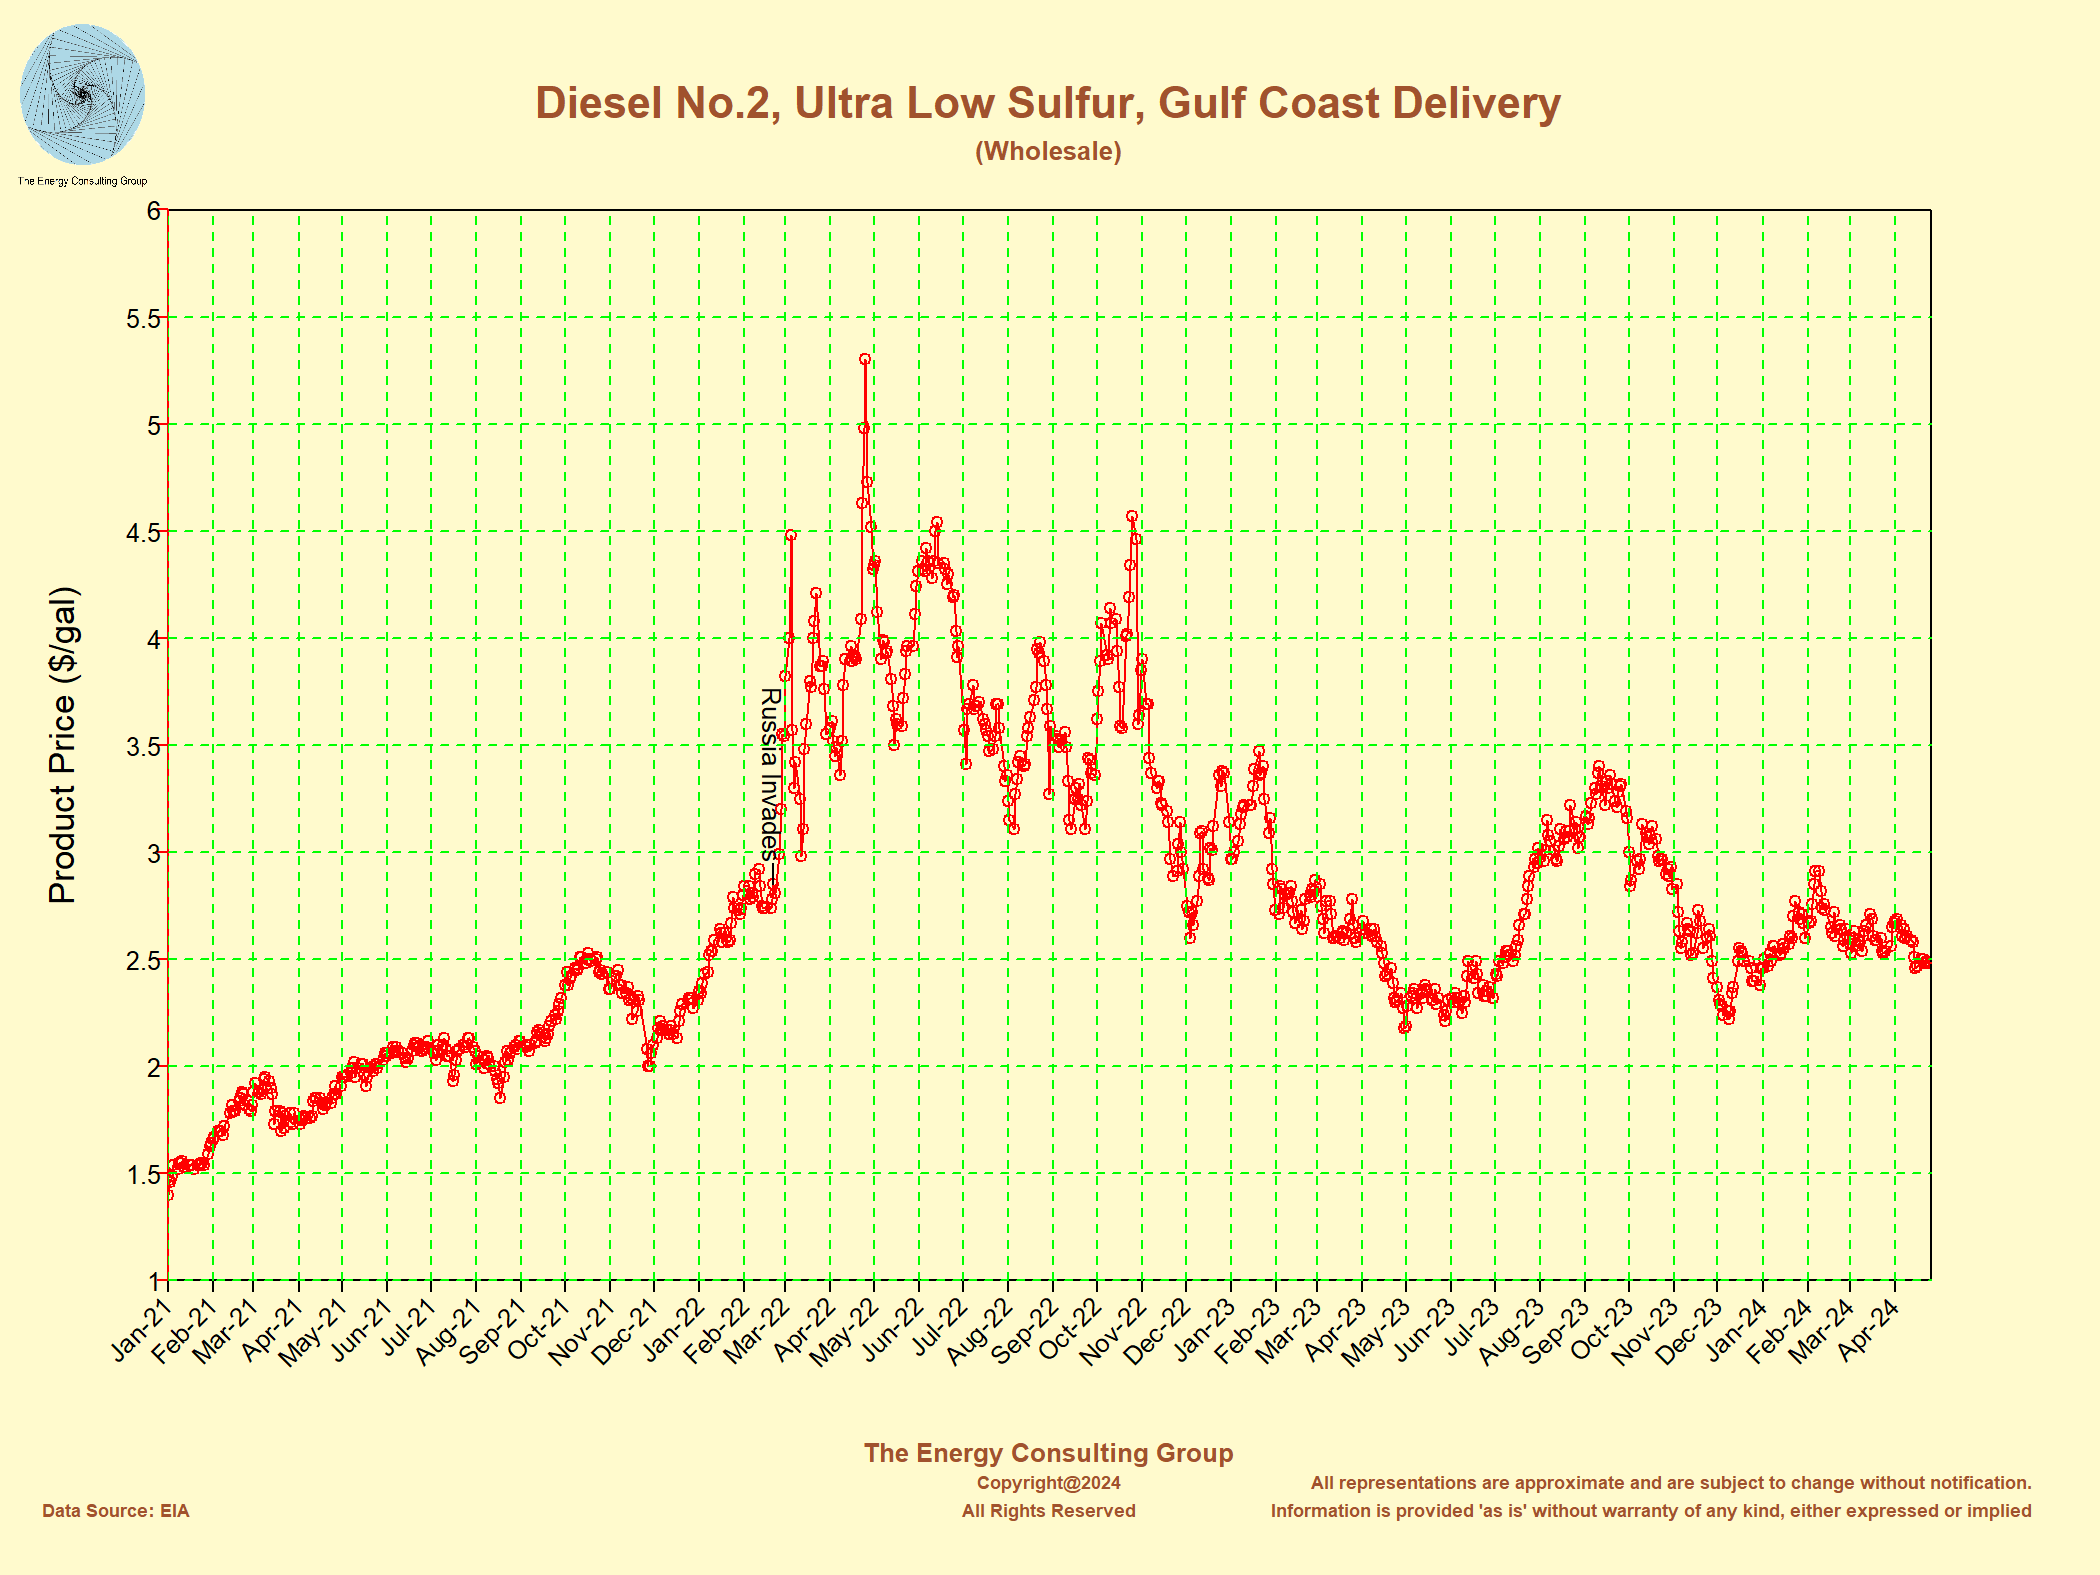 Click on the image for full size version |
US Demand for
Jet-Kero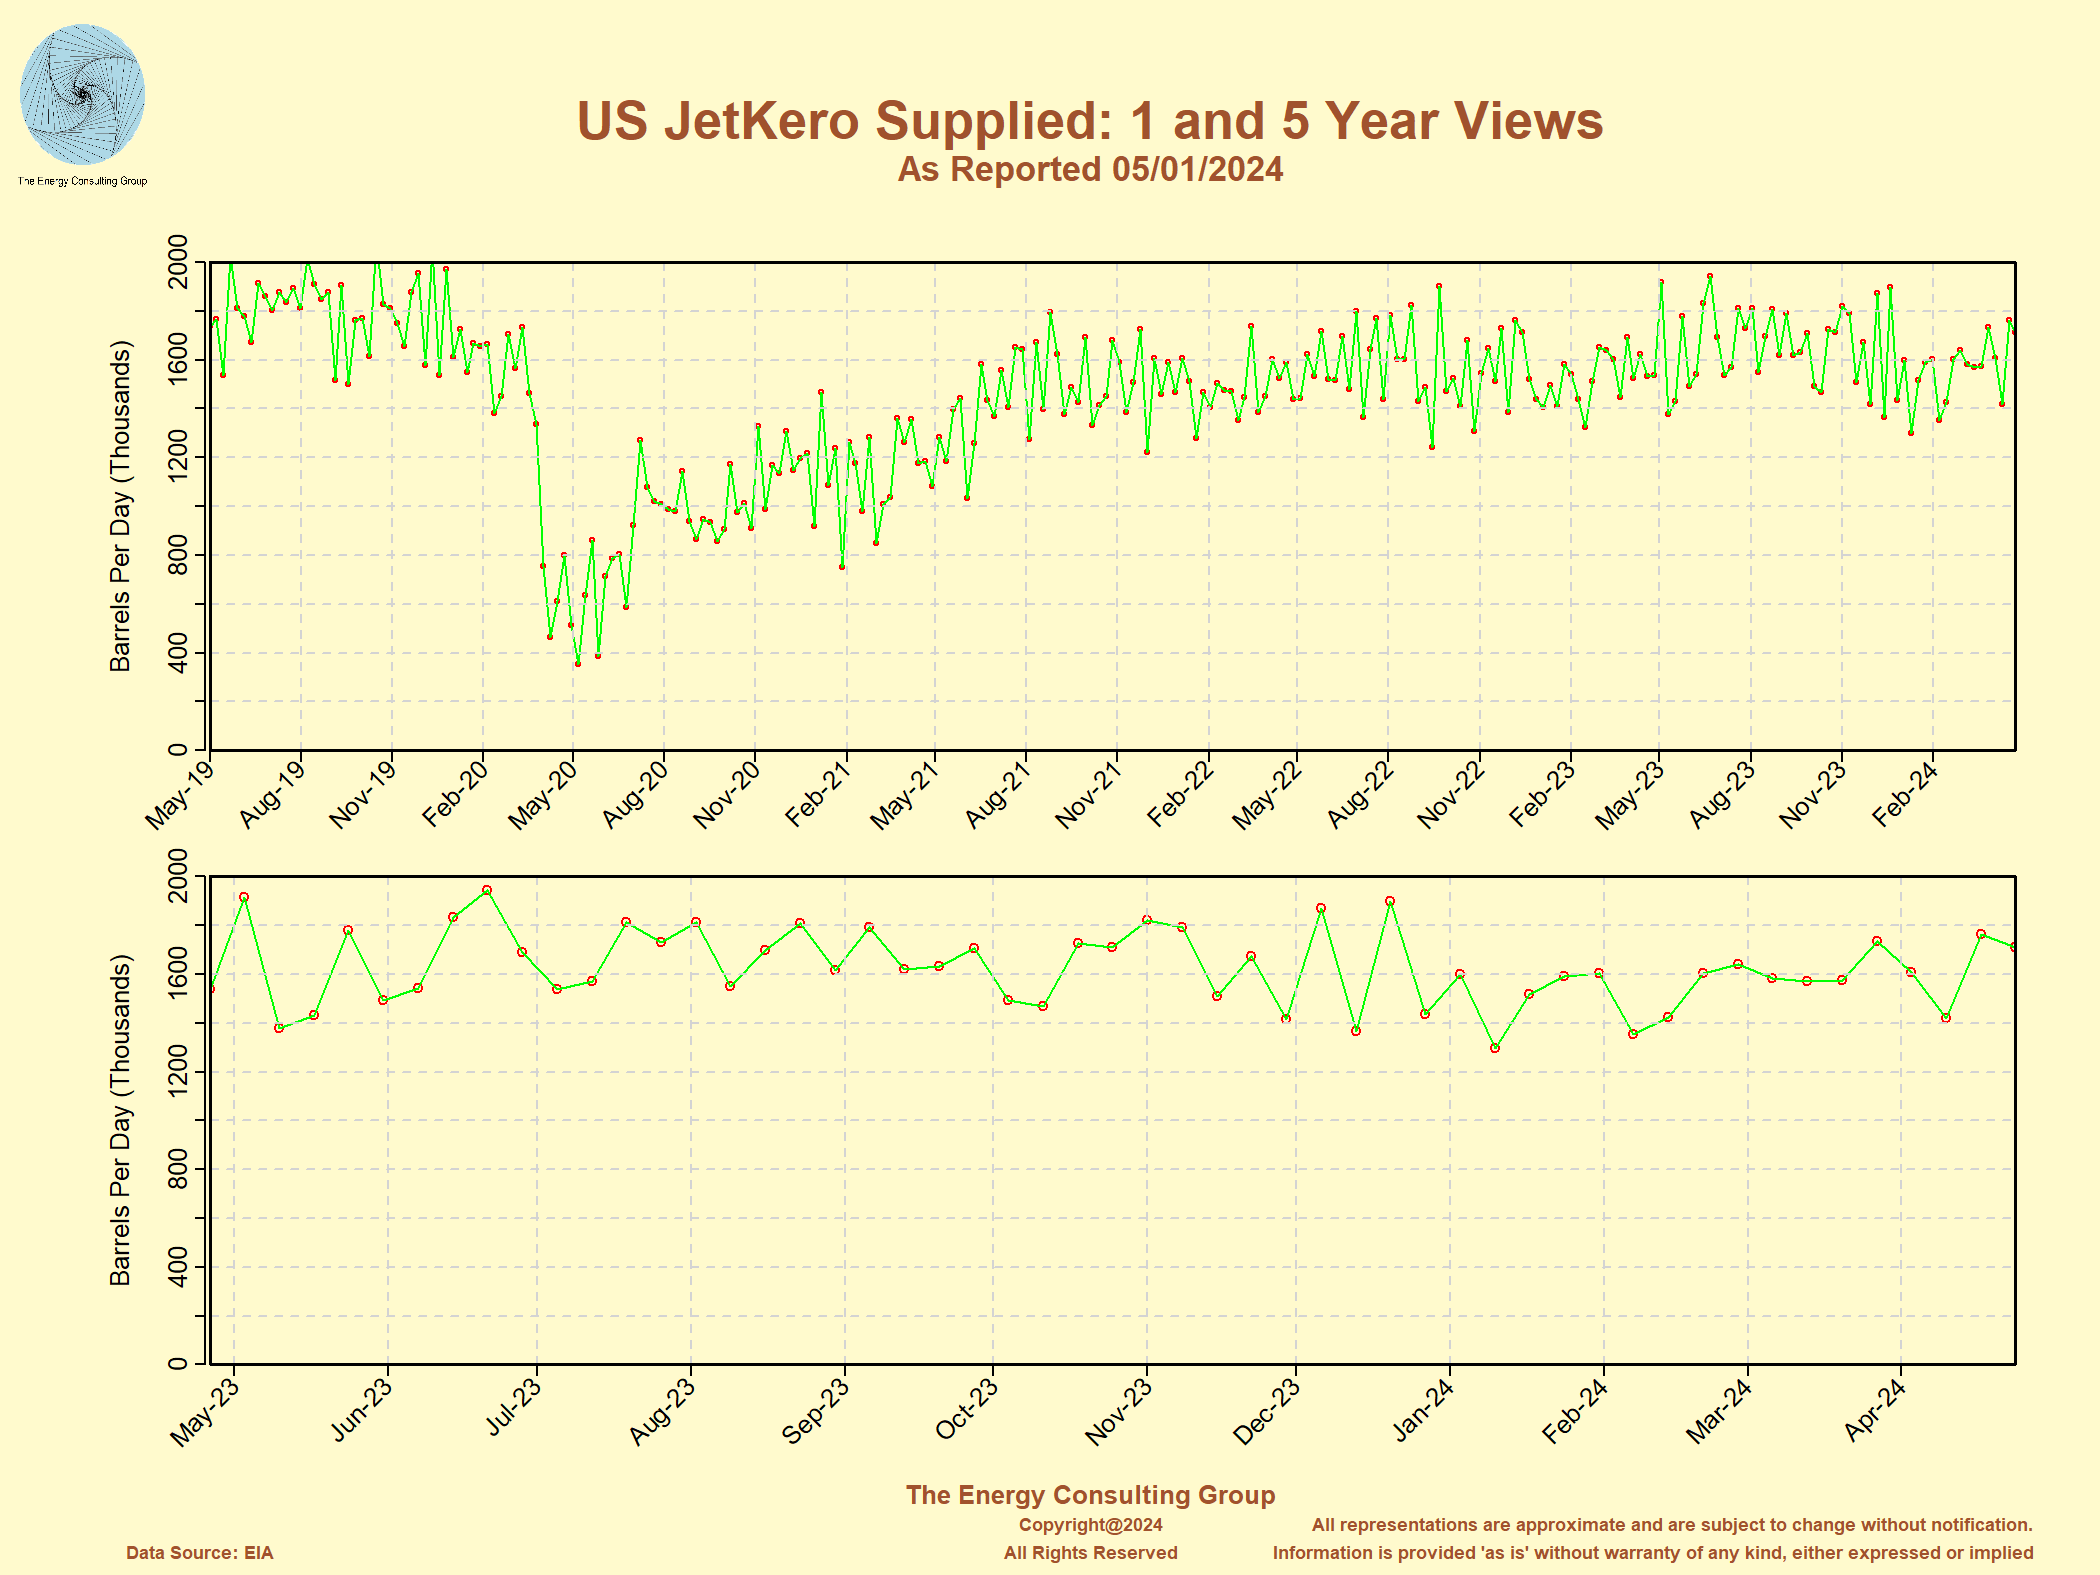 Click on the image for full size version |
2020 US Jet-Kero Inventory Levels vs 5 year History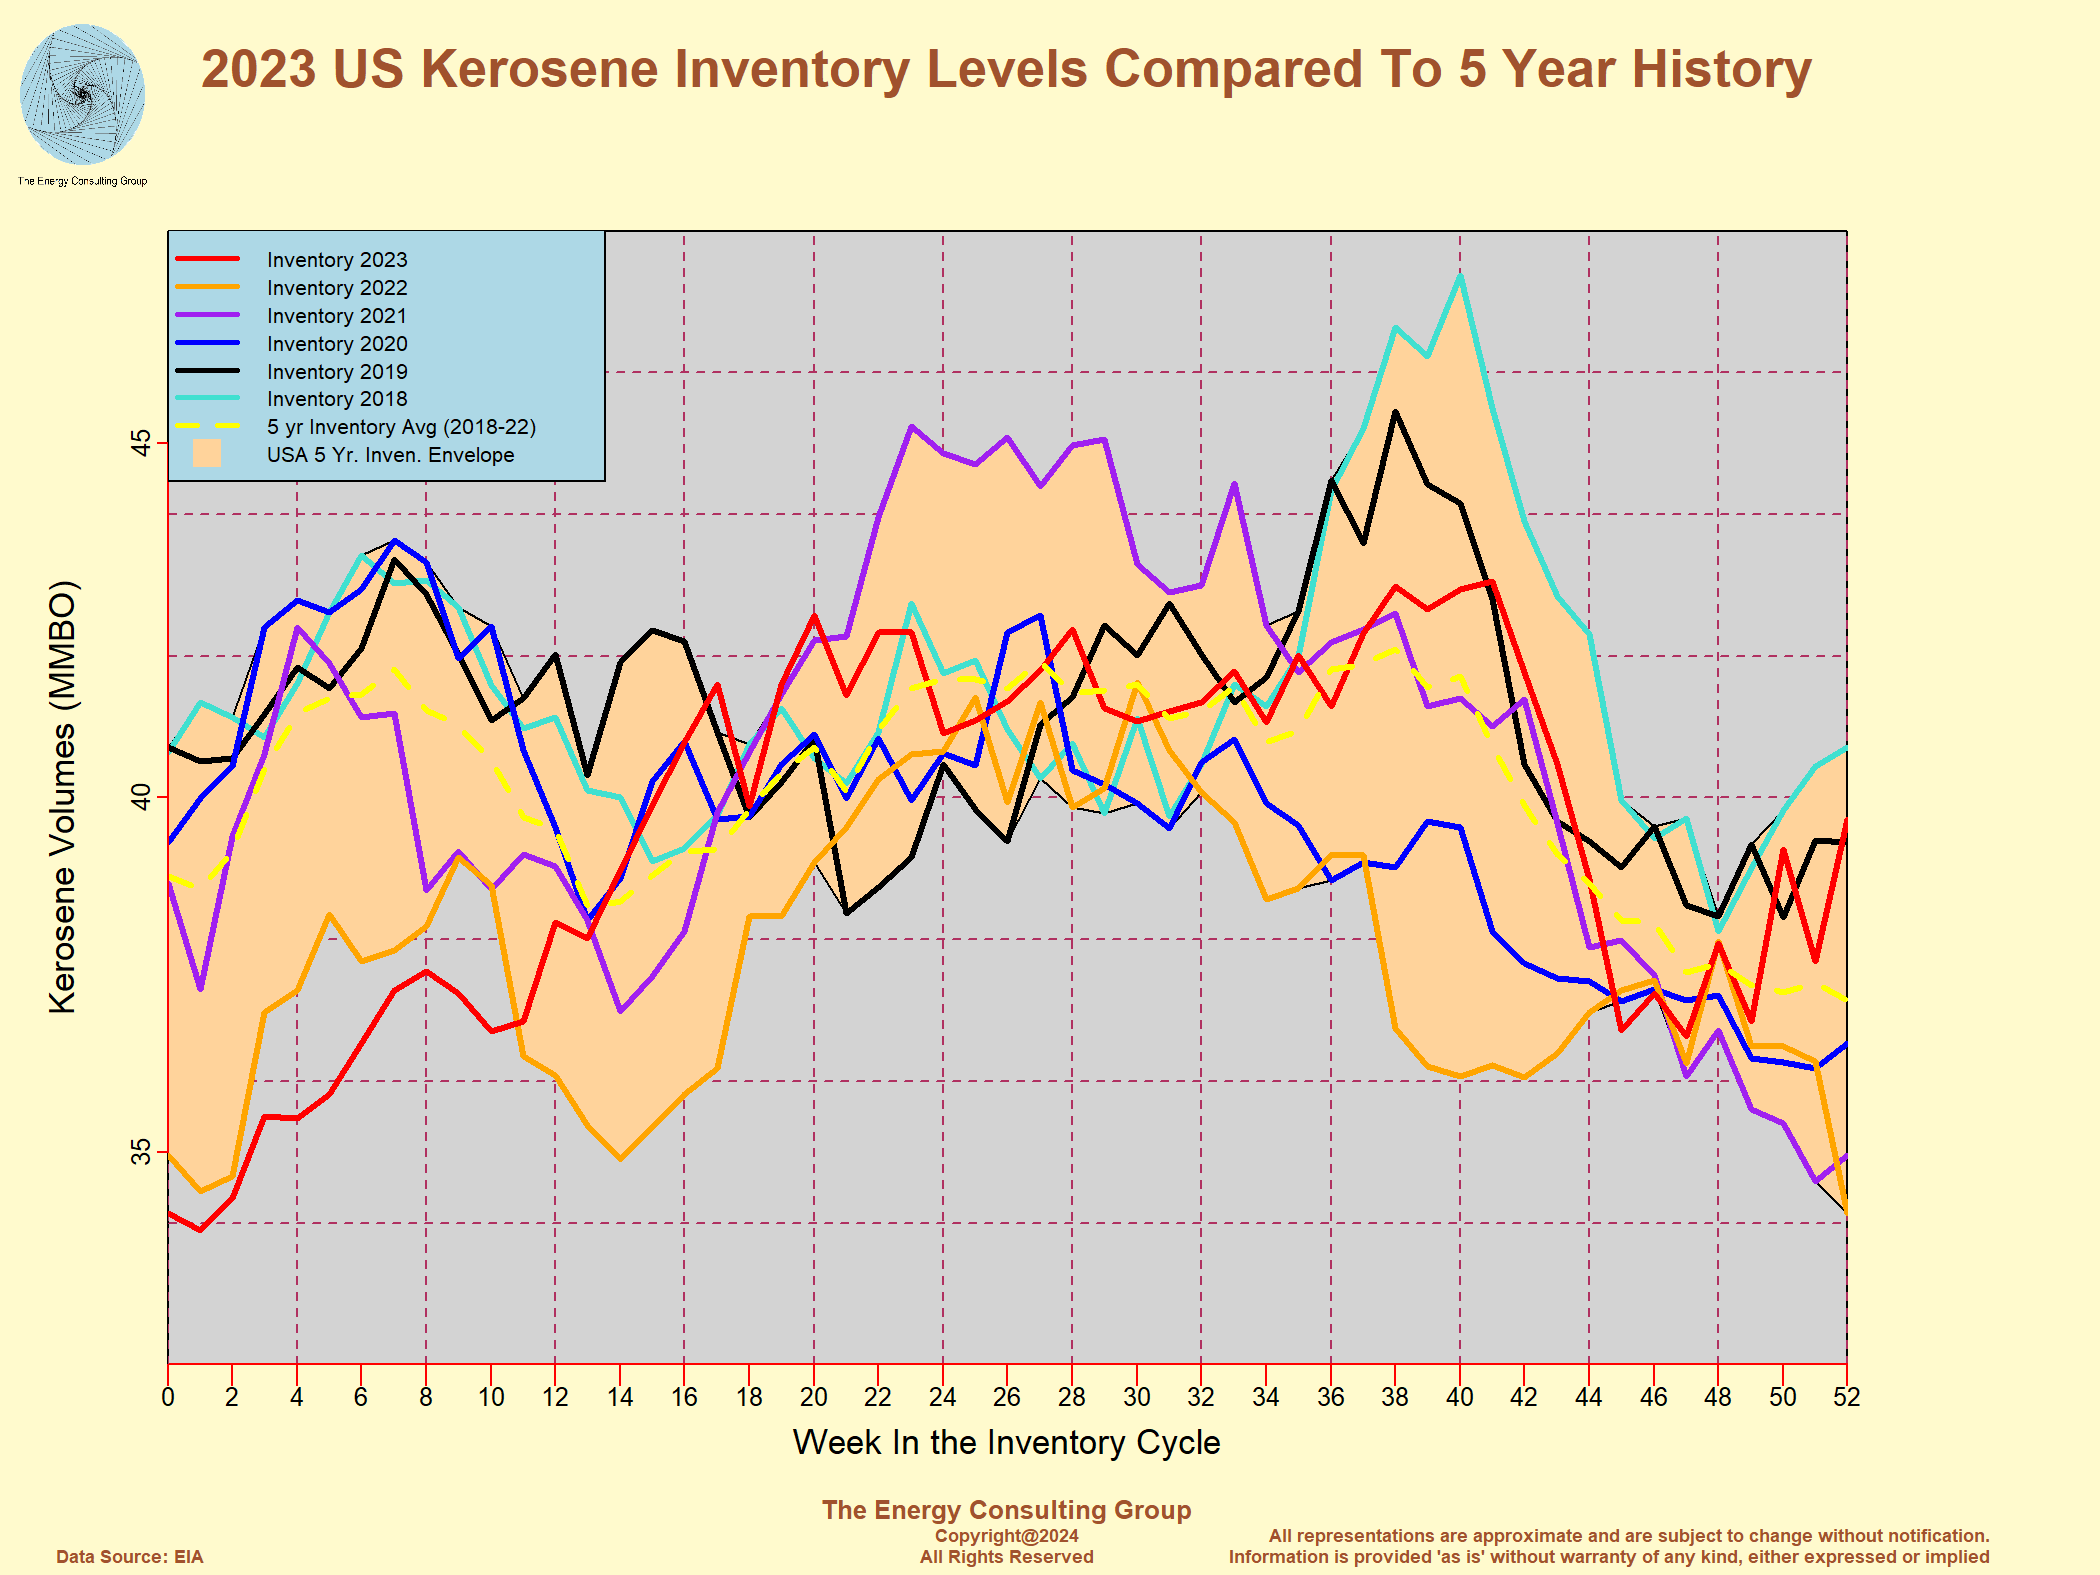 Click on the image for full size version |
Kerosene Type Jet Fuel Price ($/gal),
Gulf Coast Delivery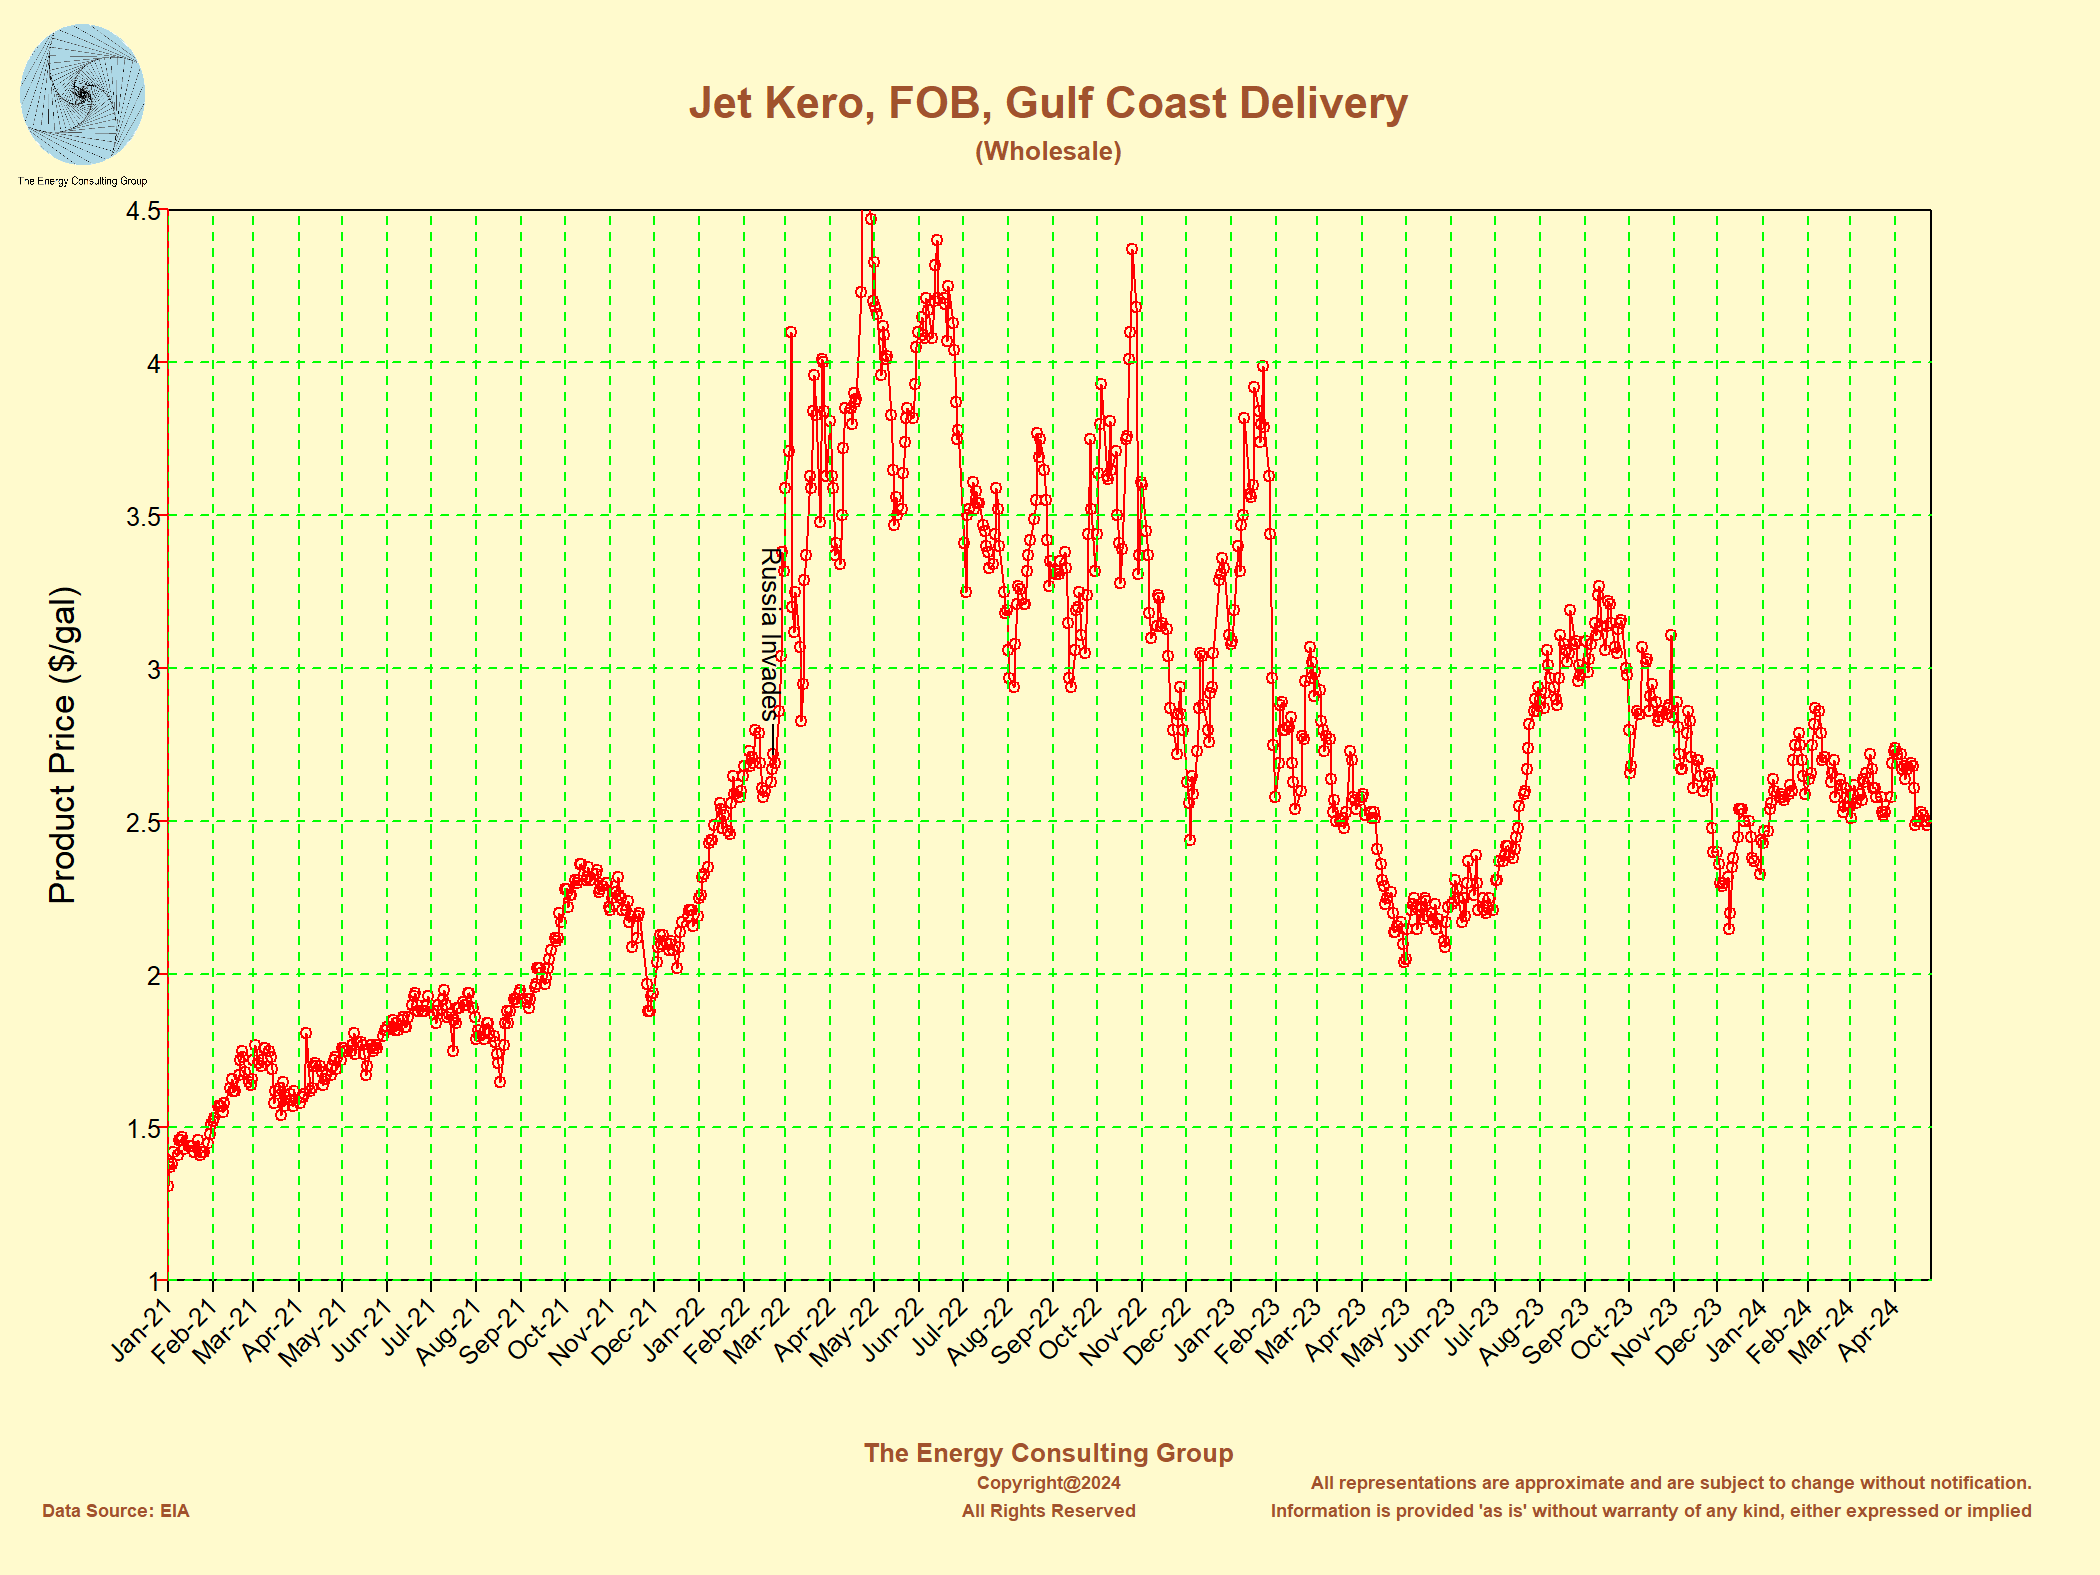 Click on the image for full size version |
US Demand for Propane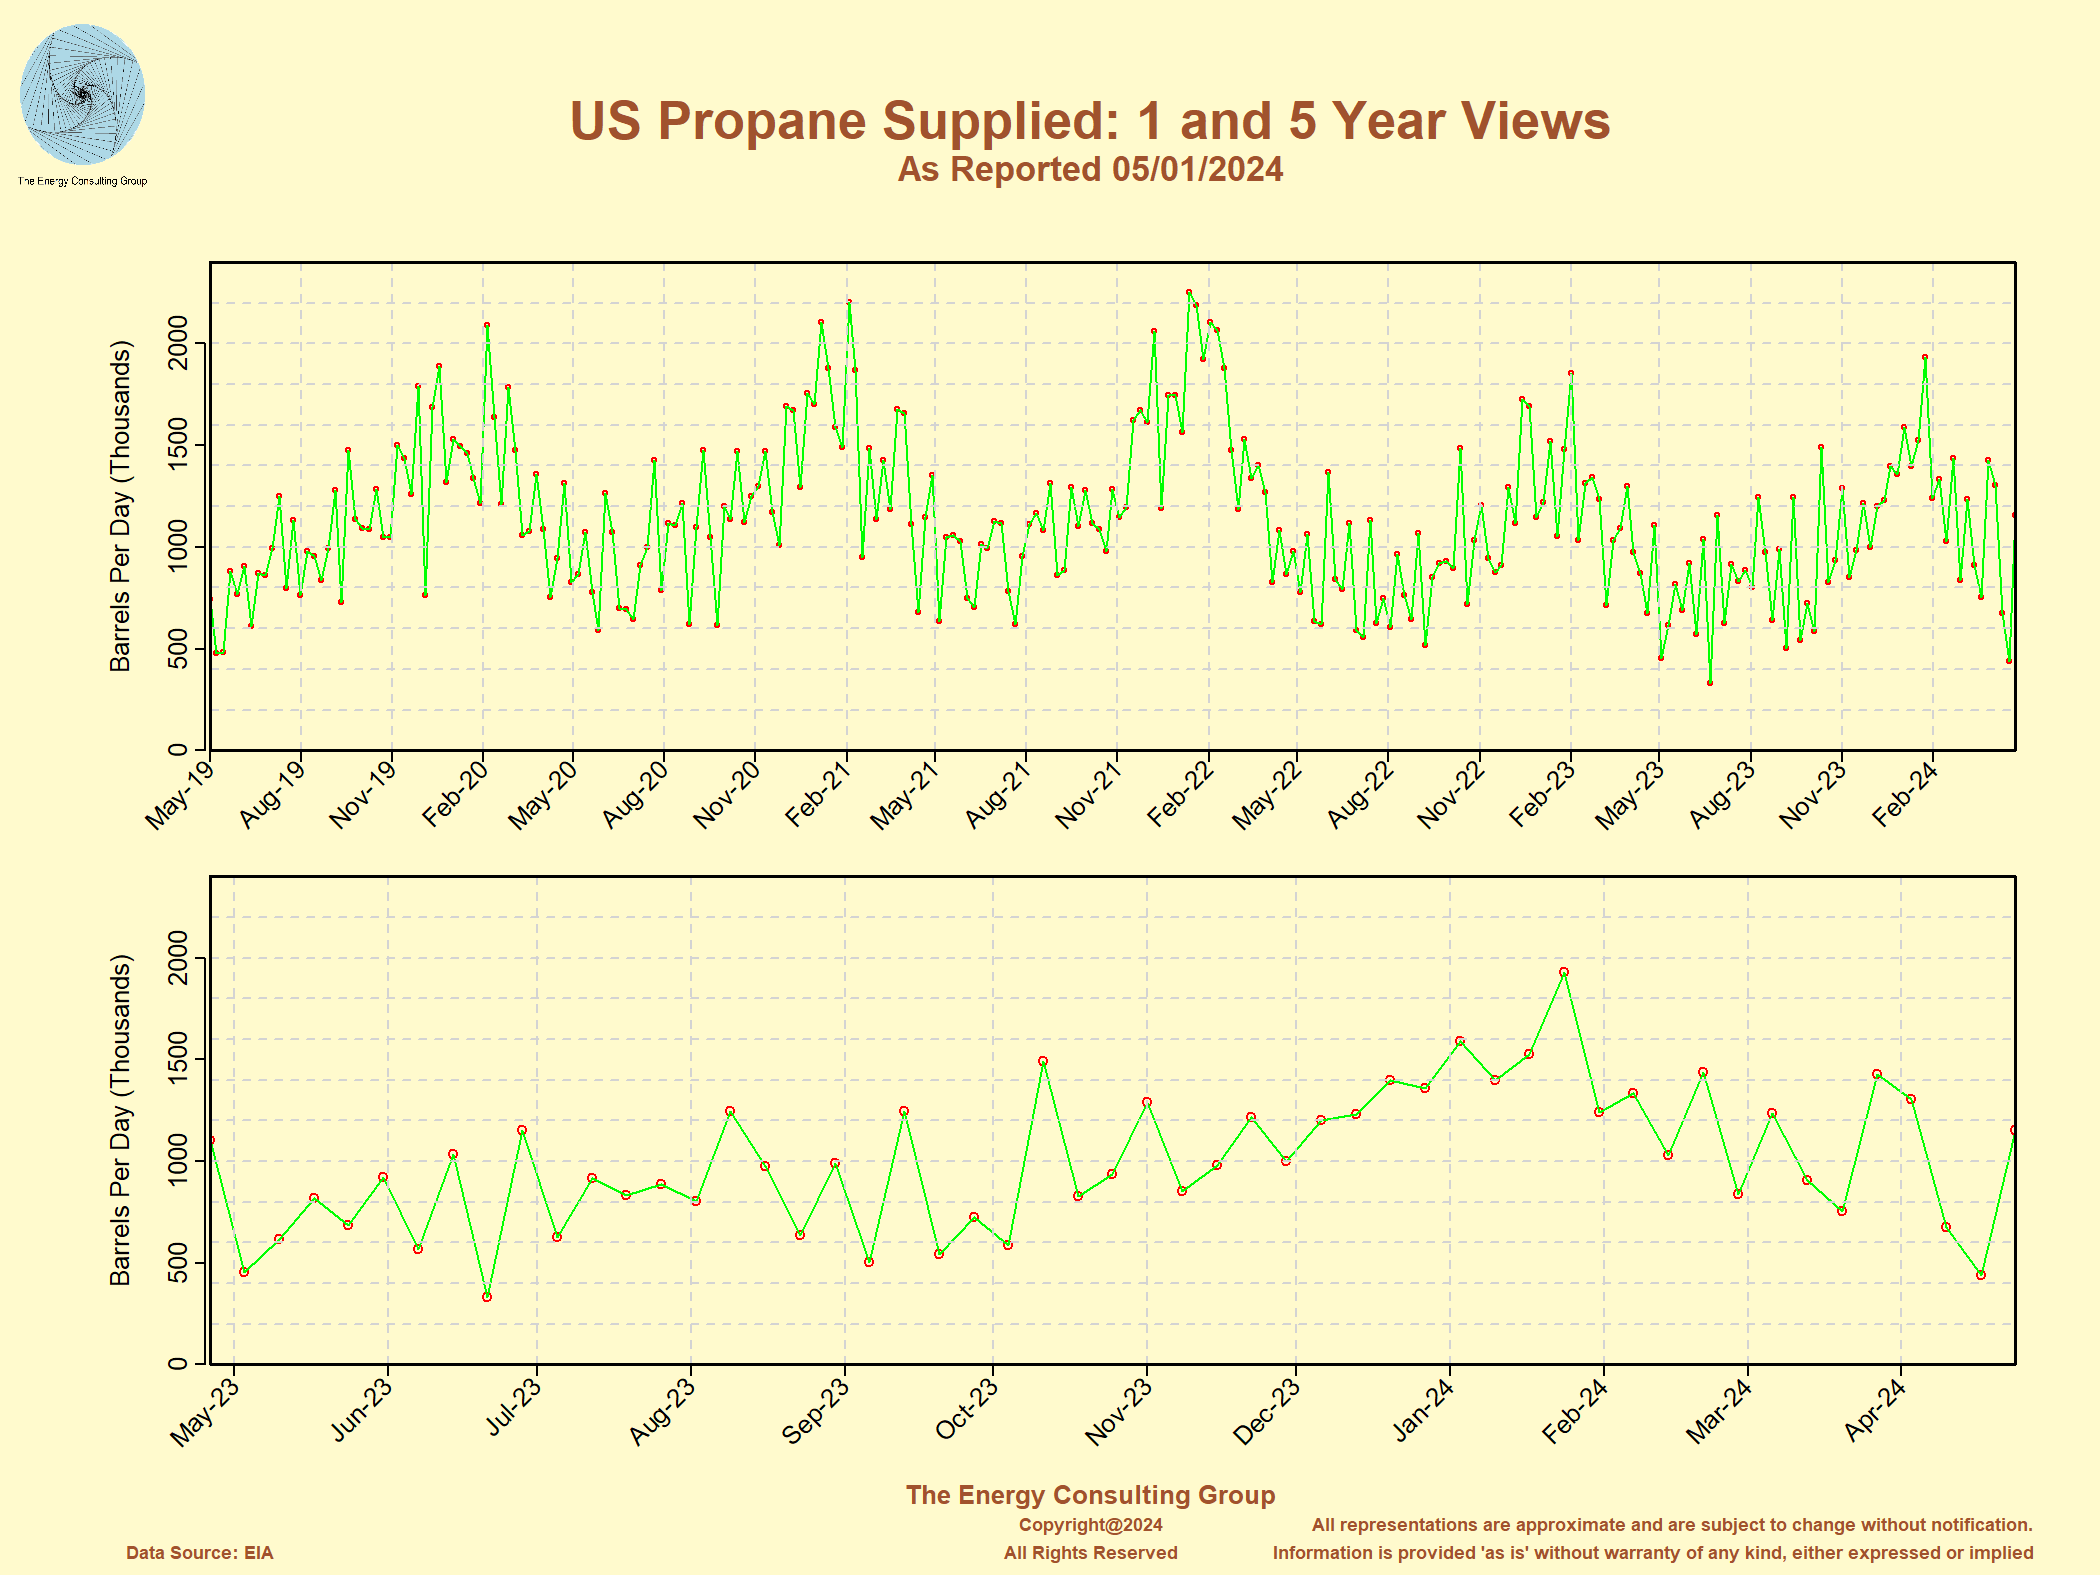 Click on the image for full size version |
2020 US Propane Inventory Levels vs 5 year History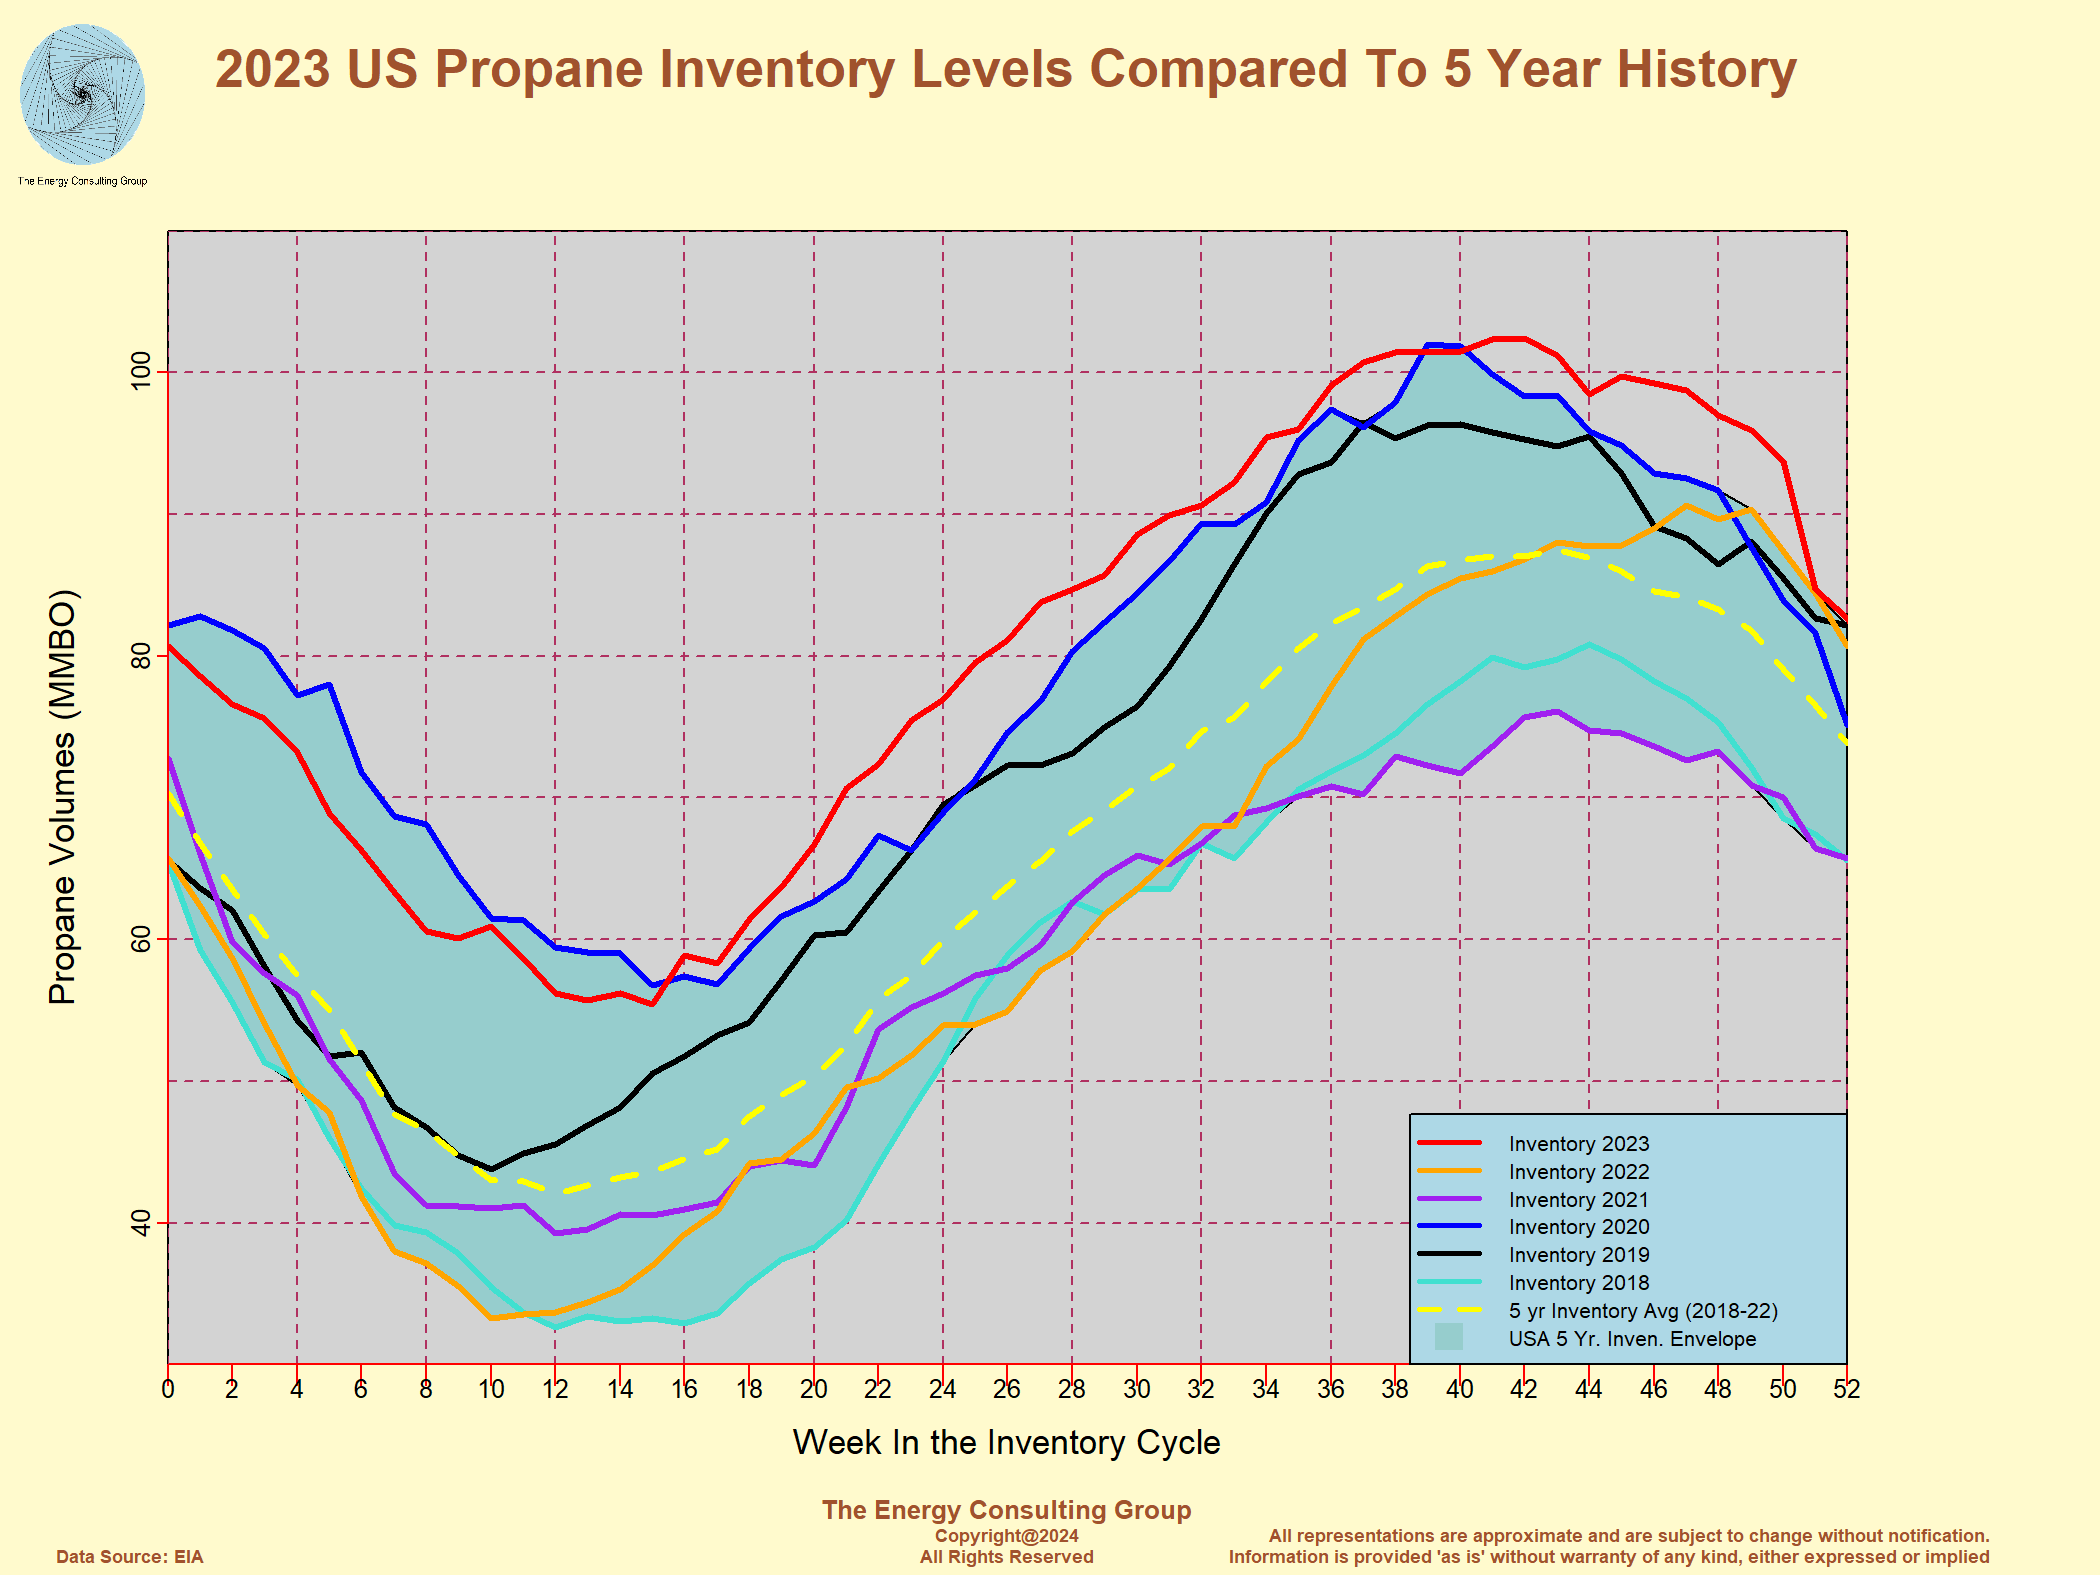 Click on the image for full size version |
Propane Price ($/gal), Mont Belvieu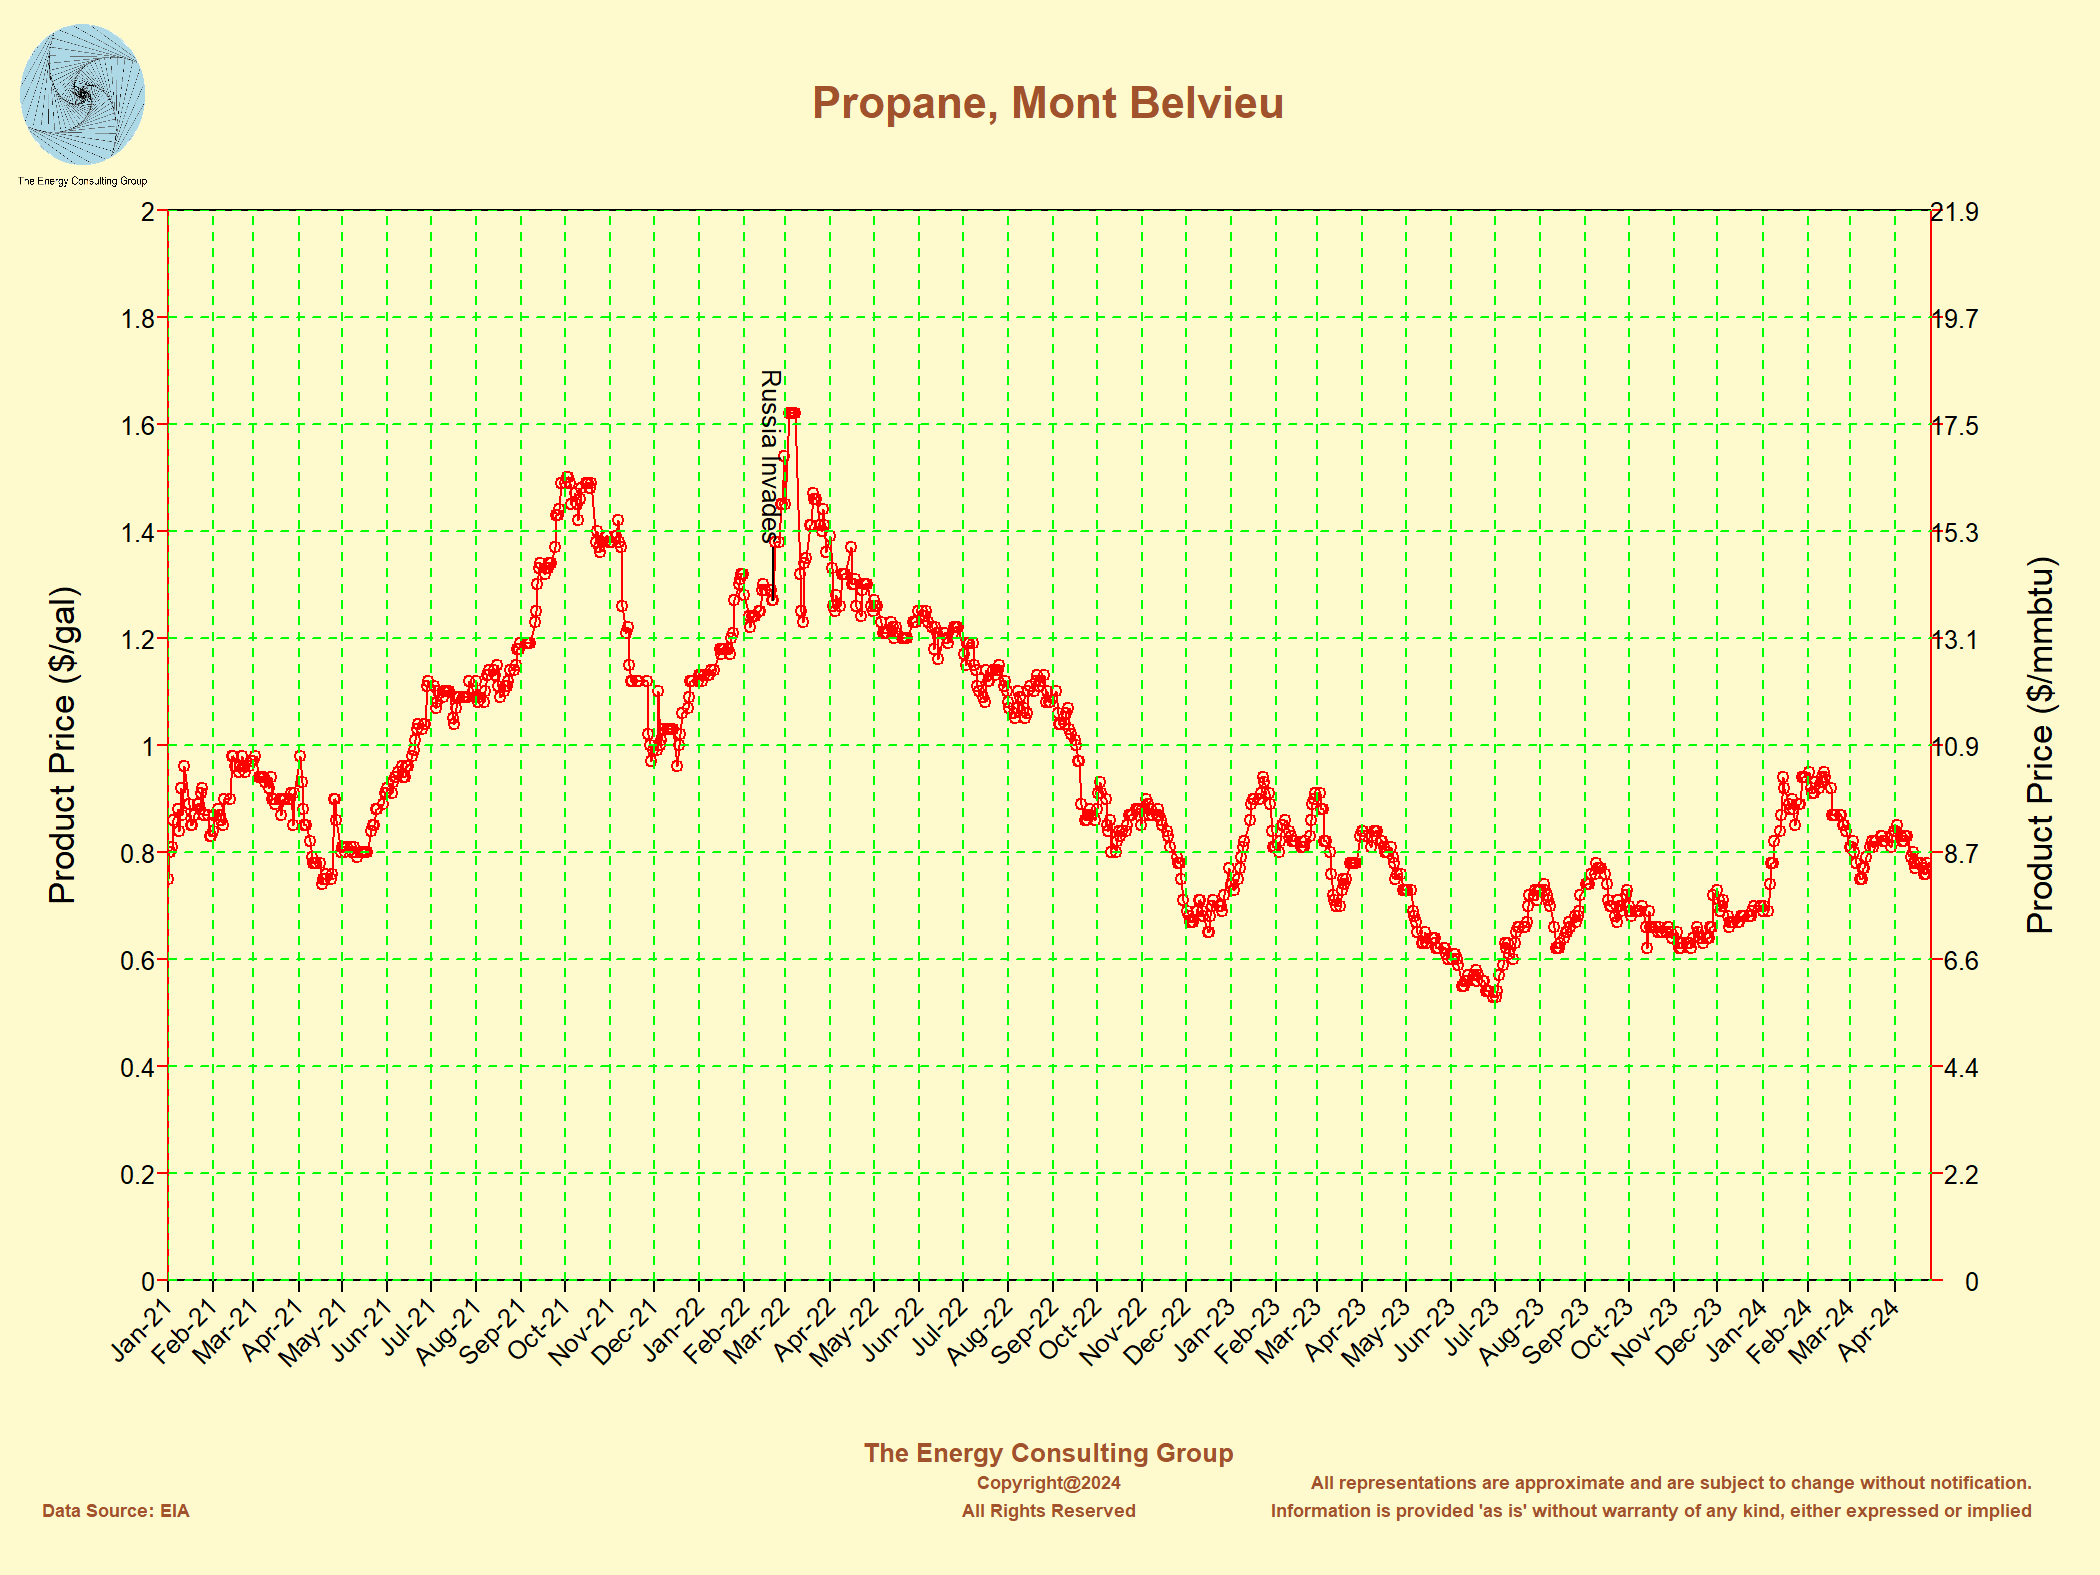 Click on the image for full size version |
US Supply of Renewable Fuels (primarily ethanol)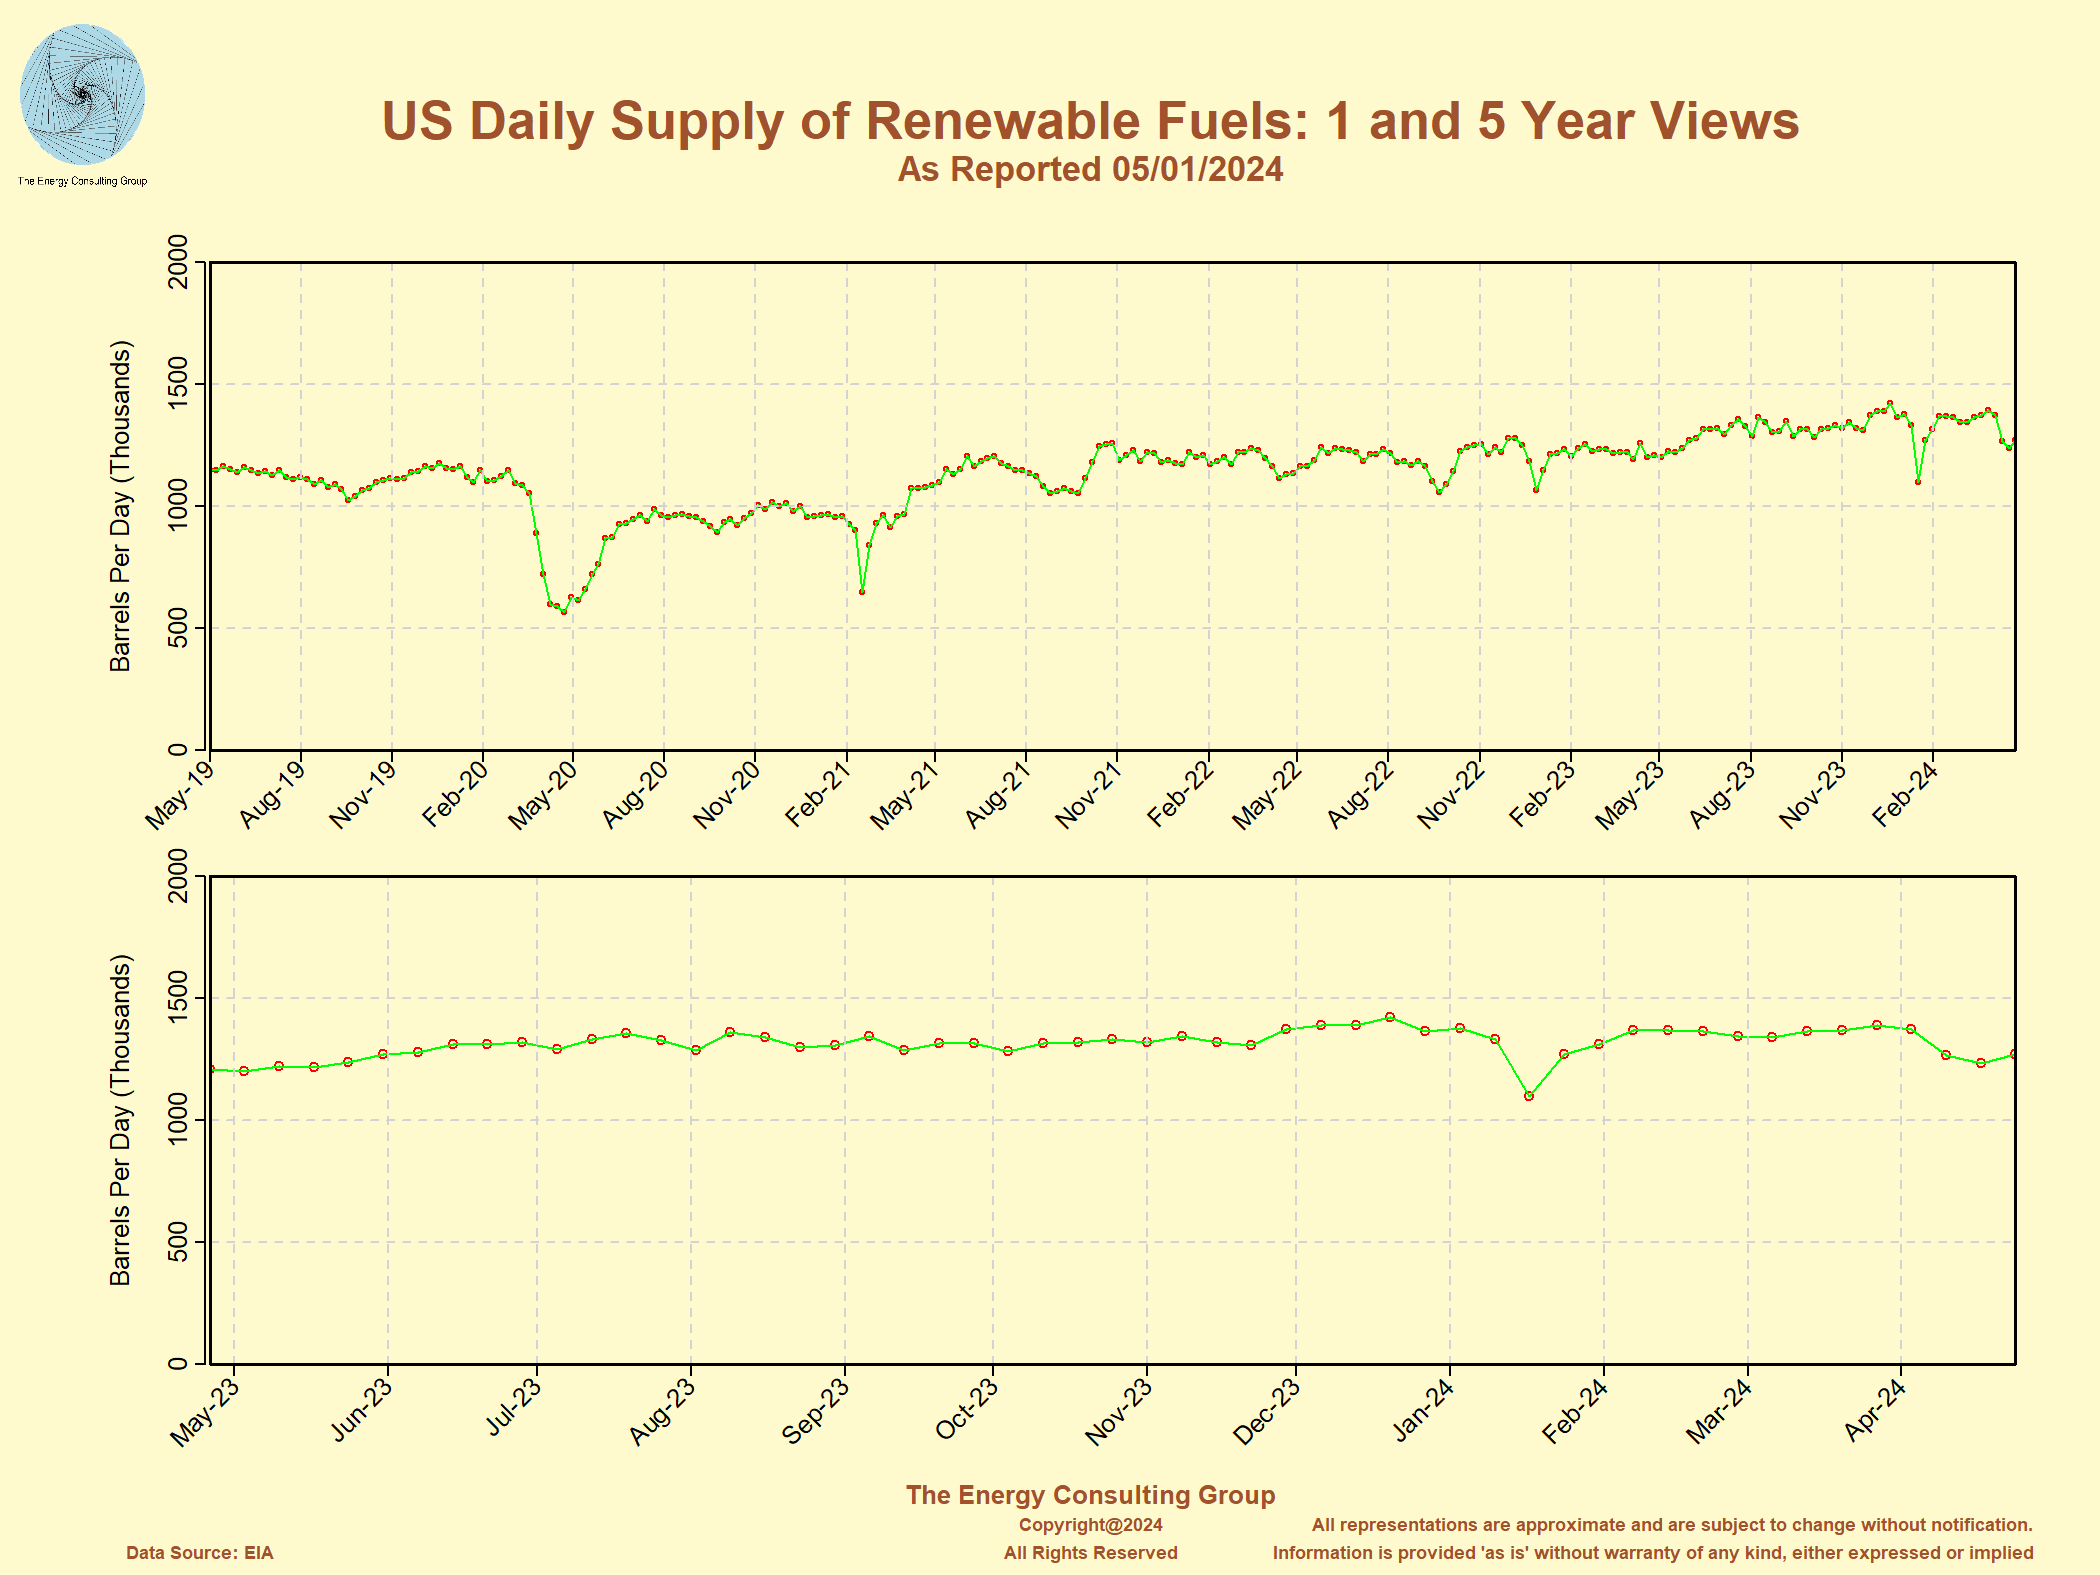 Click on the image for full size version |
Daily Production in the US of Natural Gas Liquids (Ethane,
Propane, Butane, etc.)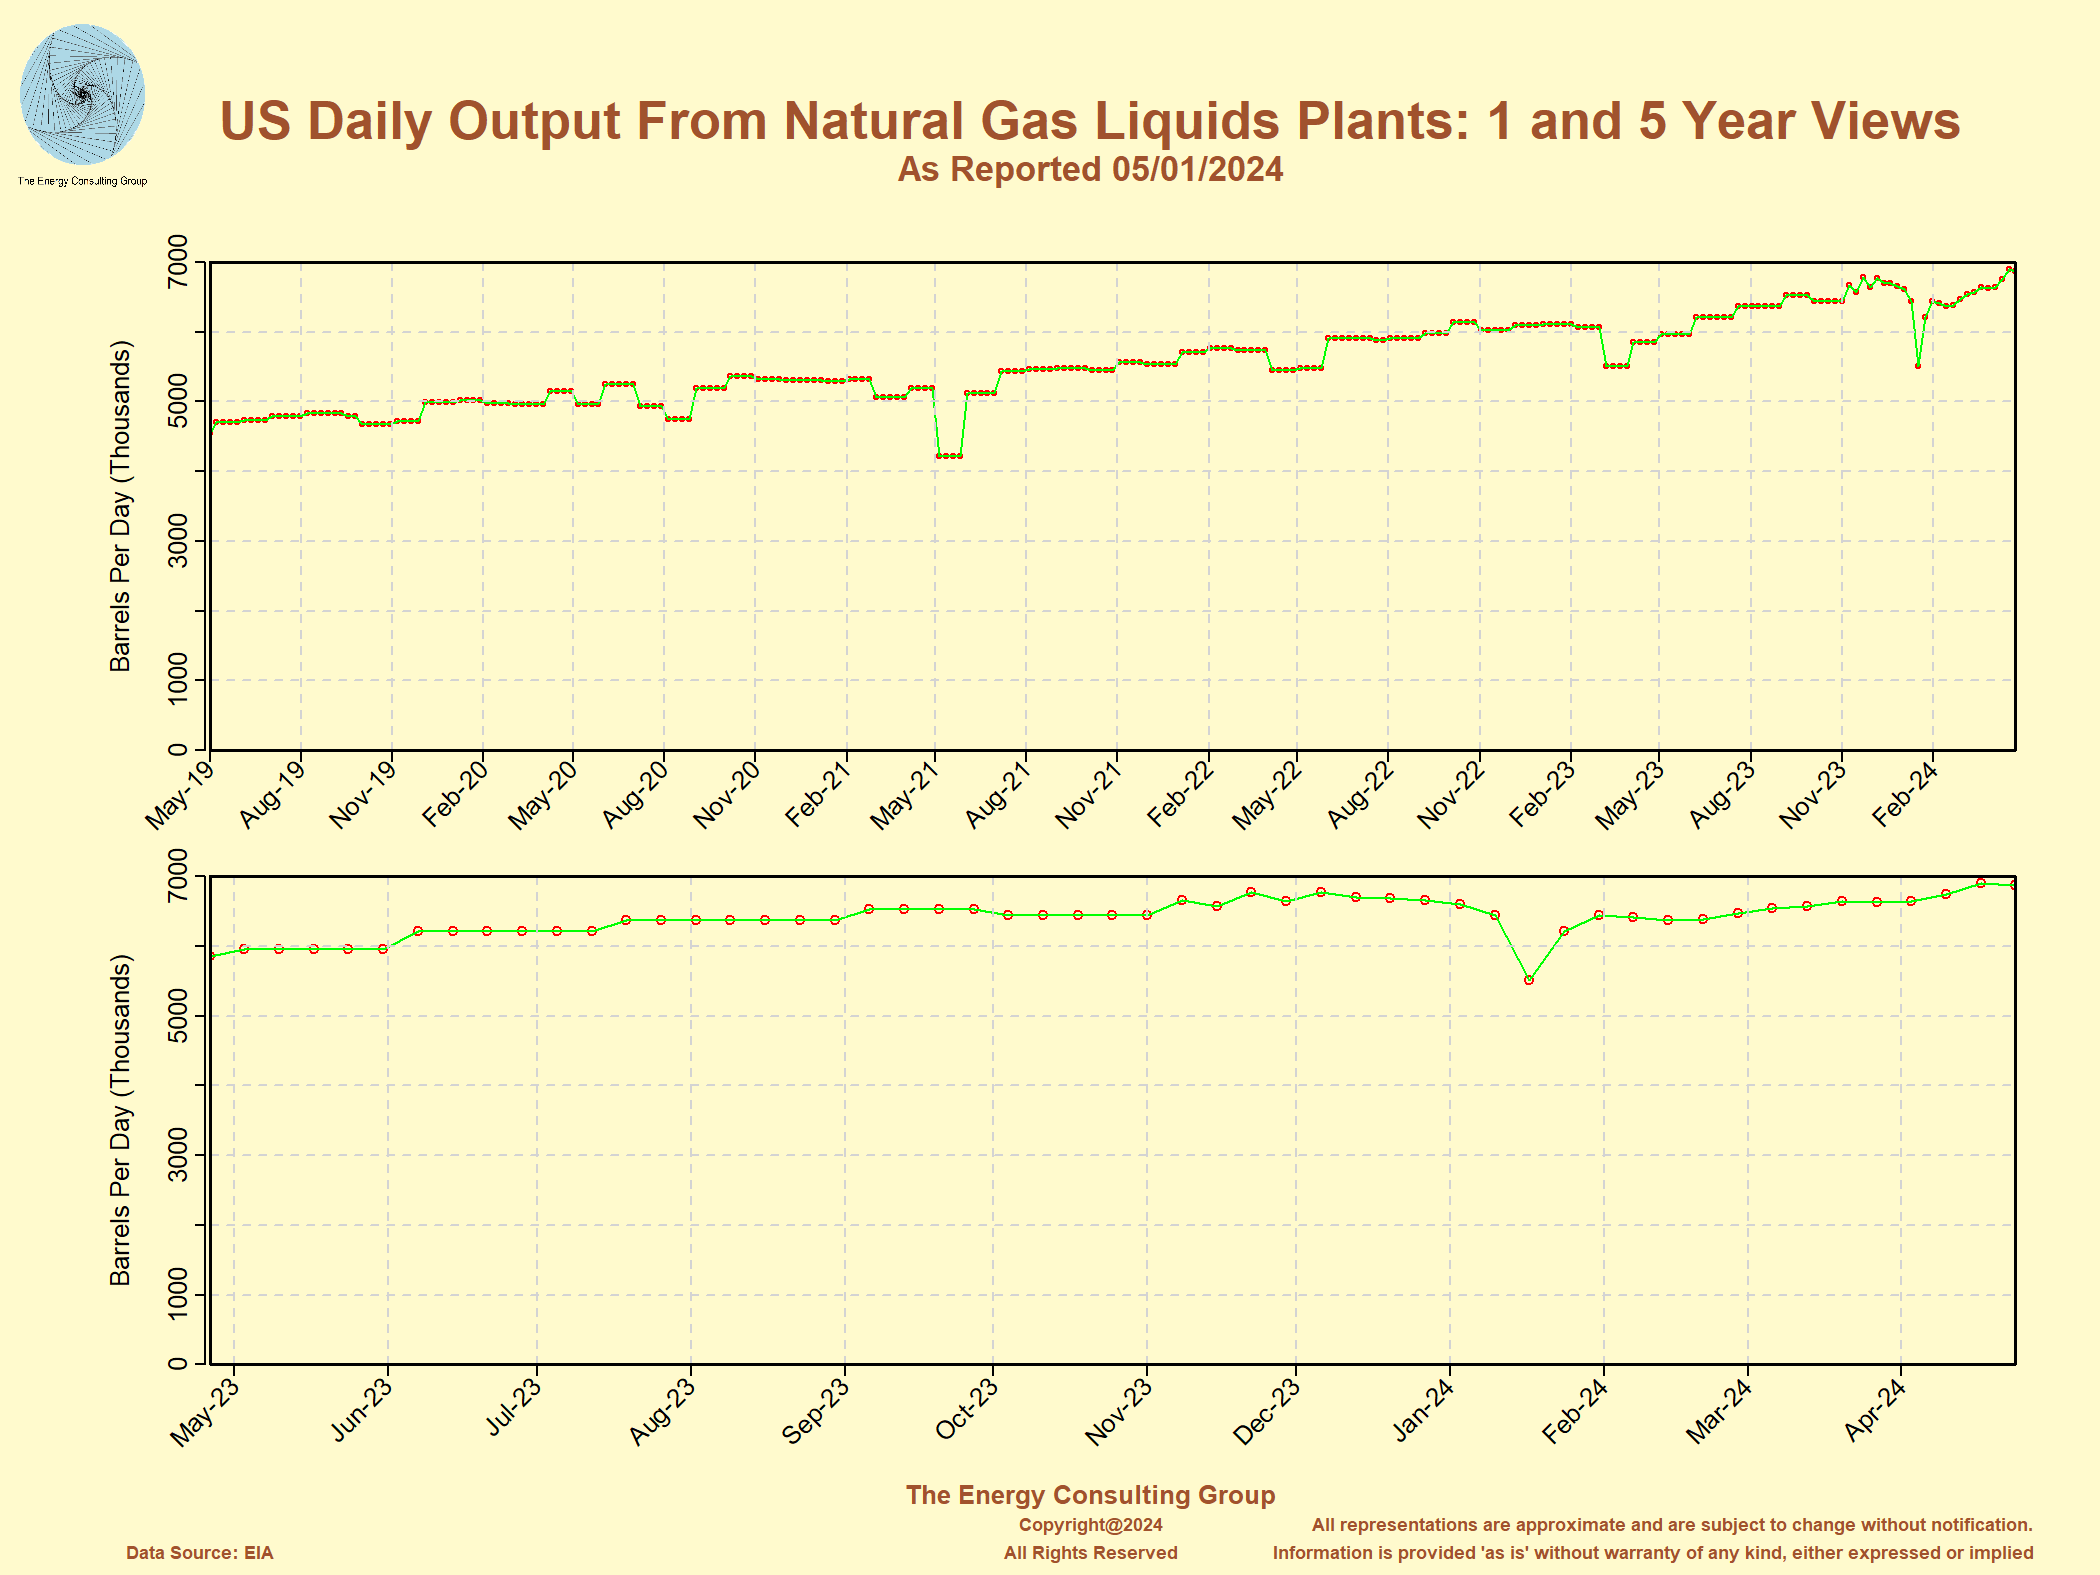 Click on the image for full size version |
US Crude Oil Exports and Imports
|
US Daily Crude Oil Exports: 1 and 5 Year Perspectives 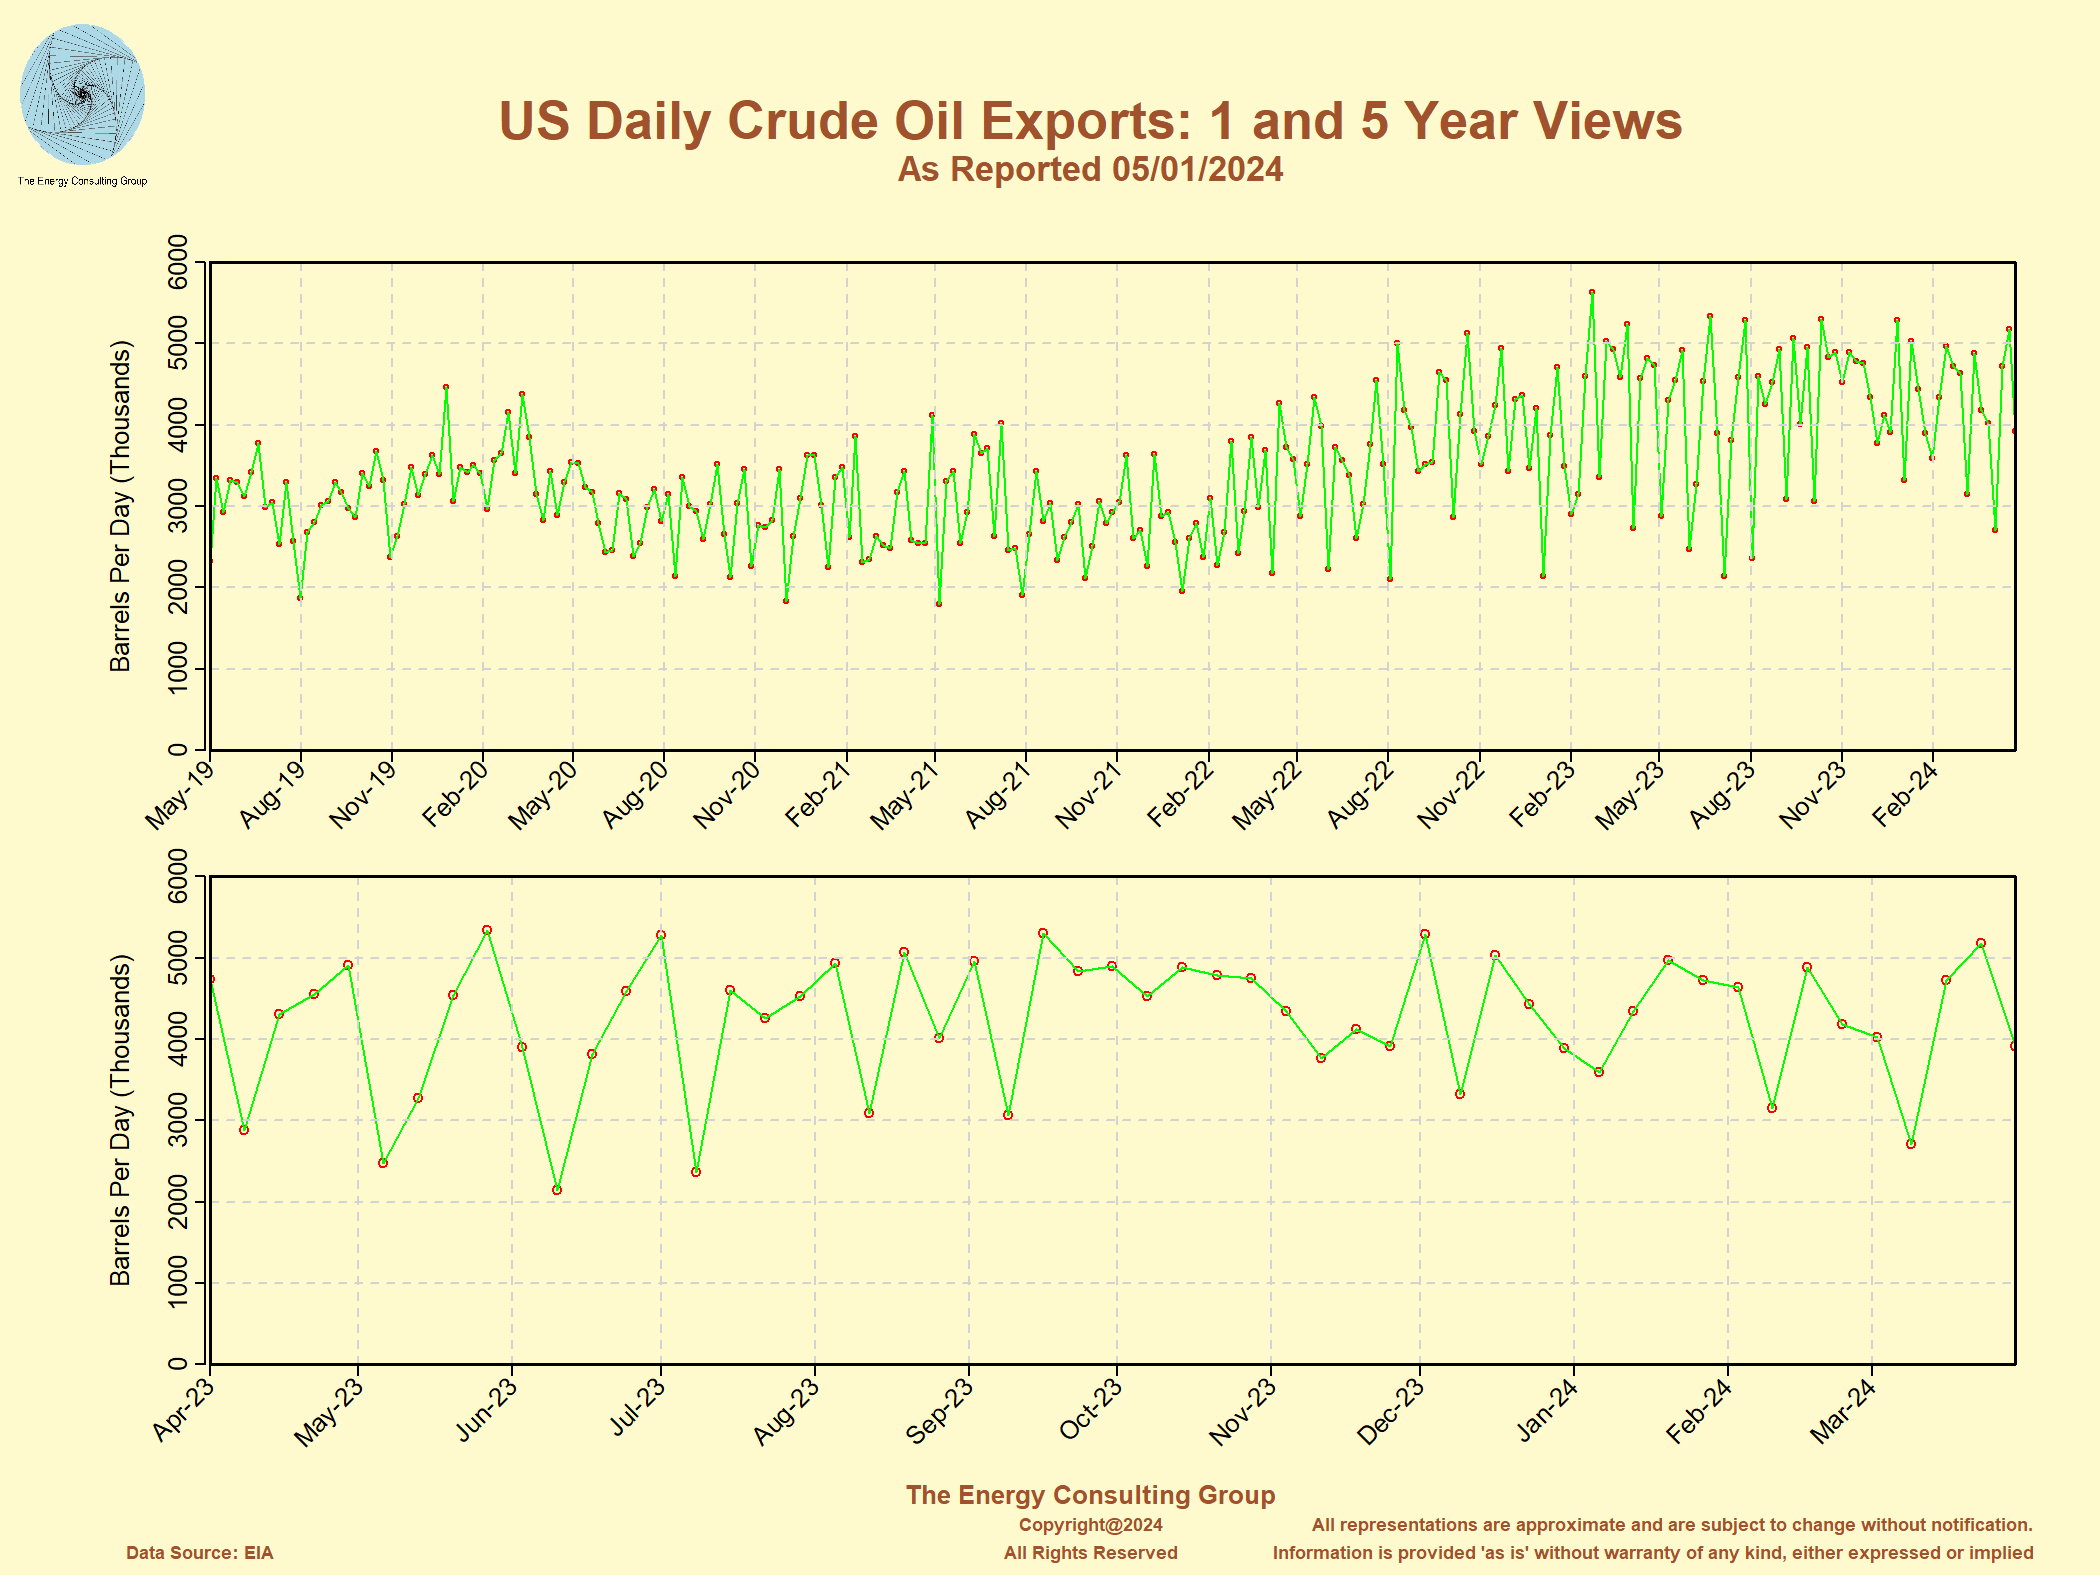 Click on the image for full size version |
US Daily Crude Oil Imports: 1 and 5 Year Perspectives 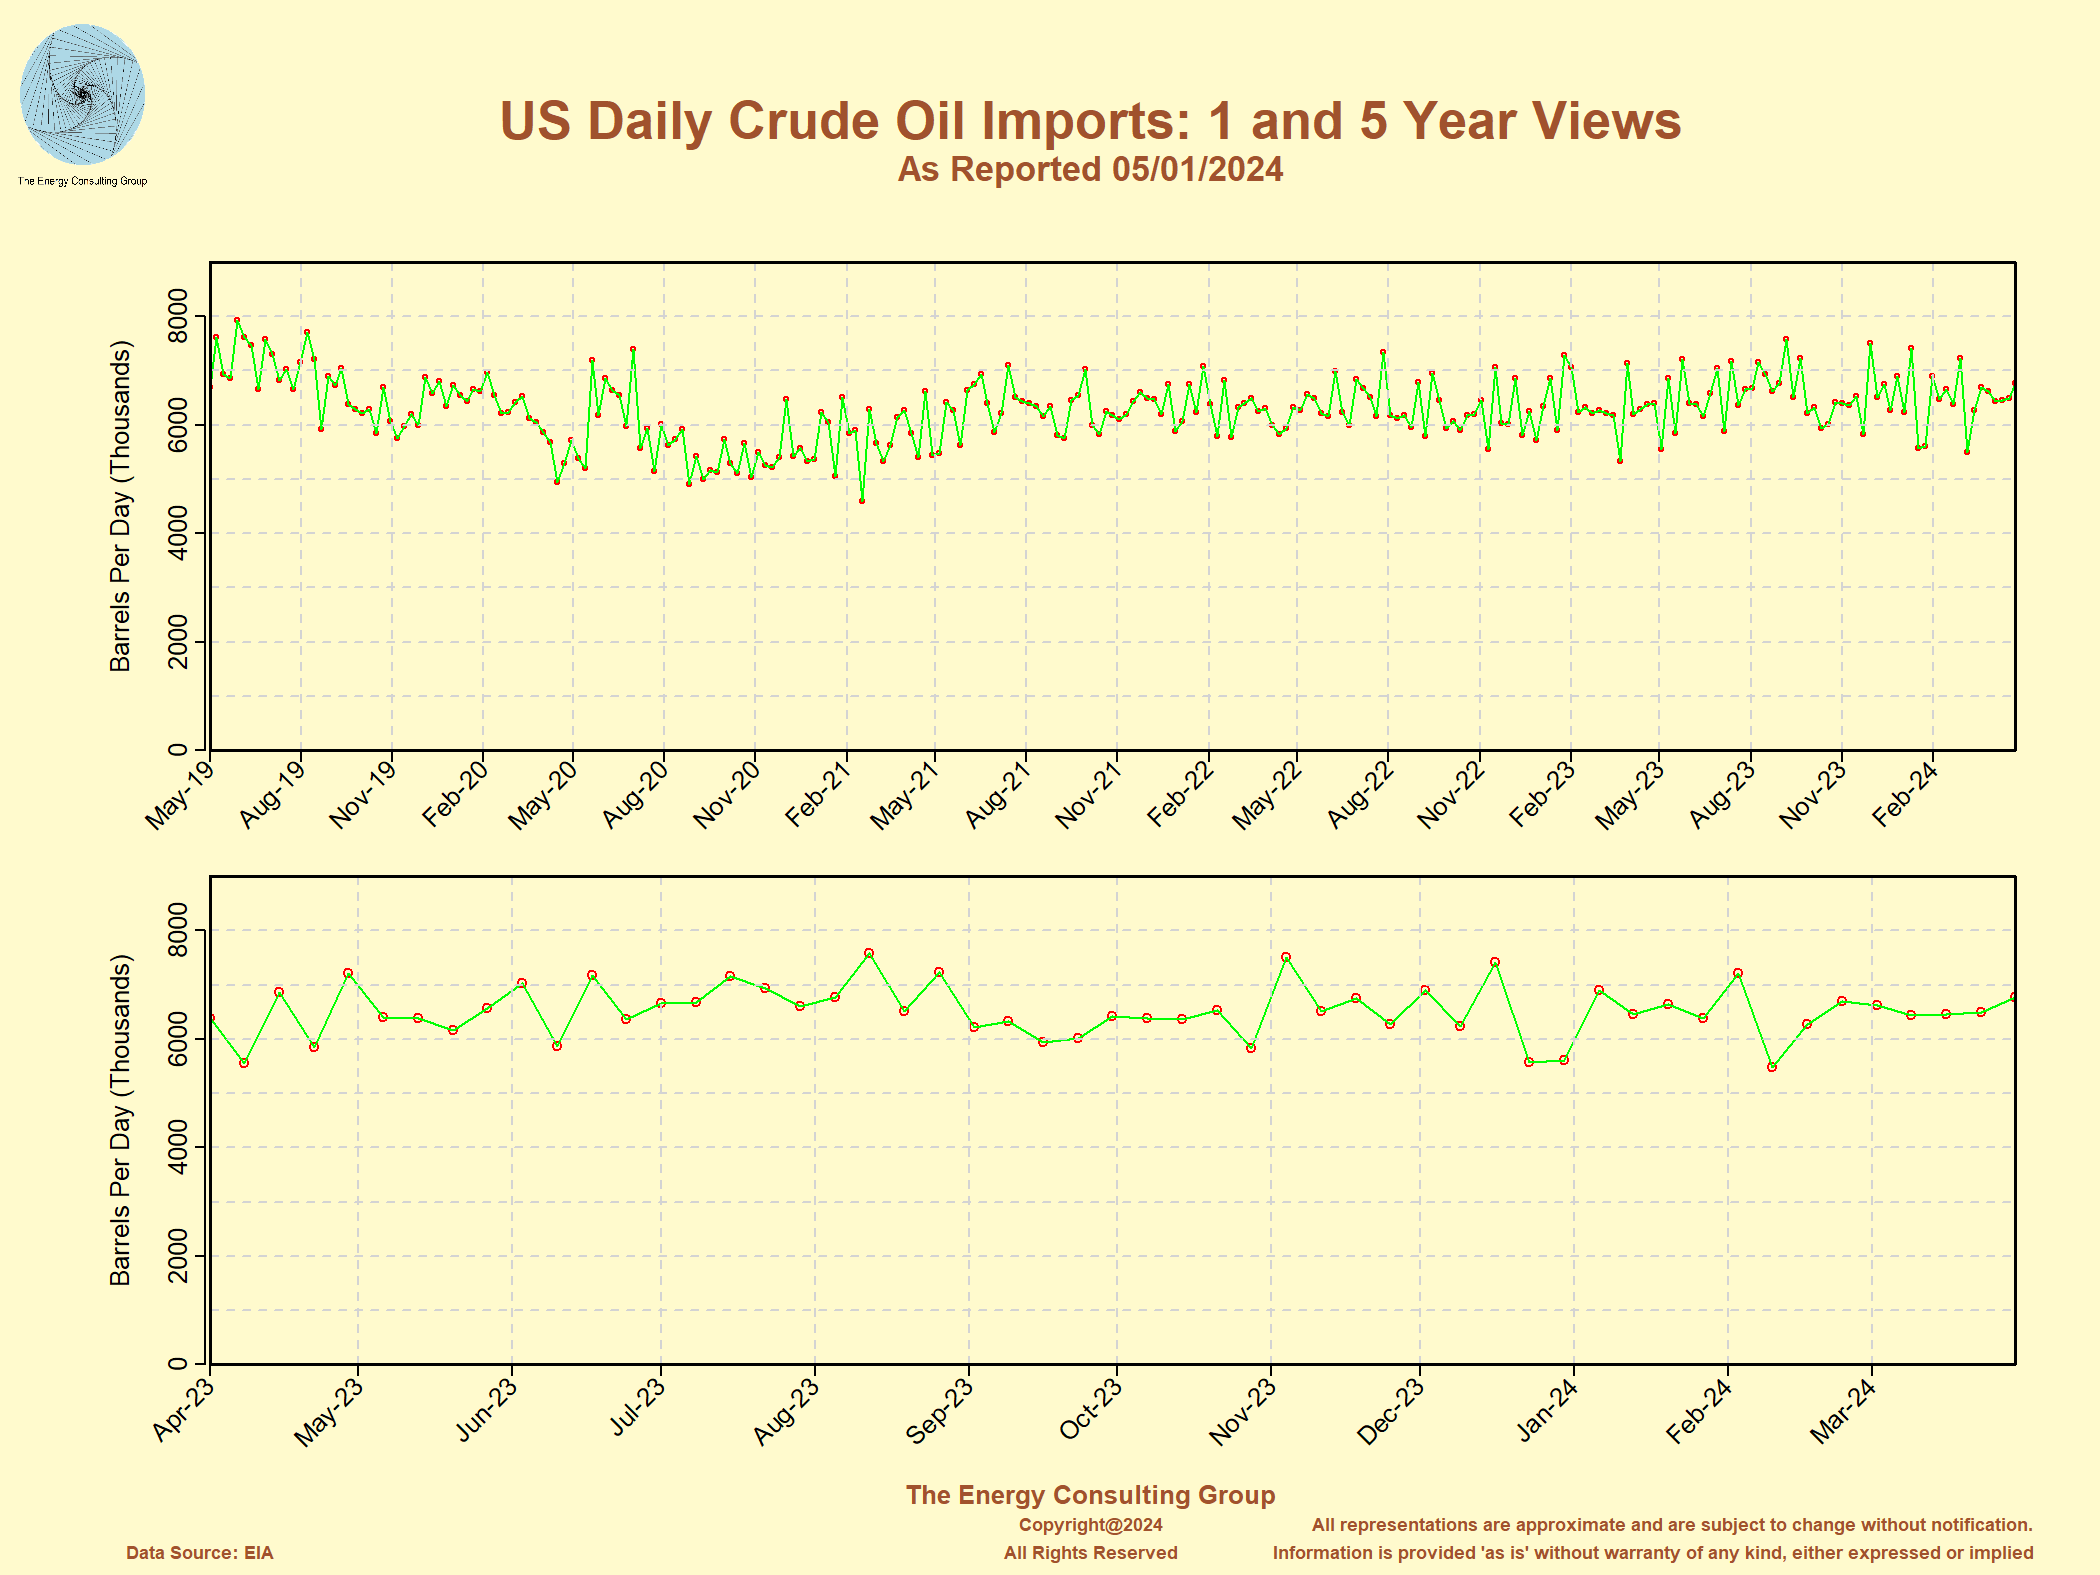 Click on the image for full size version |
US Crude Oil Trade Balance The crude oil trade balance is steadily improving as US oil exports continue to grow. 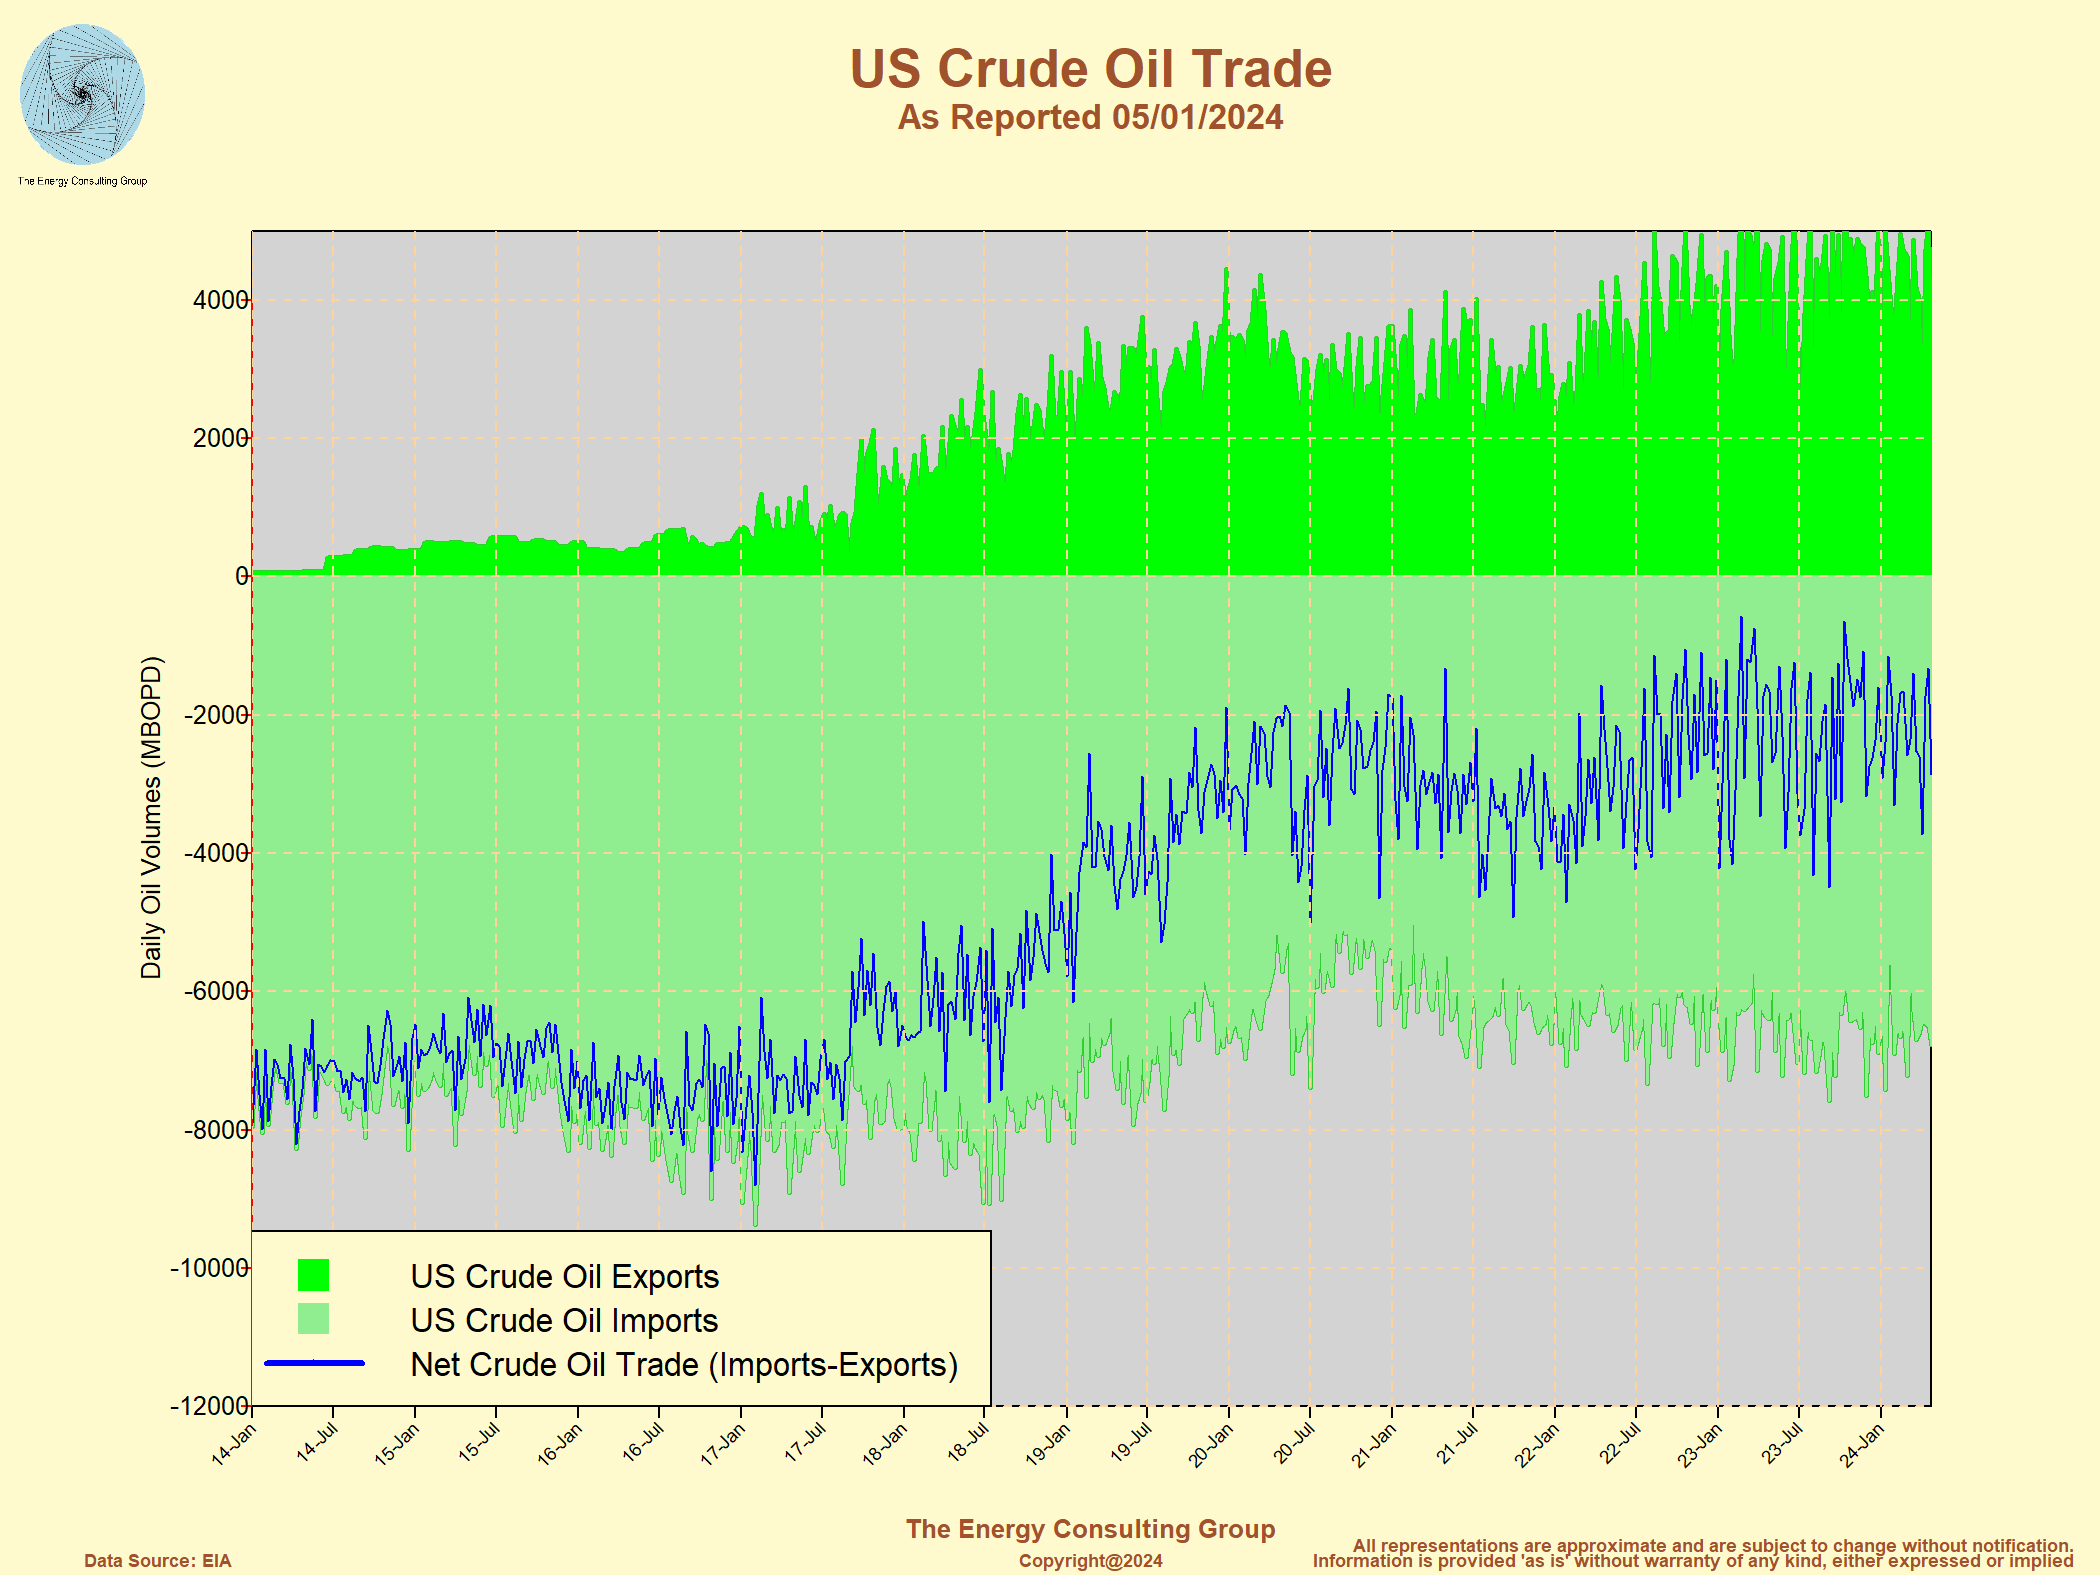 Click on the image for full size version |
Economics of North American Oil and Gas Development (including the shales)
North American Oil Supply Curve Click on the image for full size version Please contact us at insight@energy-cg.com for a version of the supply curve slide with prices, play names, and volumes. |
Oil Price Versus US Oil Rig Count 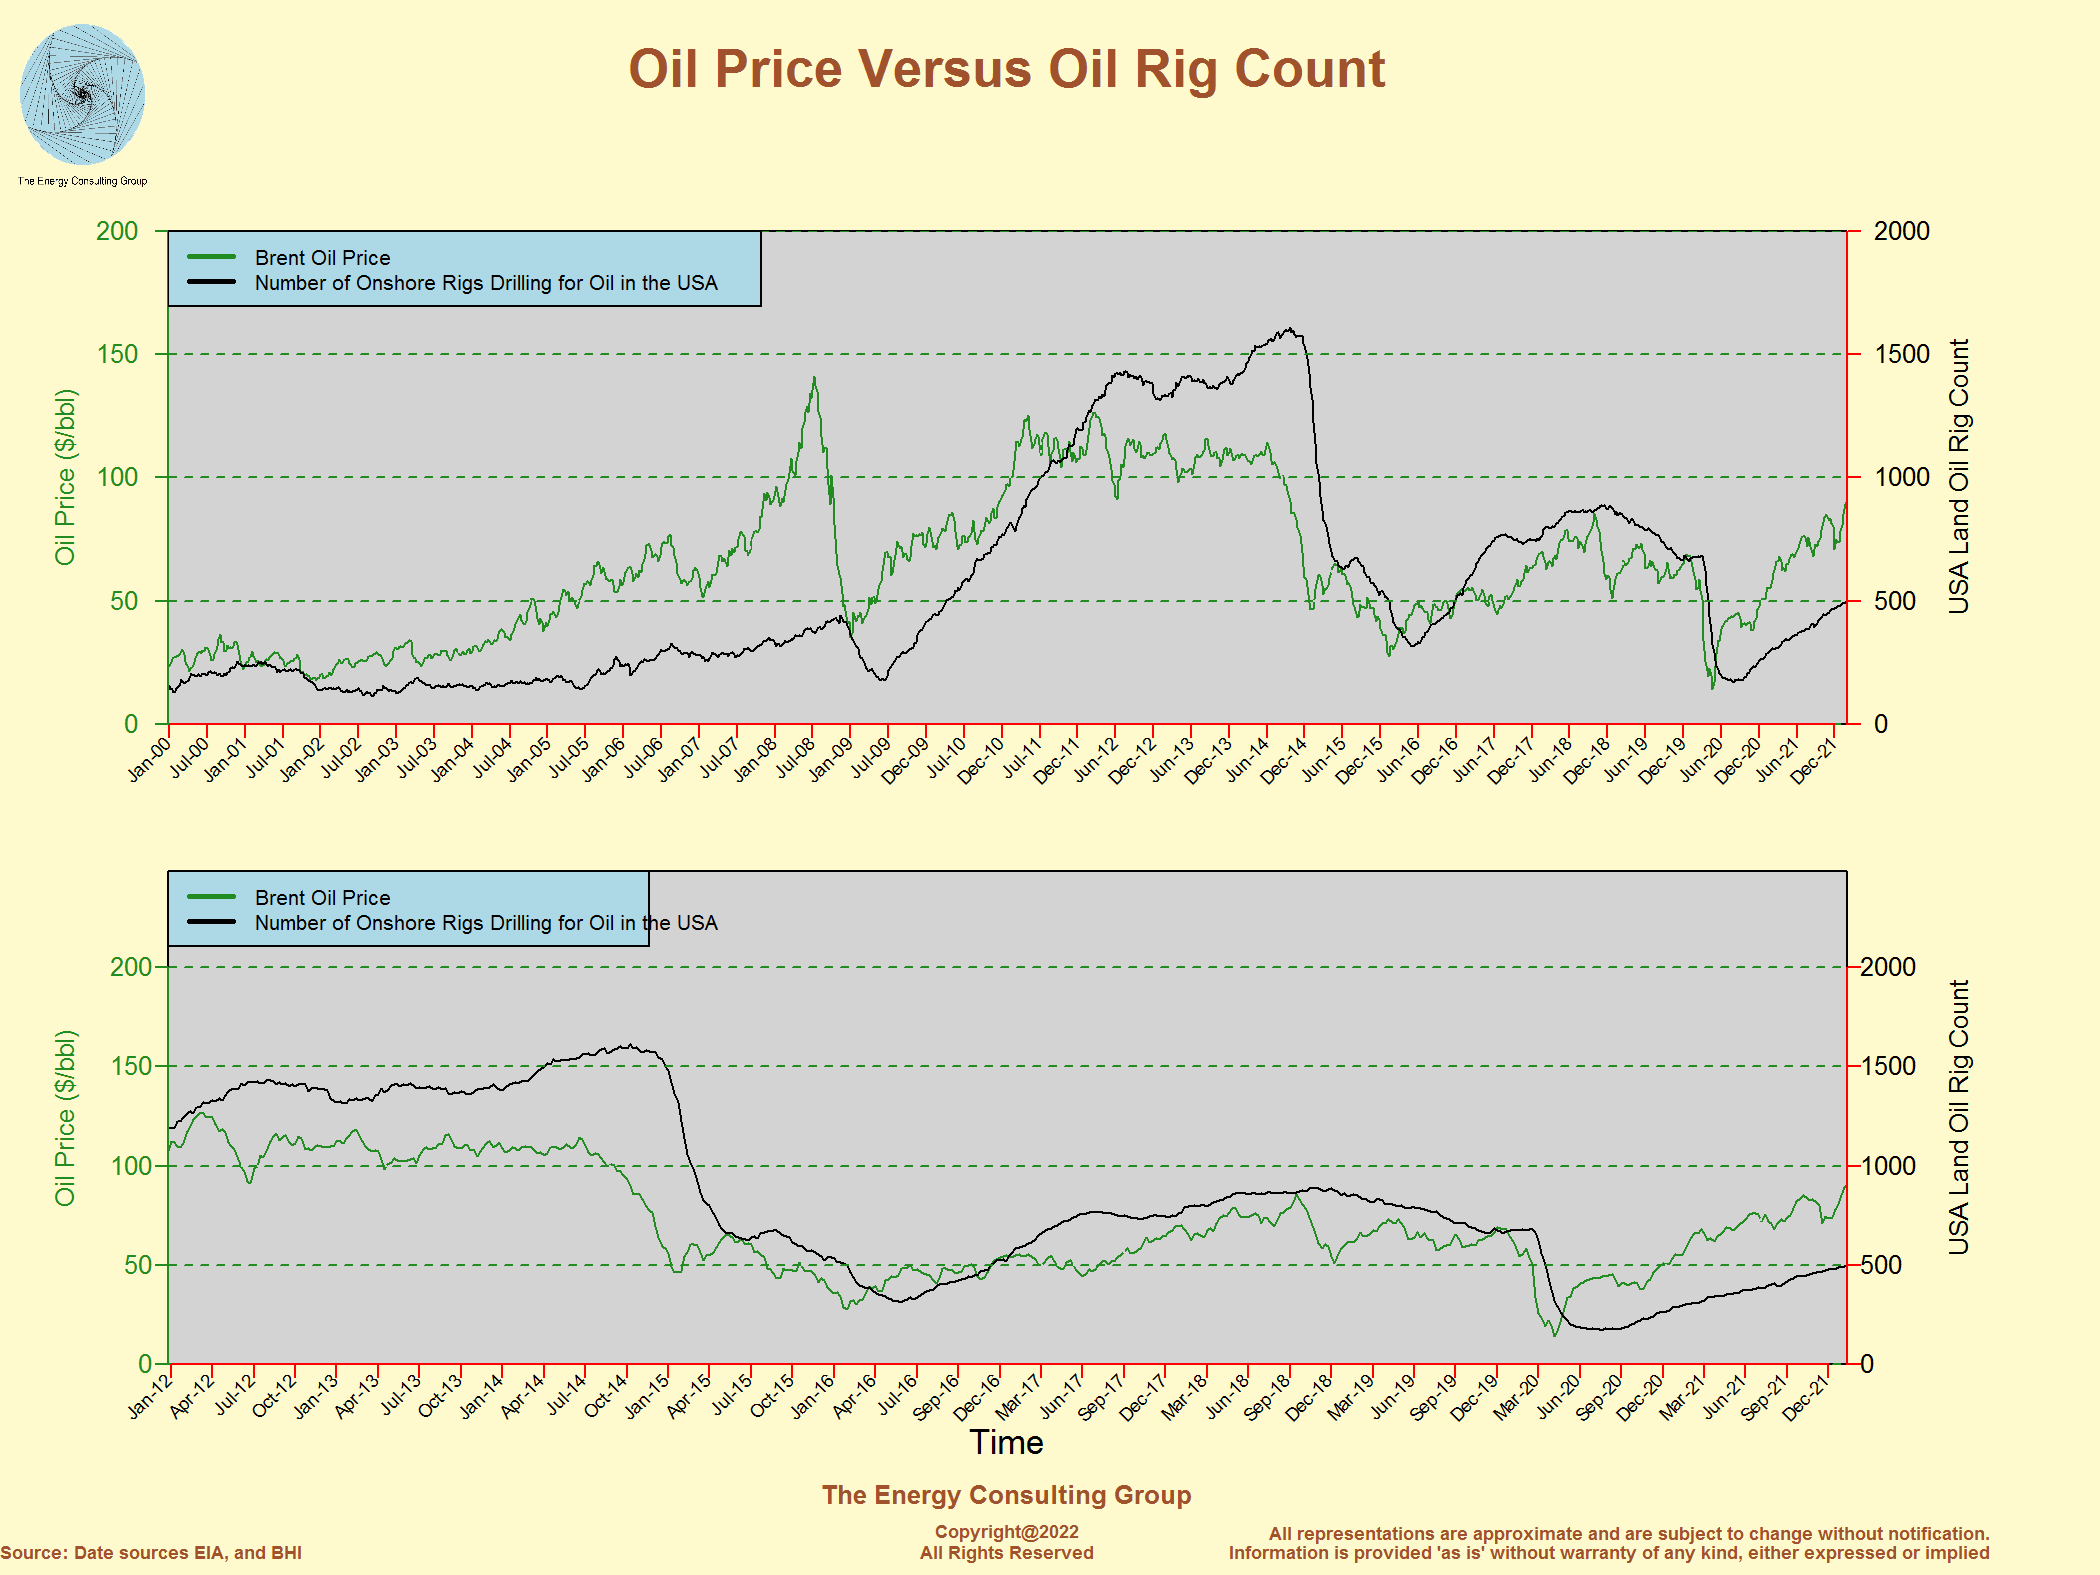 Click on the image for full size version |
US Oil and Gas Development Activity (including rig counts and number of working frac crews)
USA Onshore Drilling Activity Map (county level)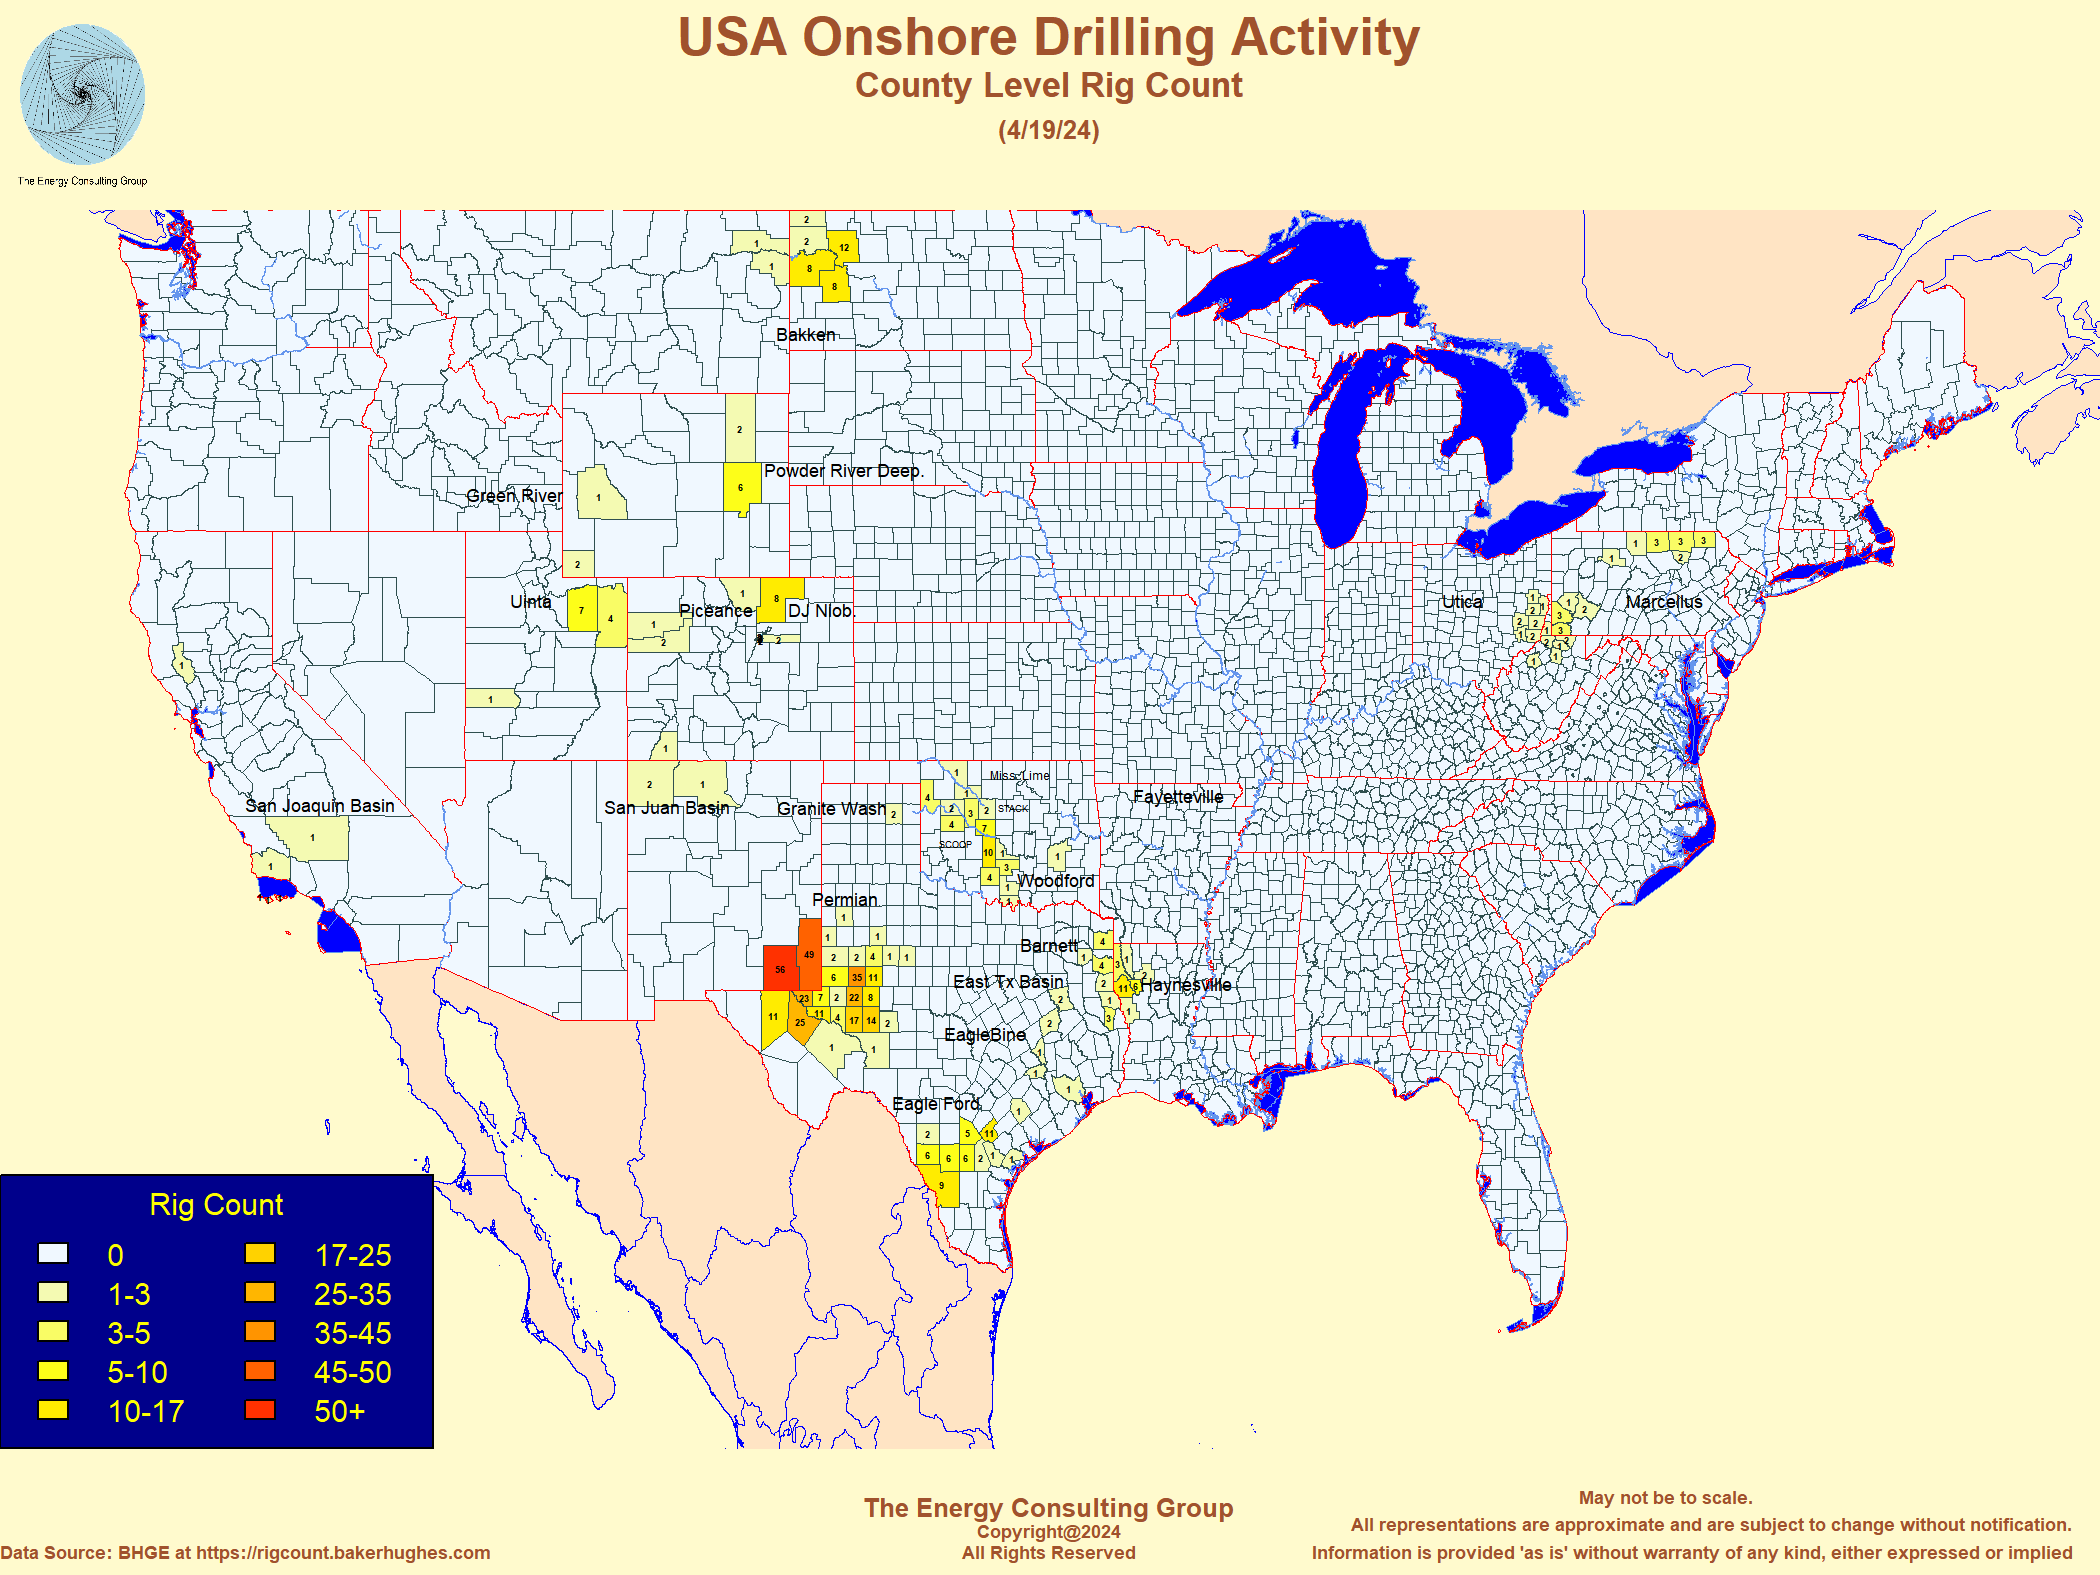 Click on the image for full size version |
International Oil Production *
* Oil production includes the production of crude oil (including lease
condensate), natural gas plant liquids, and other liquids.
Other
Liquids includes biodiesel, ethanol, liquids produced from coal, gas,
and oil shale, Orimulsion, blending components, and other hydrocarbons
USA Oil Production: crude, NGL and other (biofuels)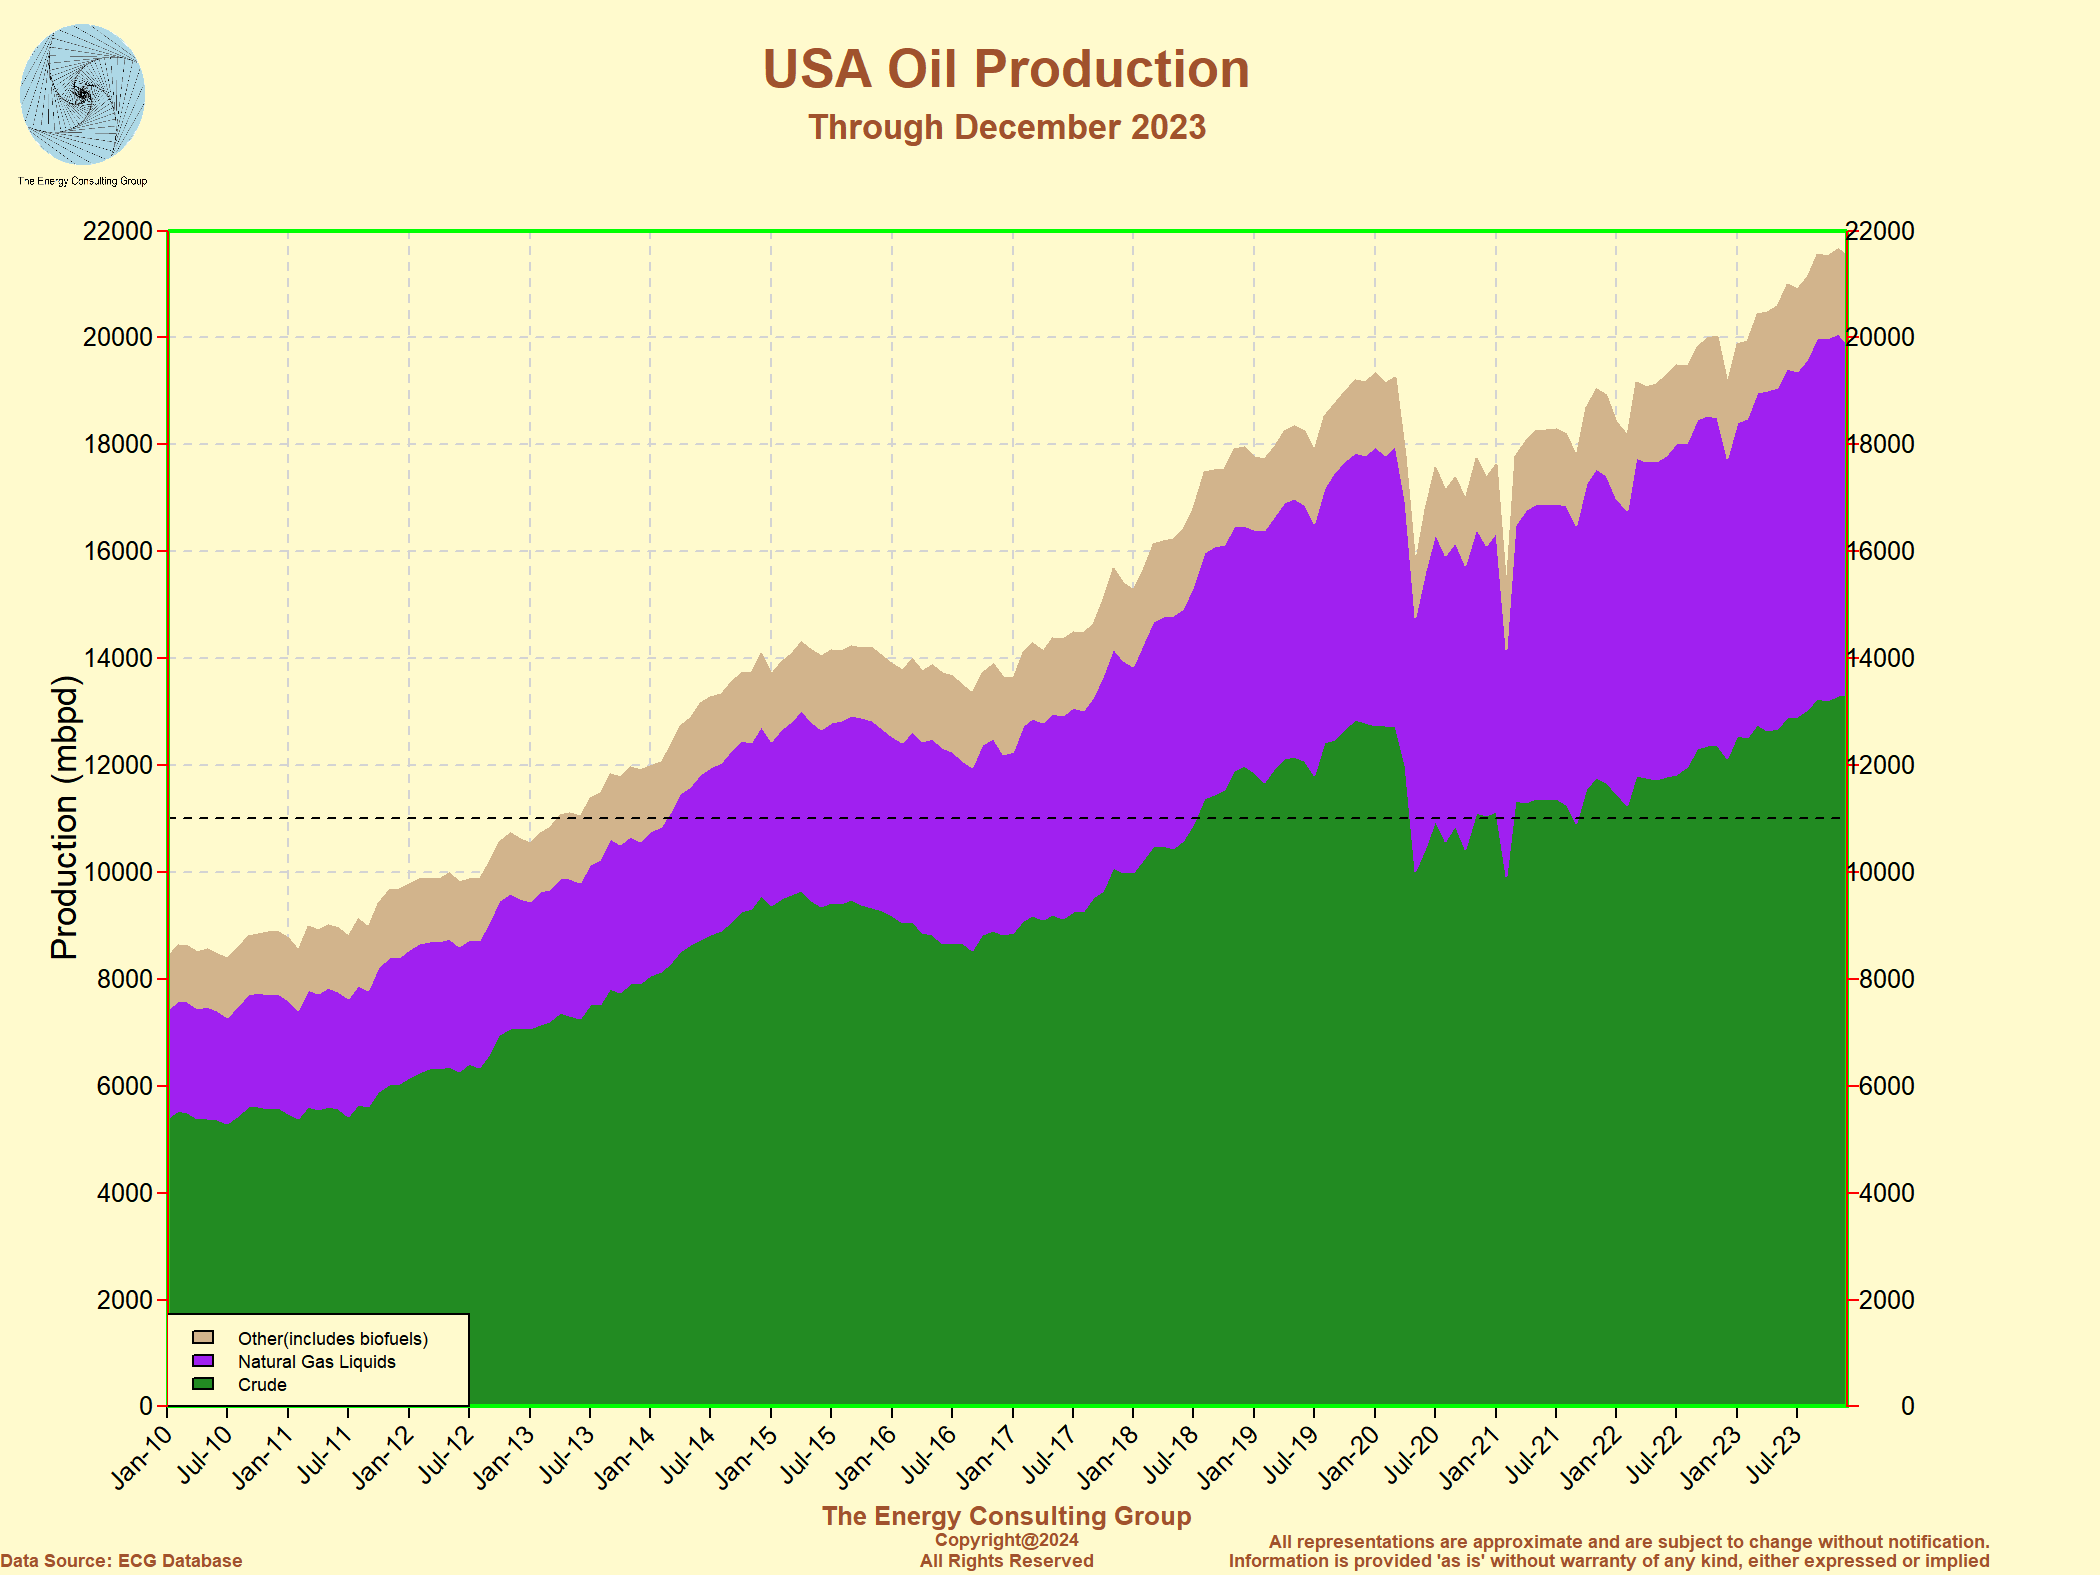 Click on the image for full size version |
Russia Oil Production: crude, NGL and other (biofuels)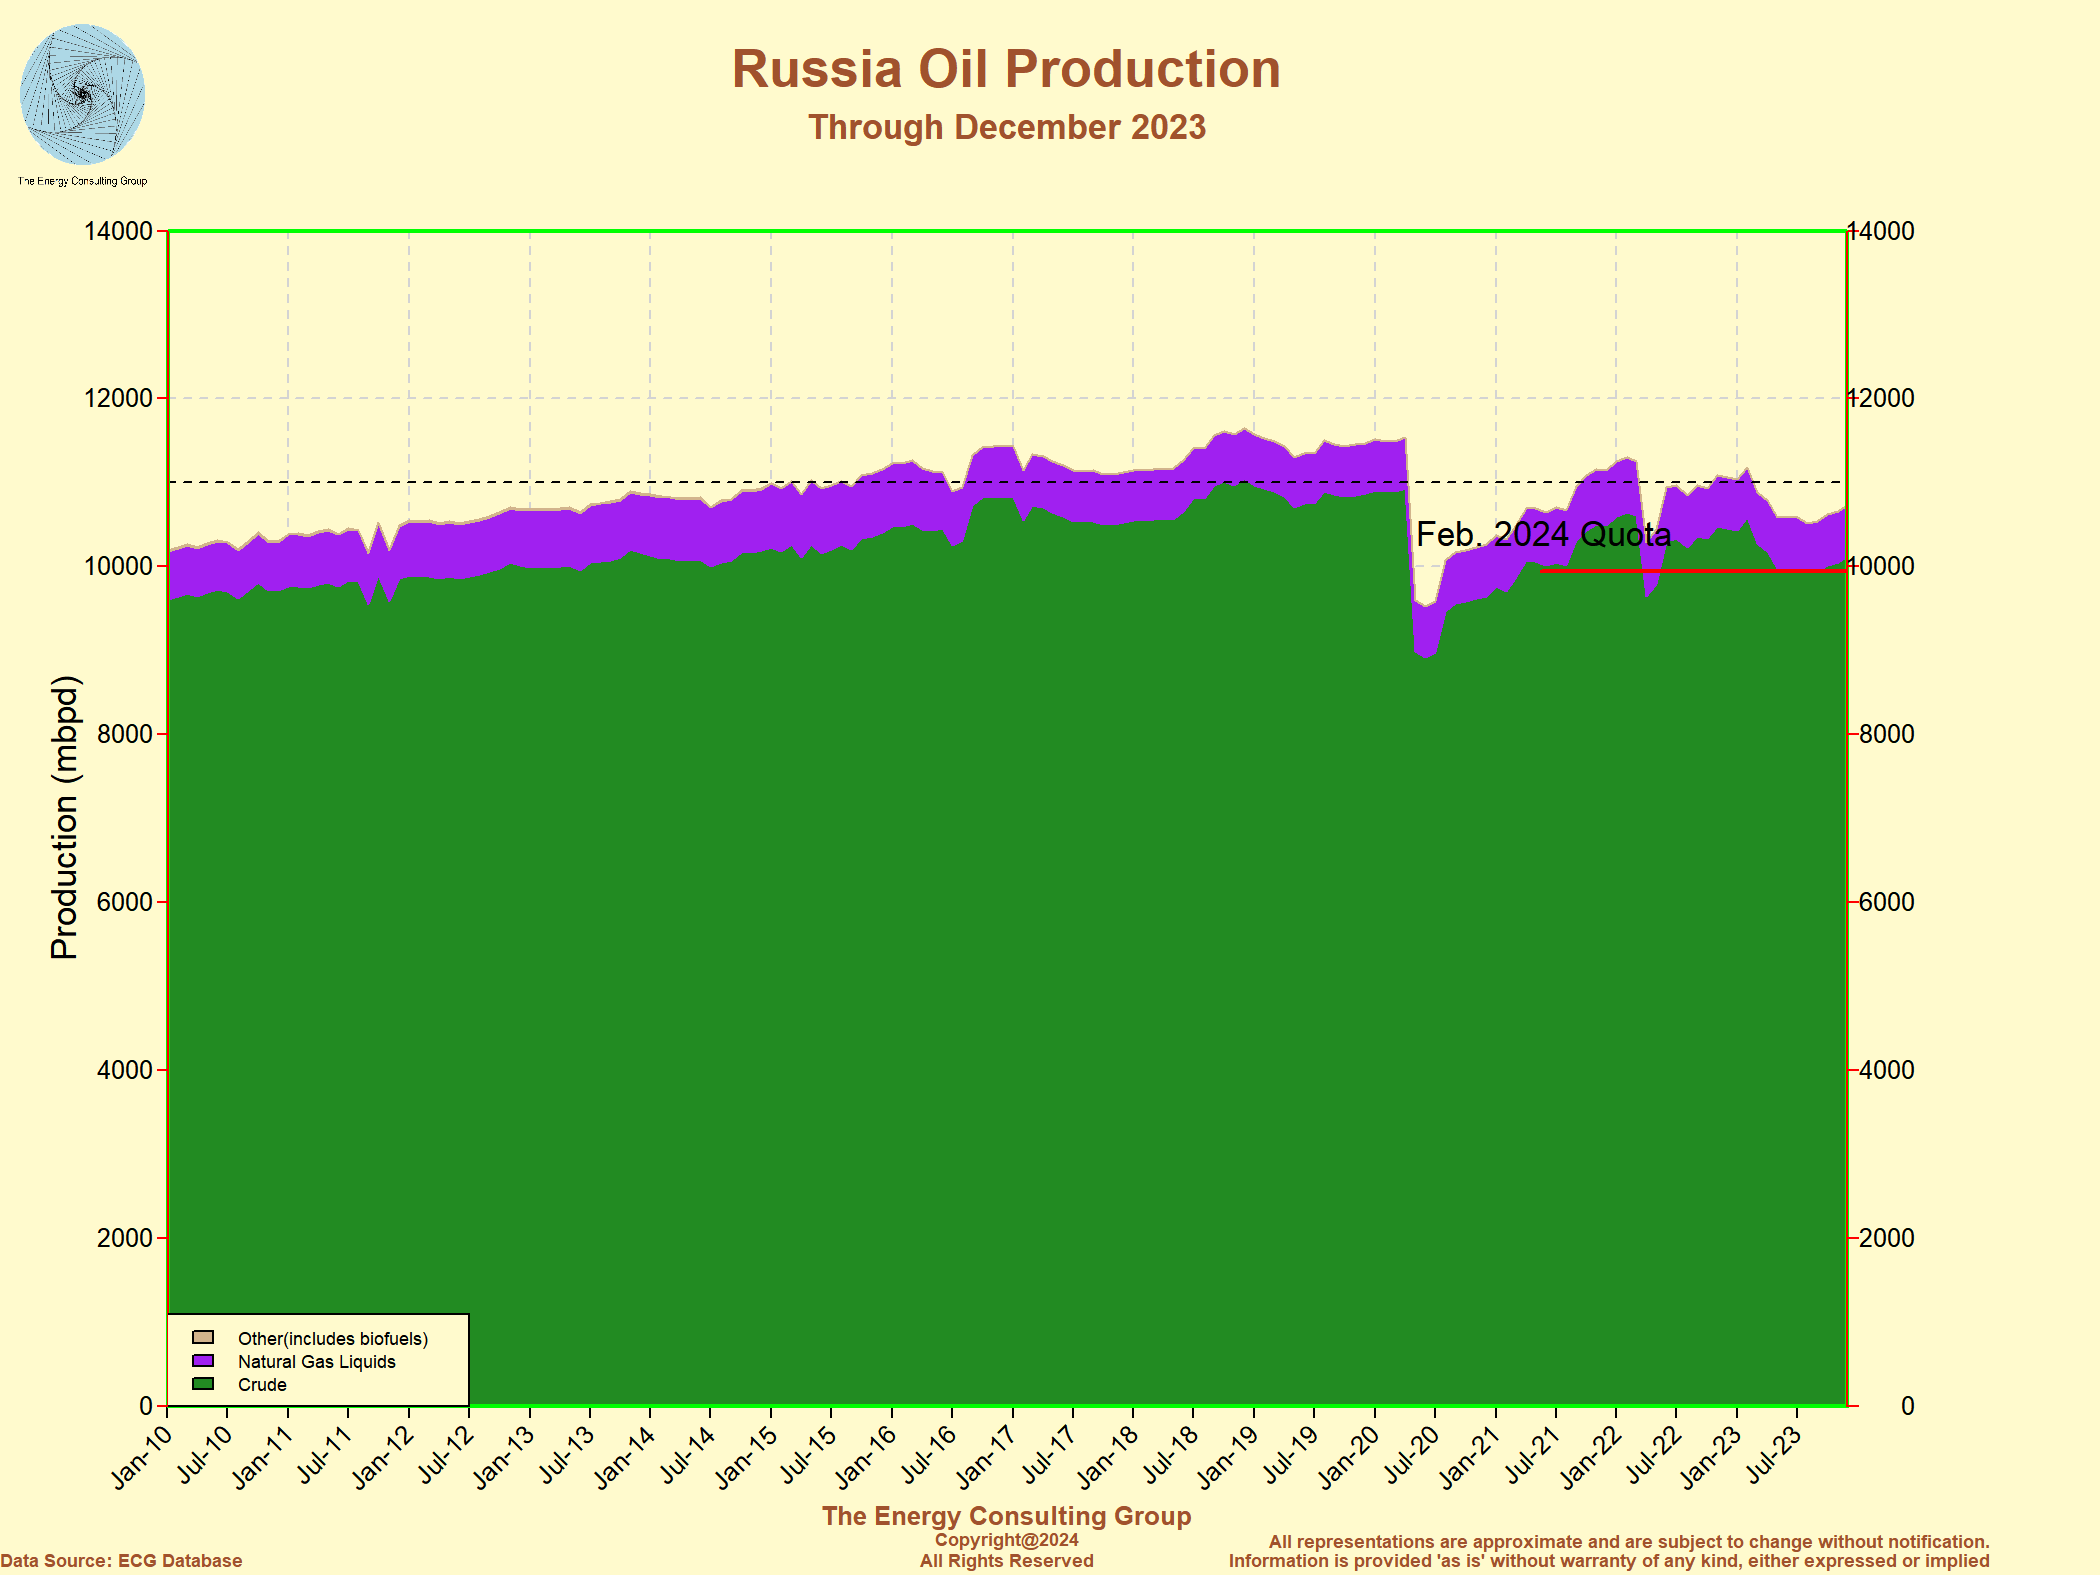 Click on the image for full size version |
OPEC Member Country Oil Production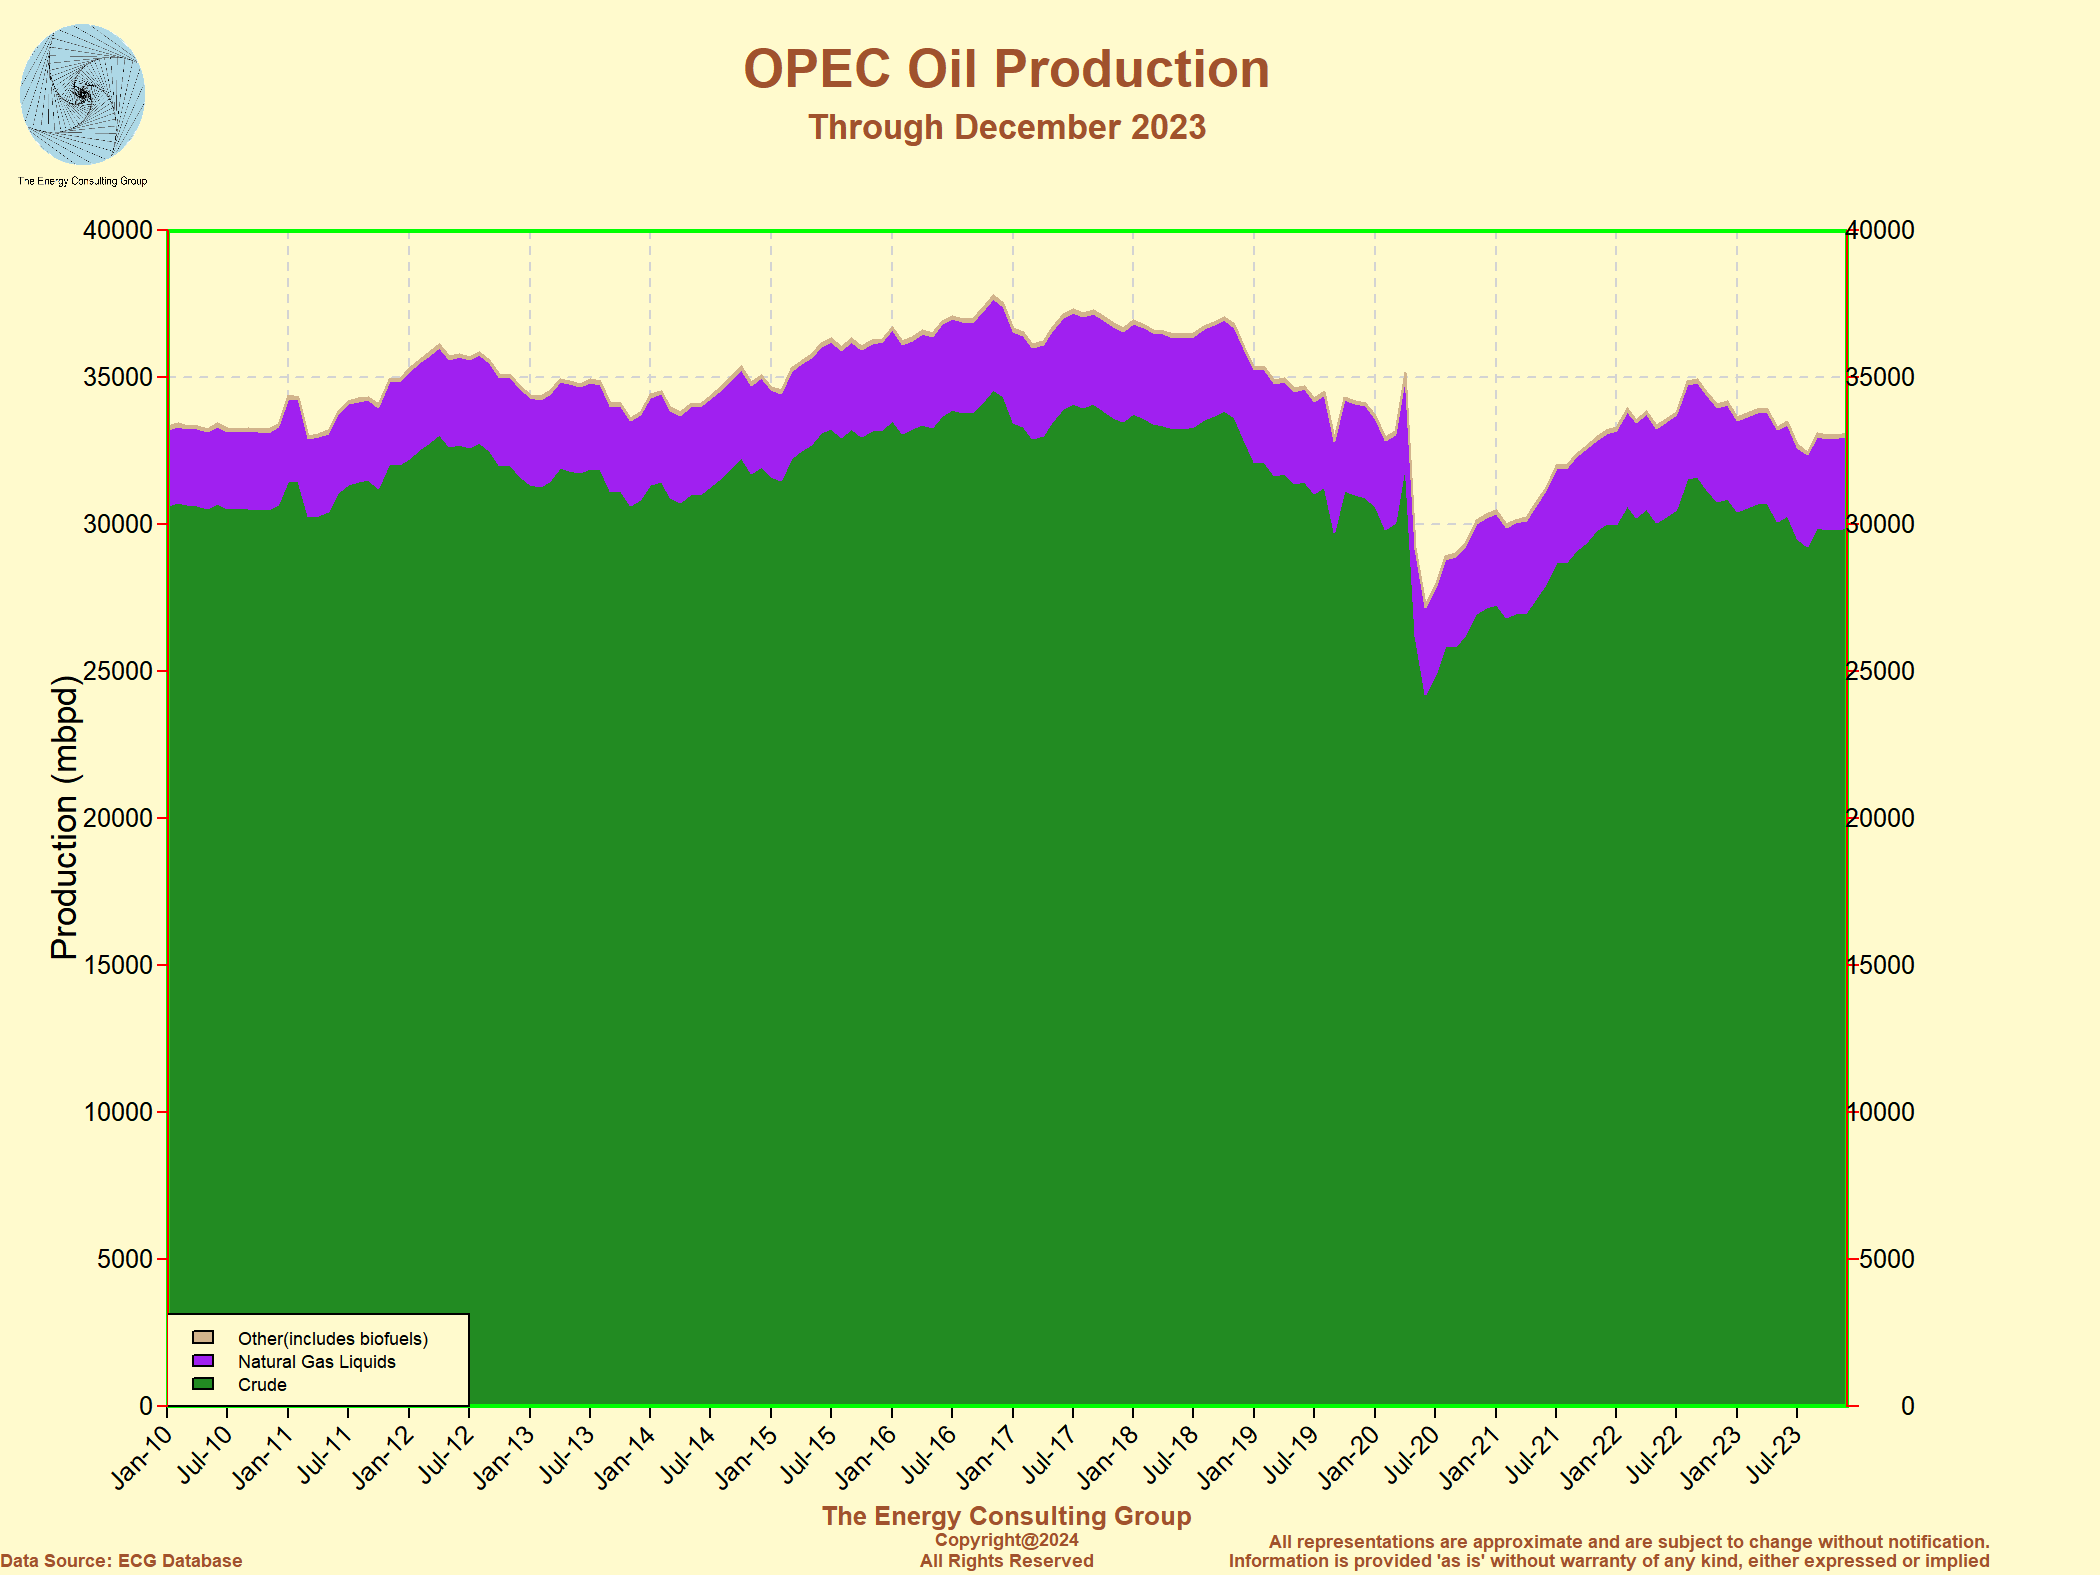 Click on the image for full size version |
OPEC Plus Oil Production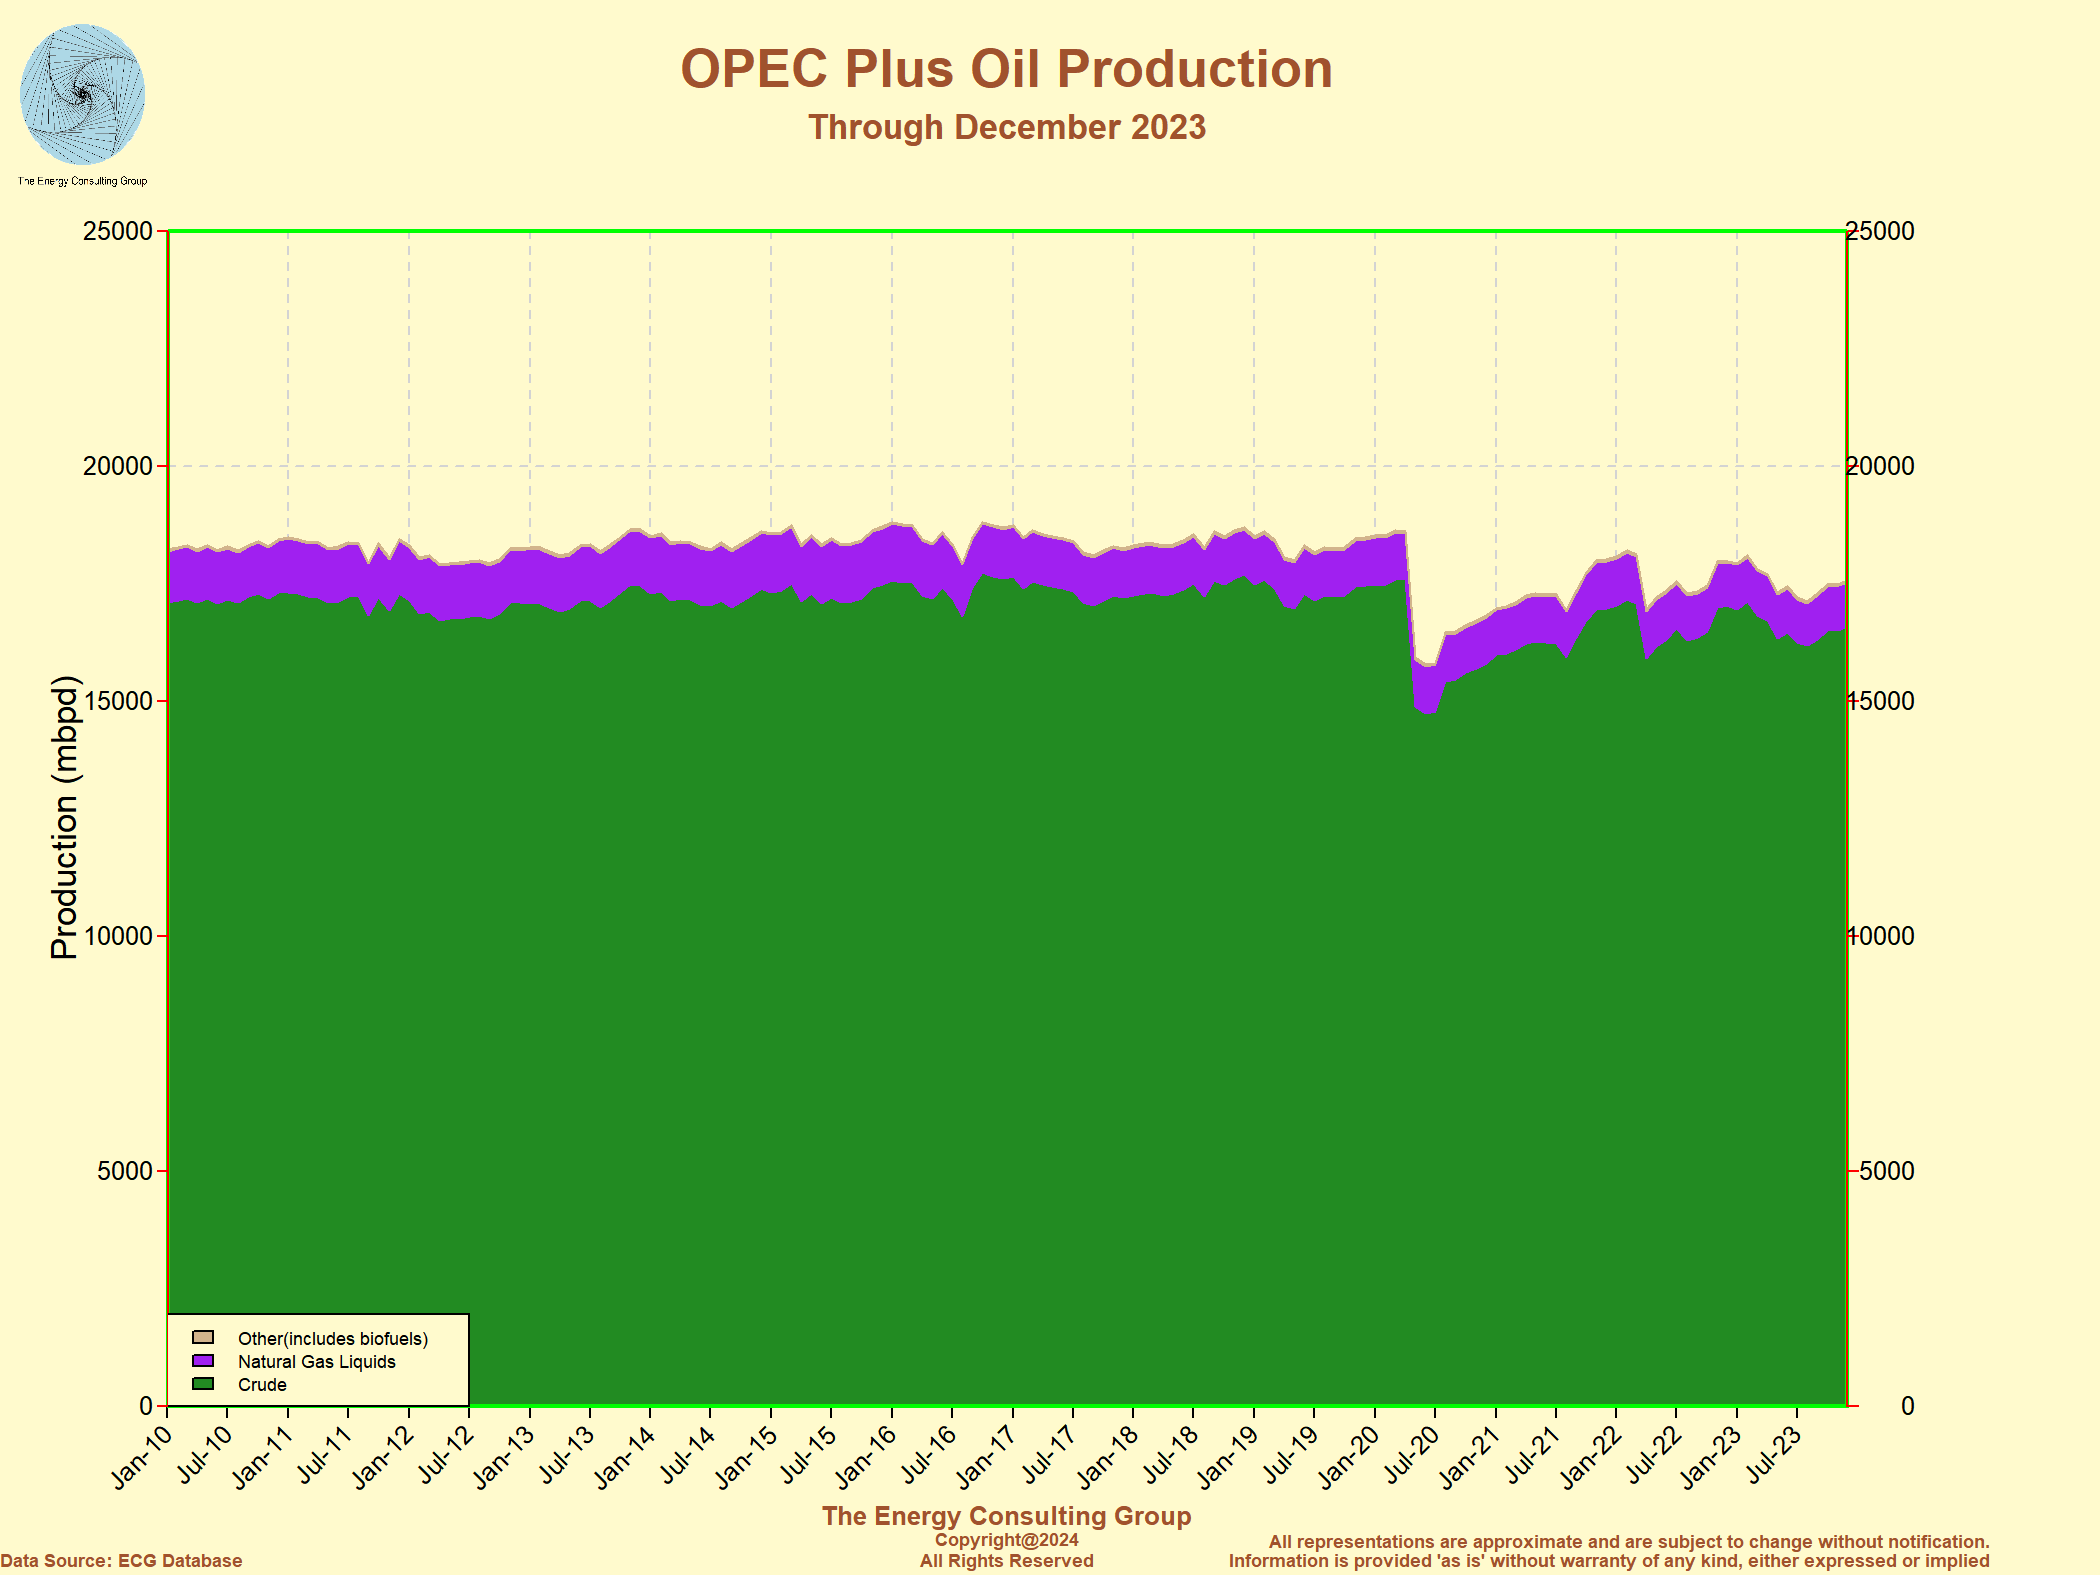 Click on the image for full size version |
Saudi Arabian Oil Production and Reserves Click on the image for full size version More information regarding production, field maps and locations, attacks on oil fields and infrastructure, infracstructure, Ghawar, shale gas, etc. is at this link |
Iranian Oil Production and Reserves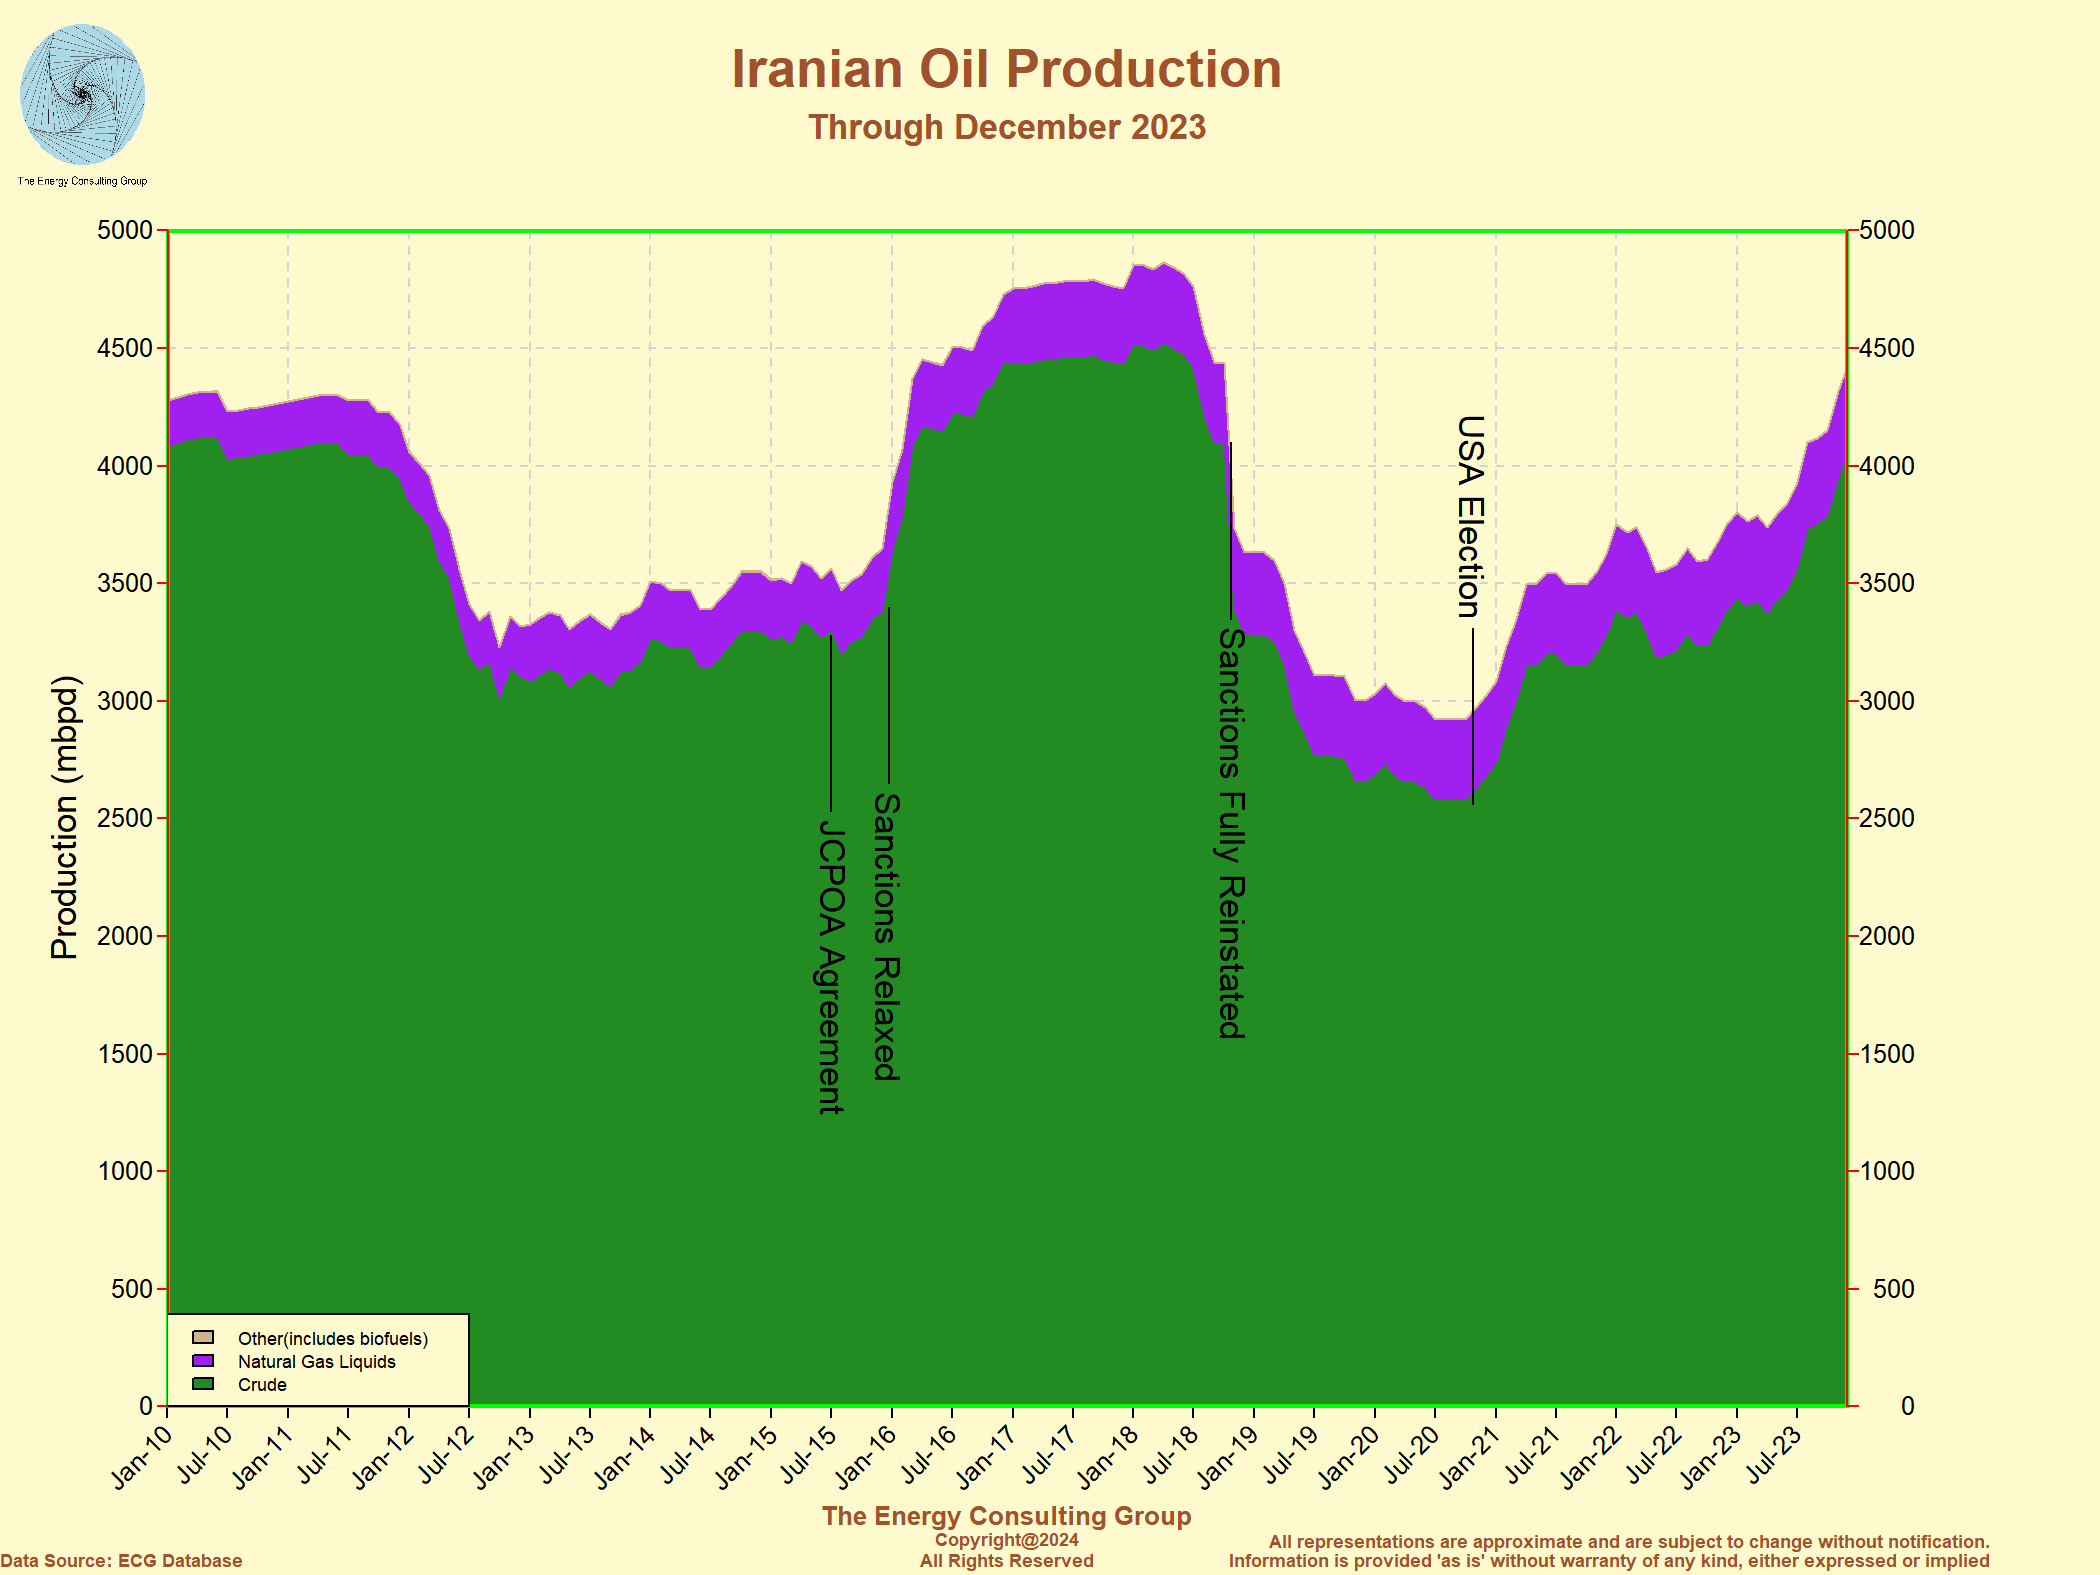 Click on the image for full size version More information regarding production, field maps and locations, oil infrastructure, sanctions, etc. is at this link. |
The Energy Consulting Group home page