The Energy Consulting Group
Business strategy for upstream oil and gas producers and service companies
Contact Bill at insight@energy-cg.com to find out how we can help you.
While oil and gas companies can and often do share generalized economic valuations with the public regarding economic returns associated with oil and gas investments, including the shales, the methodology and criteria usually varies from company to company, play to play, making an apples-to-apples comparison difficult. As demonstrated using the following graphs and maps, our approach normalizes the economics to one standard, which allows for useful comparisons and sensitivities across time, and between companies, technologies, and plays.
Note: we have intentionally removed axis, legend
information and notations from the slides. If you need that information,
please contact us at:
insight@energy-cg.com.
1) We call our base economic valuation tool EVAL, which is short for Economic Valuation Assessment Lens (EVAL). We use it for project economics and A&D valuations, and we view it as an easier-to-use, tuned for shales alternative to ARIES. Among other features, it incorporates three product streams: oil, natural gas, and NGL's. This capability allows us to develop, track and aggregate oil, natural gas and NGL revenue streams, as well as the associated CAPEX and OPEX for each product. The tool is also designed to allow assessments of both subsurface risk (e.g. geologic/reservoir), and surface risk (e.g. geopolitical, fiscal, etc.) to be incorporated into the analysis. (Note: the examples presented below are all unrisked.) The tool also gives us the ability to quickly assess economics at differing scales. For example, we can evaluate rates of return for individual wells, and in the case of that well being part of a larger program, we can easily scale up the assessment to the programmatic level to assess campaigns stretching across years, involving hundreds of wells and incorporating large associated facility build.
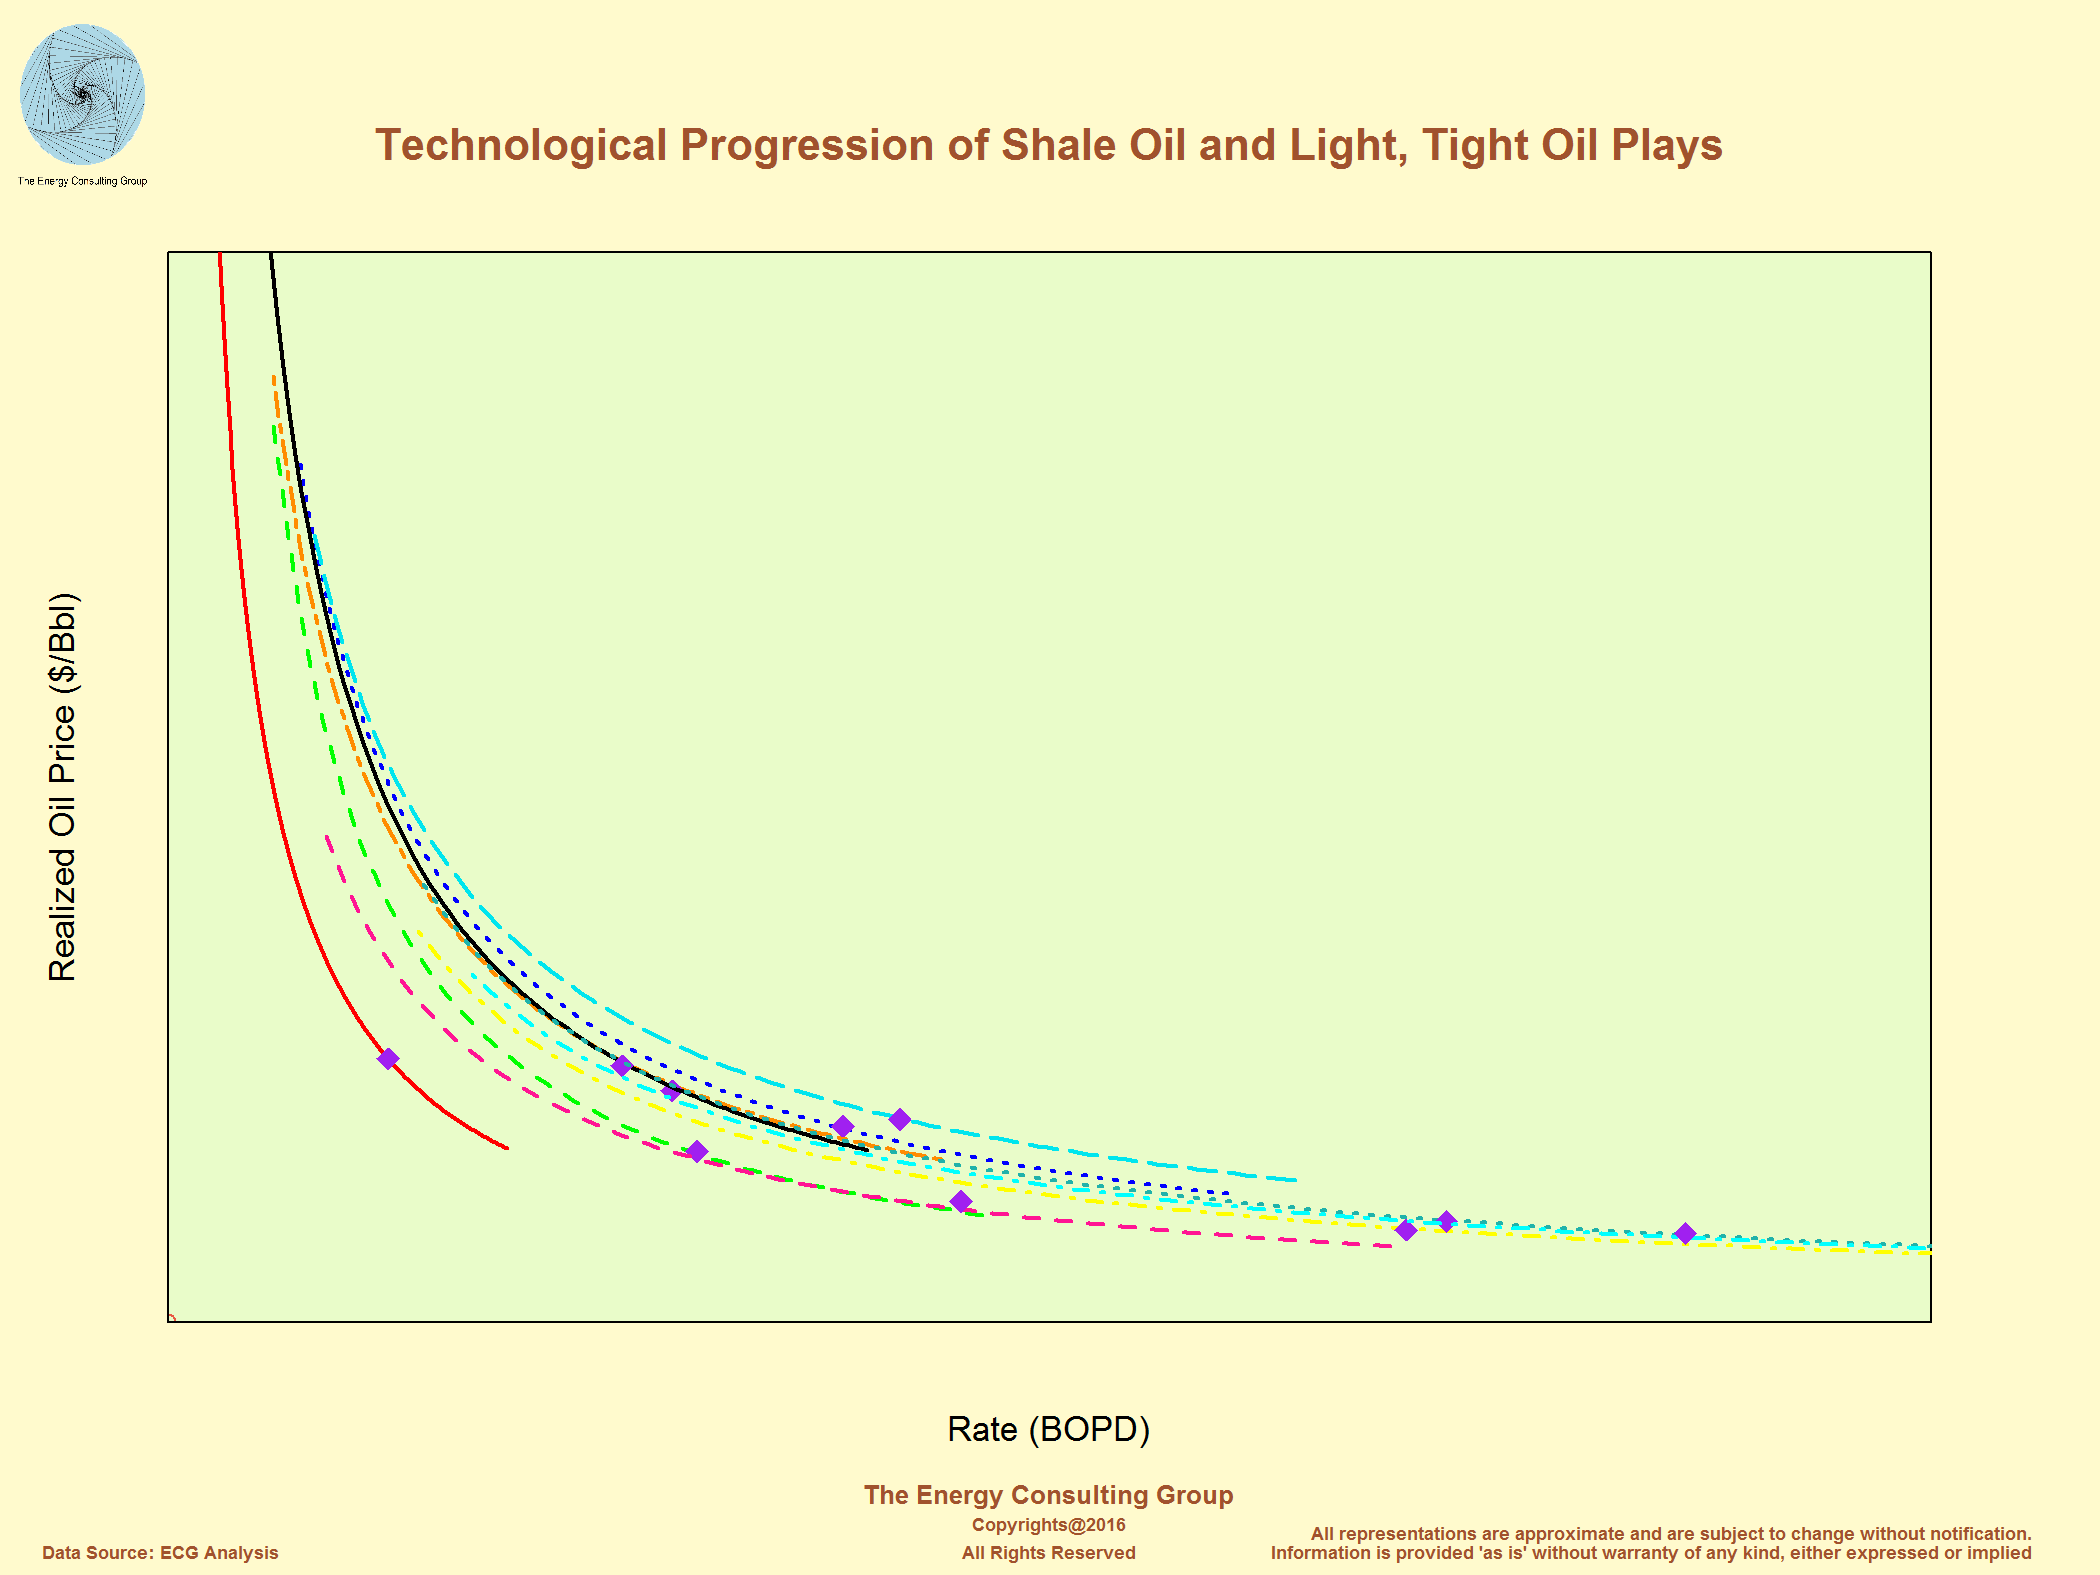
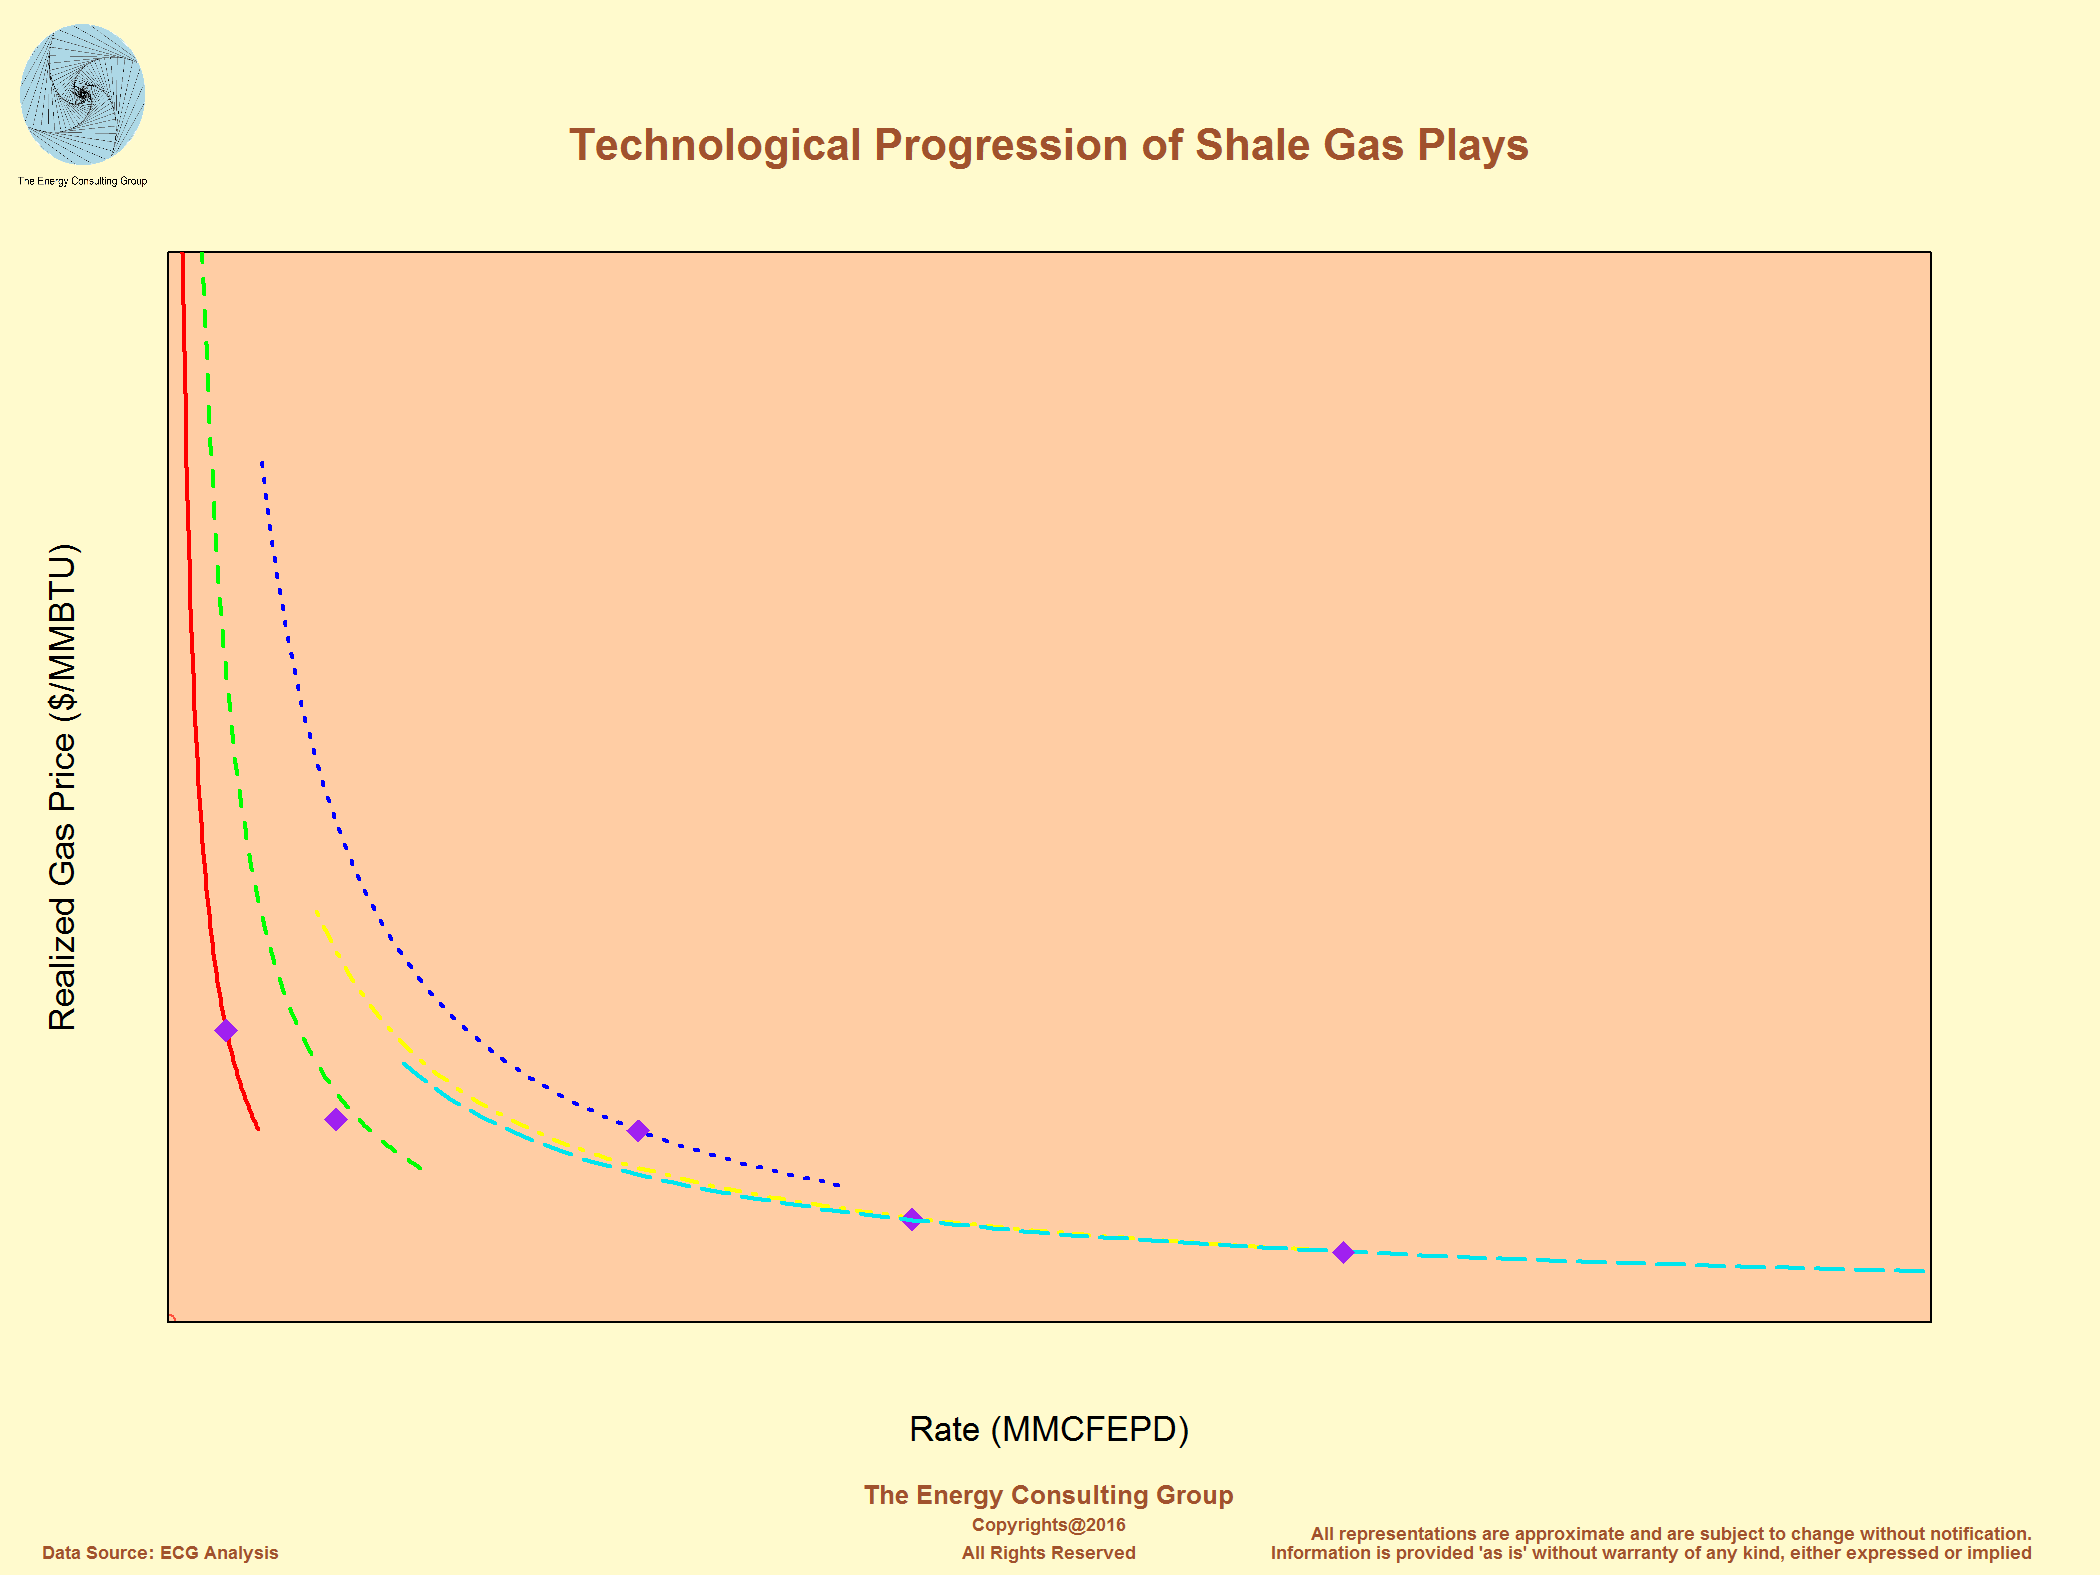
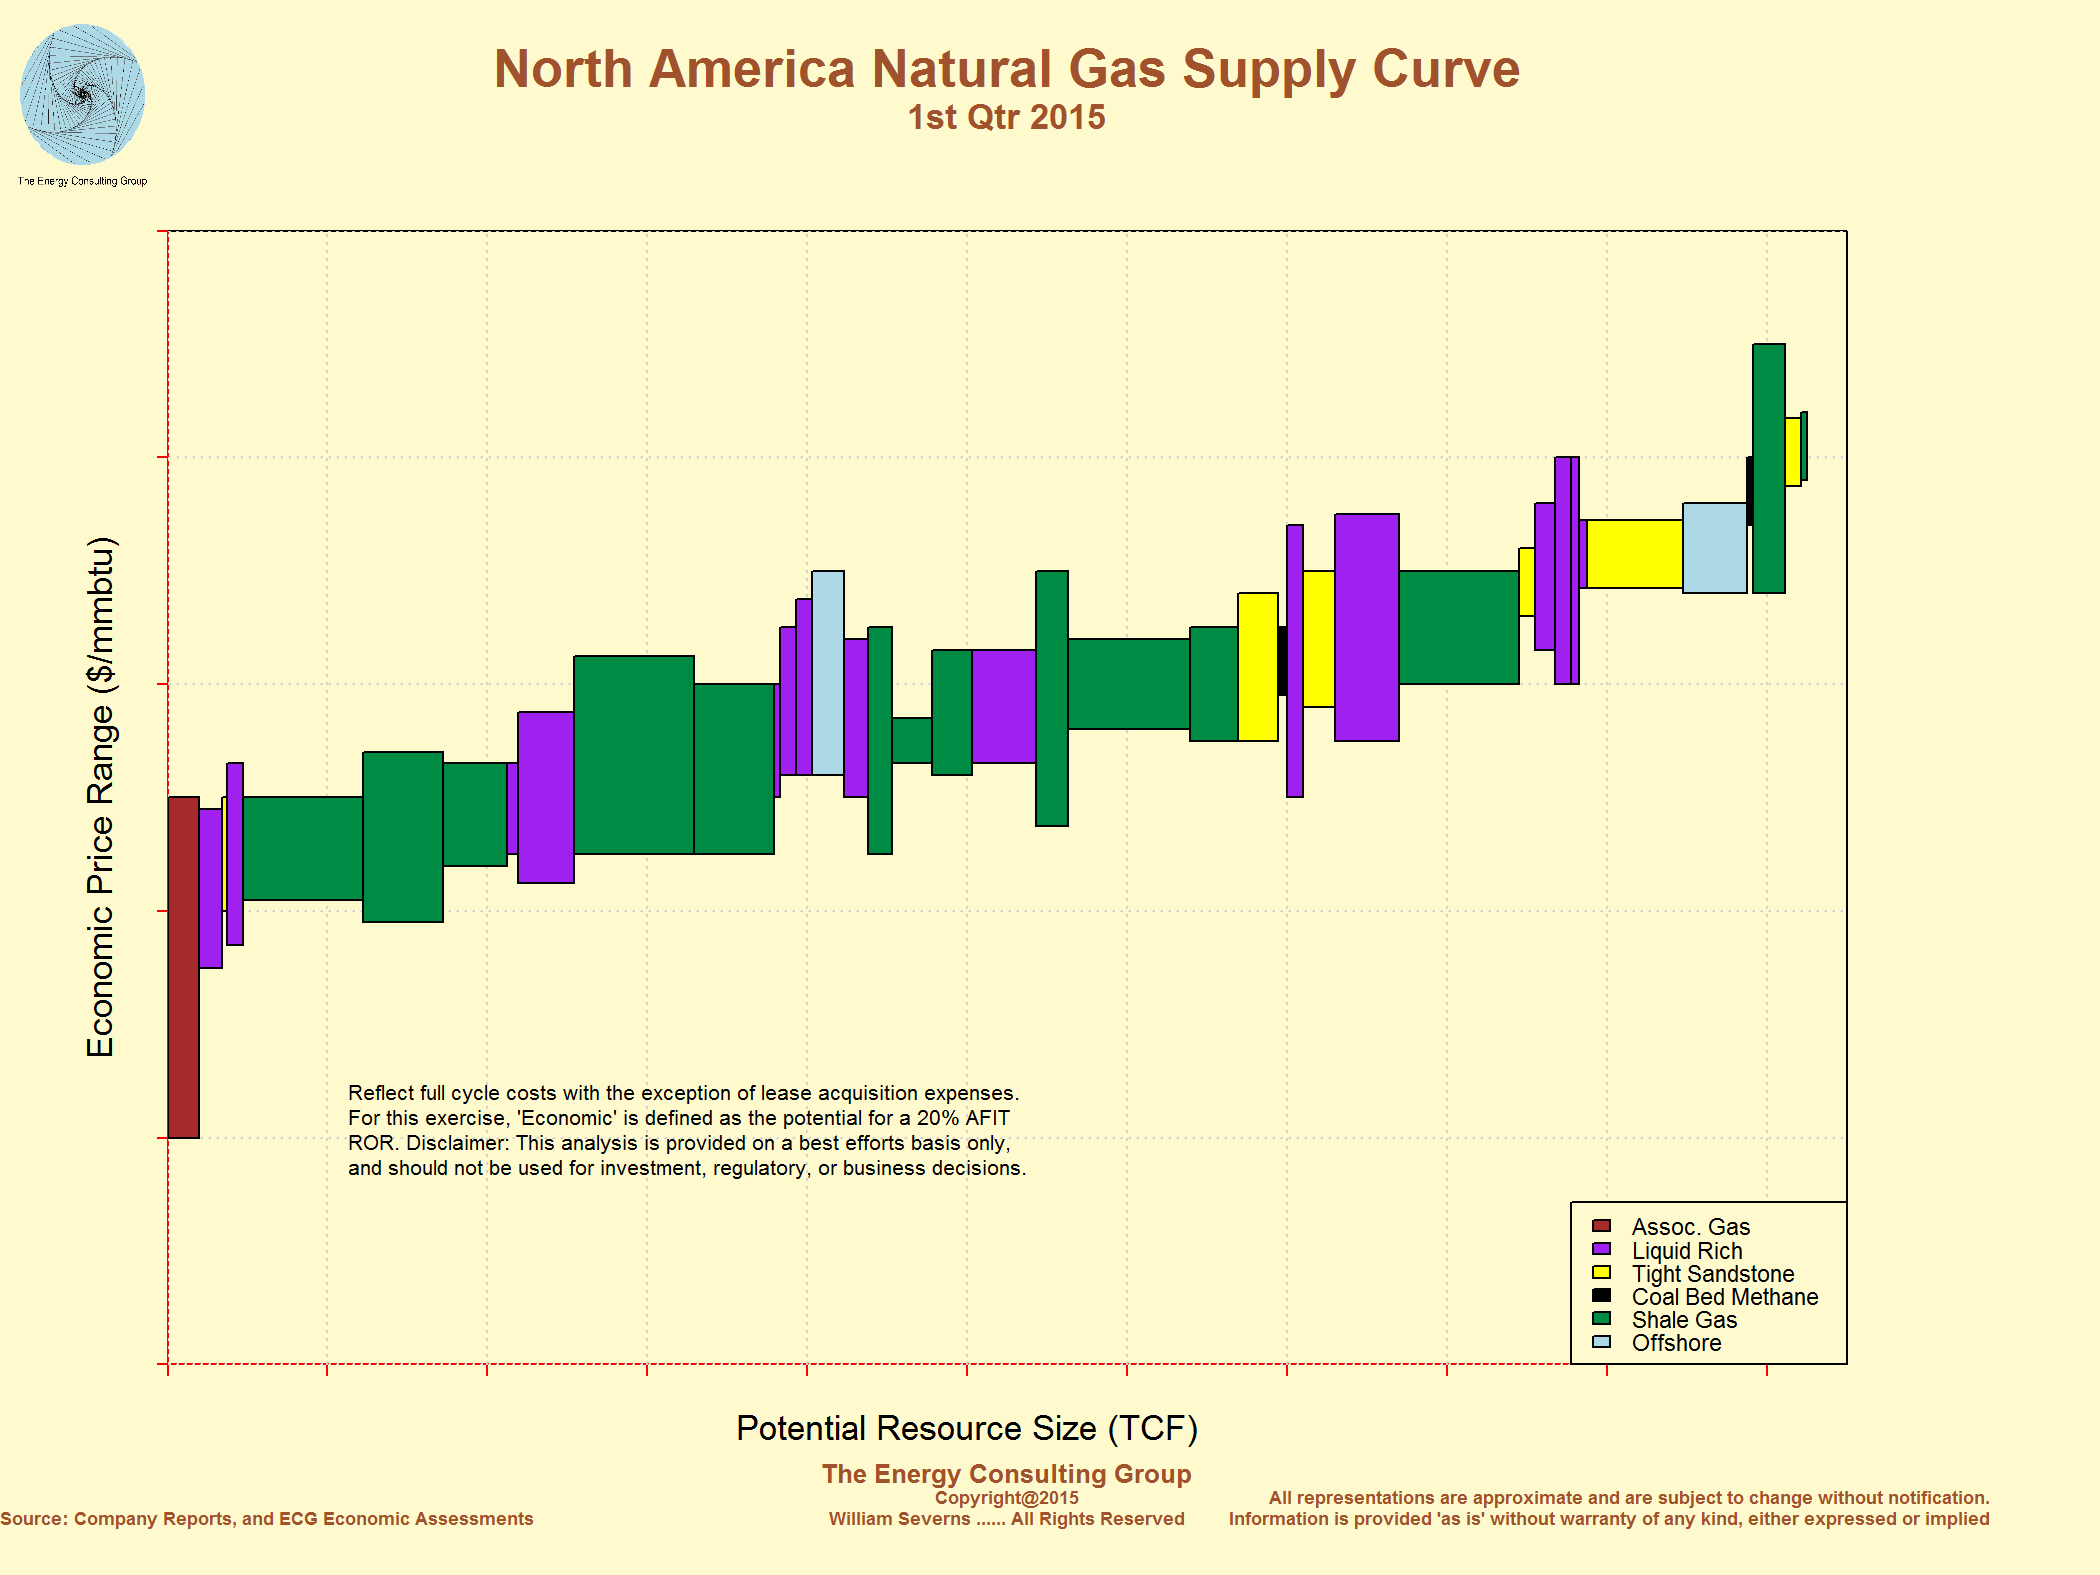
First, the price at the average performance point (purple diamond) at which each iteration of the technology achieves economic breakeven is moving steadily lower as average well performance improves. Please note that the time frame ranges in years and that the vintage of the sensitivities becomes younger as one moves along the chart from left to right.
Second, the lower performance tail (20% to 80% of the average) is economic at much lower prices as the technology improves. This means the percentage of the resource base that can reasonably expect to be developed is growing, implying the amount of oil and gas that can be developed at a reasonable price point has increased greatly.
Click on the image for higher resolution version of the image.
Click on the image for higher resolution version of the image.
Click on the image for higher resolution version of the image.
Click on the image for higher resolution version of the image.
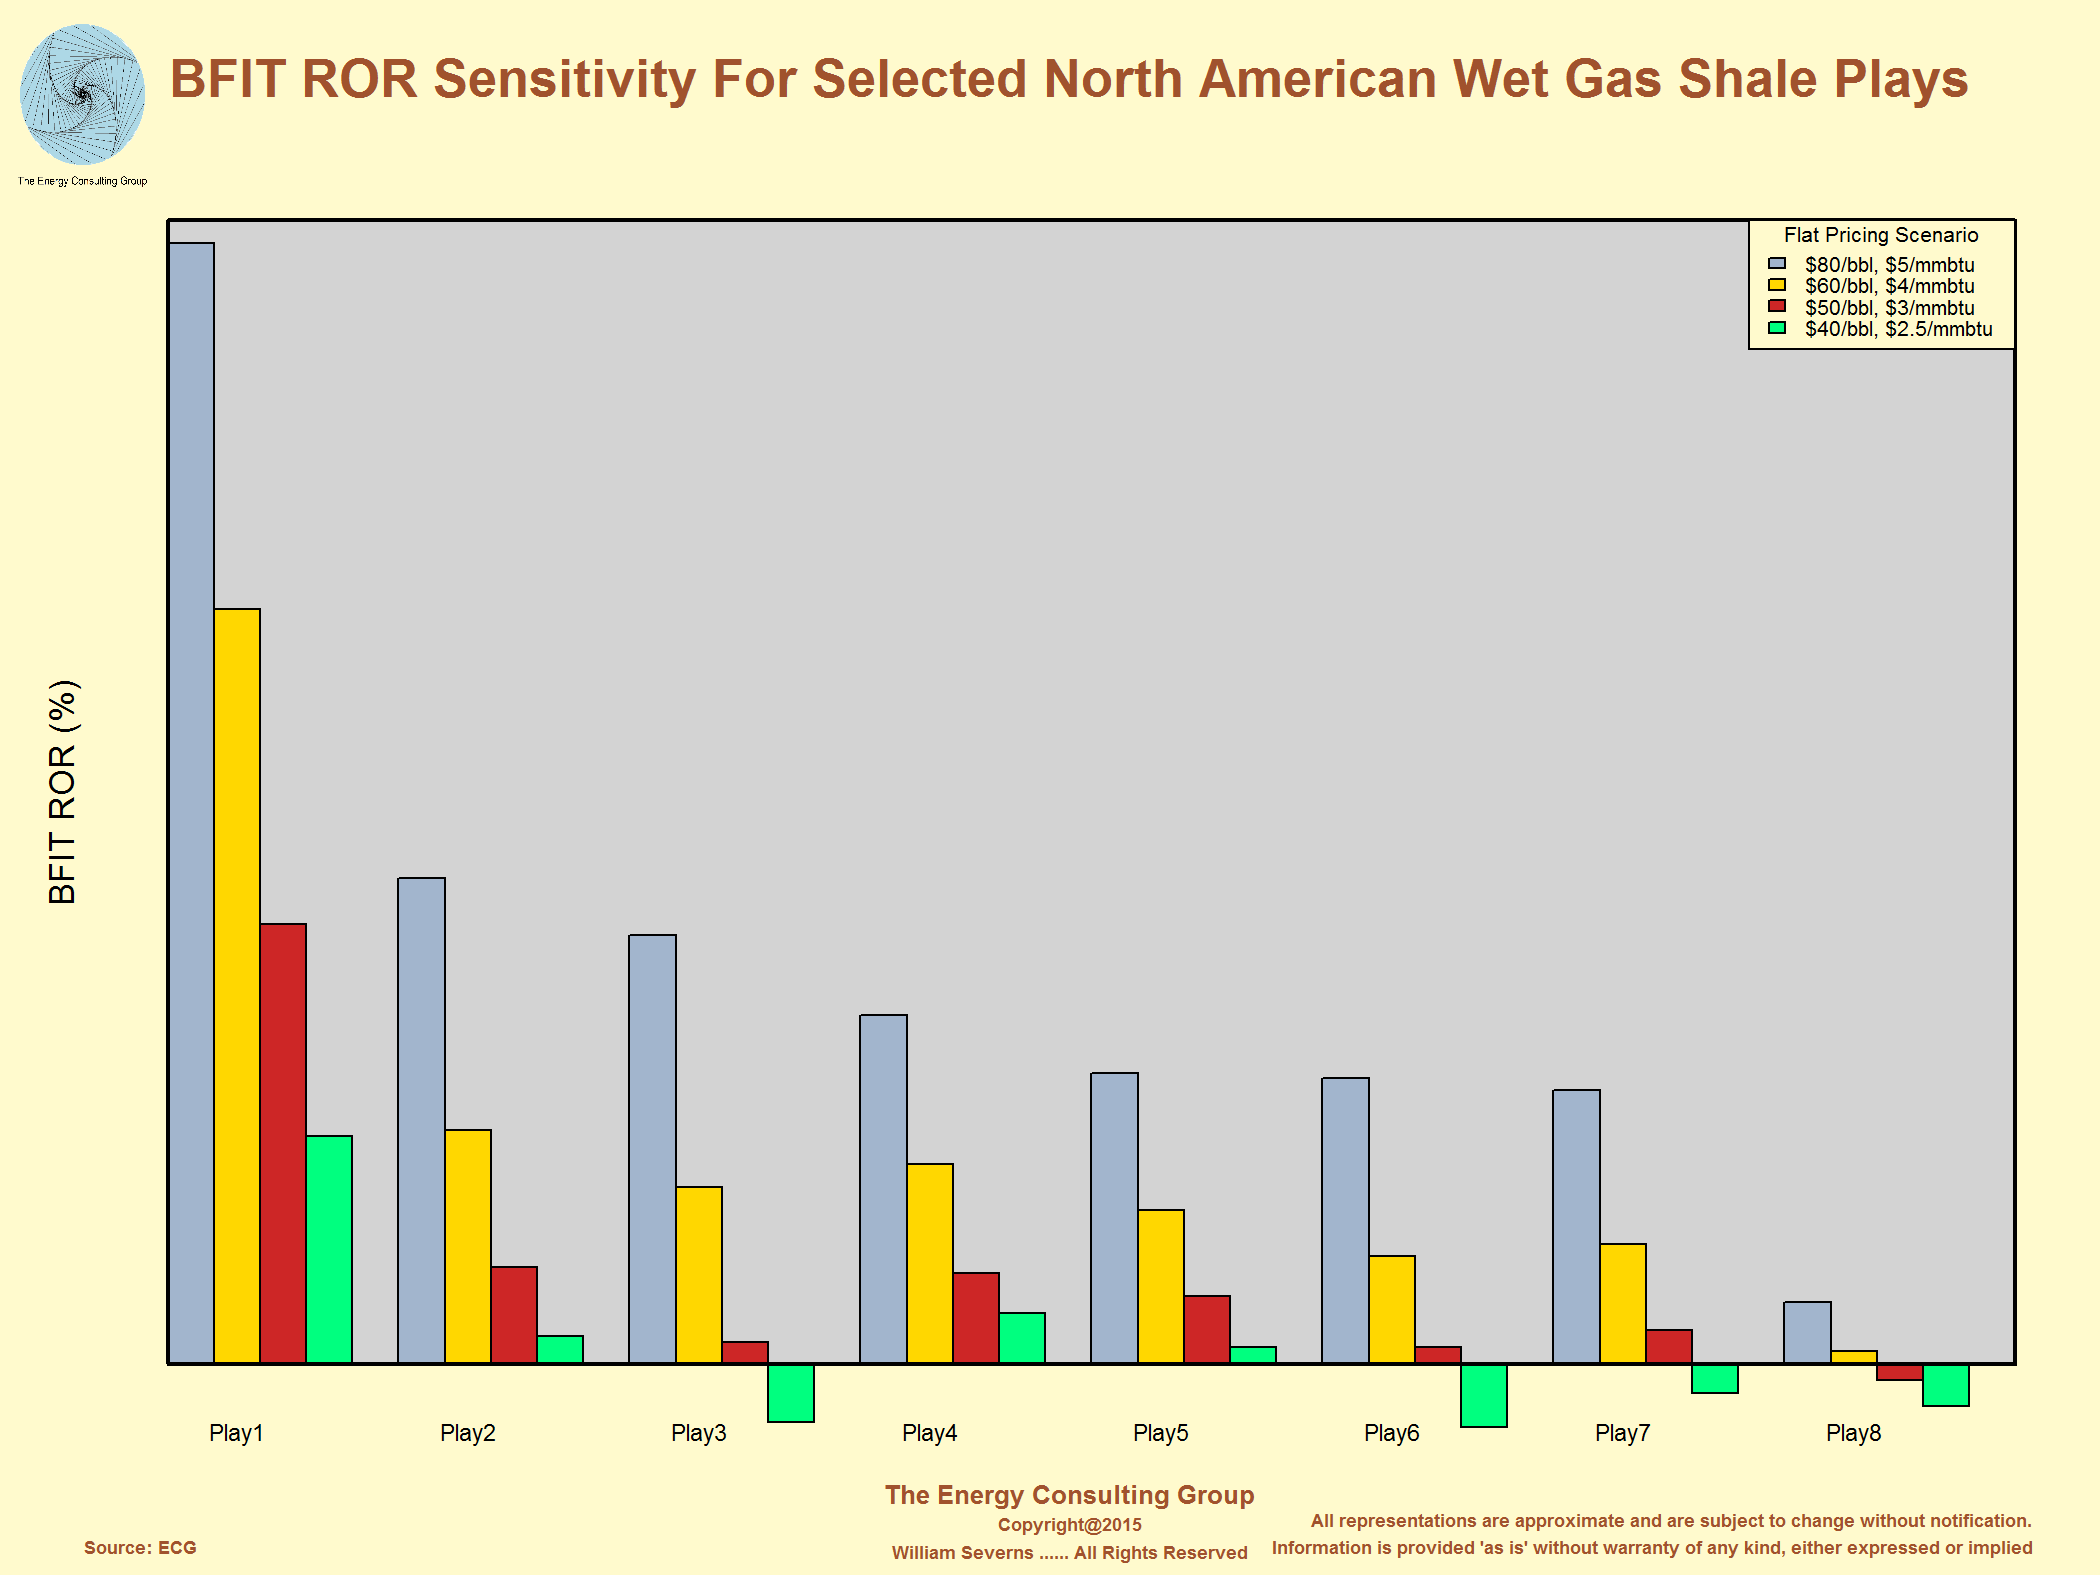
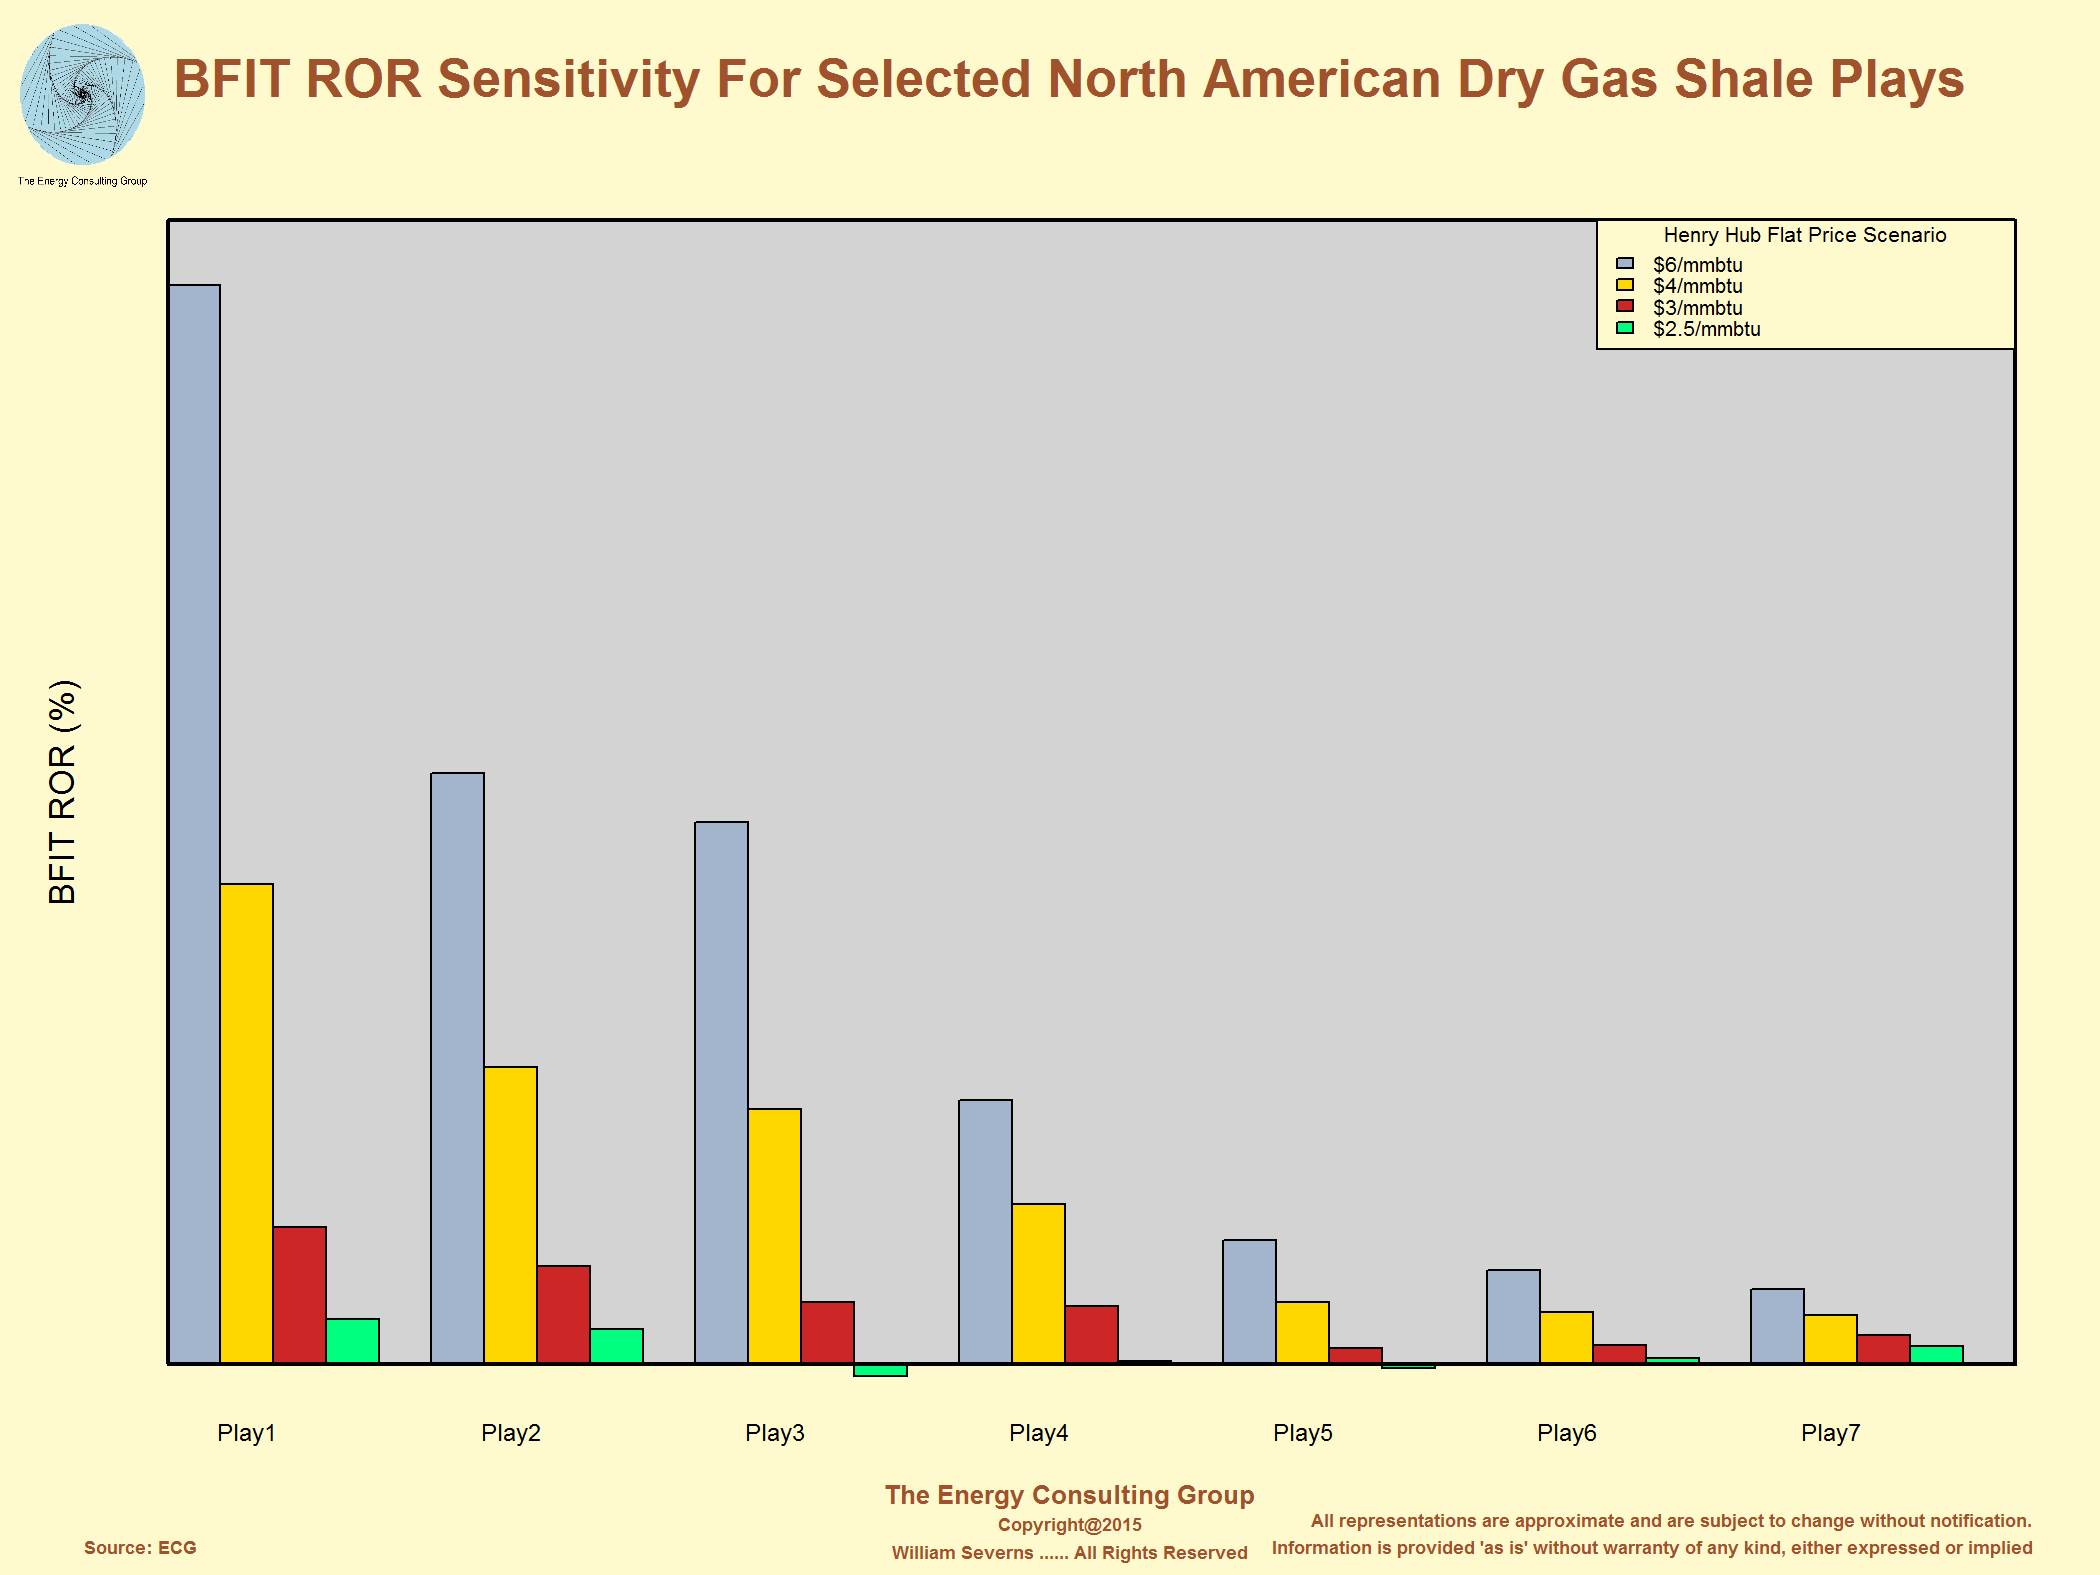
Before Income Tax (BFIT) ROR Sensitivity for Selected North American Dry Gas Shale Plays
Click on the image for higher resolution version of the image.
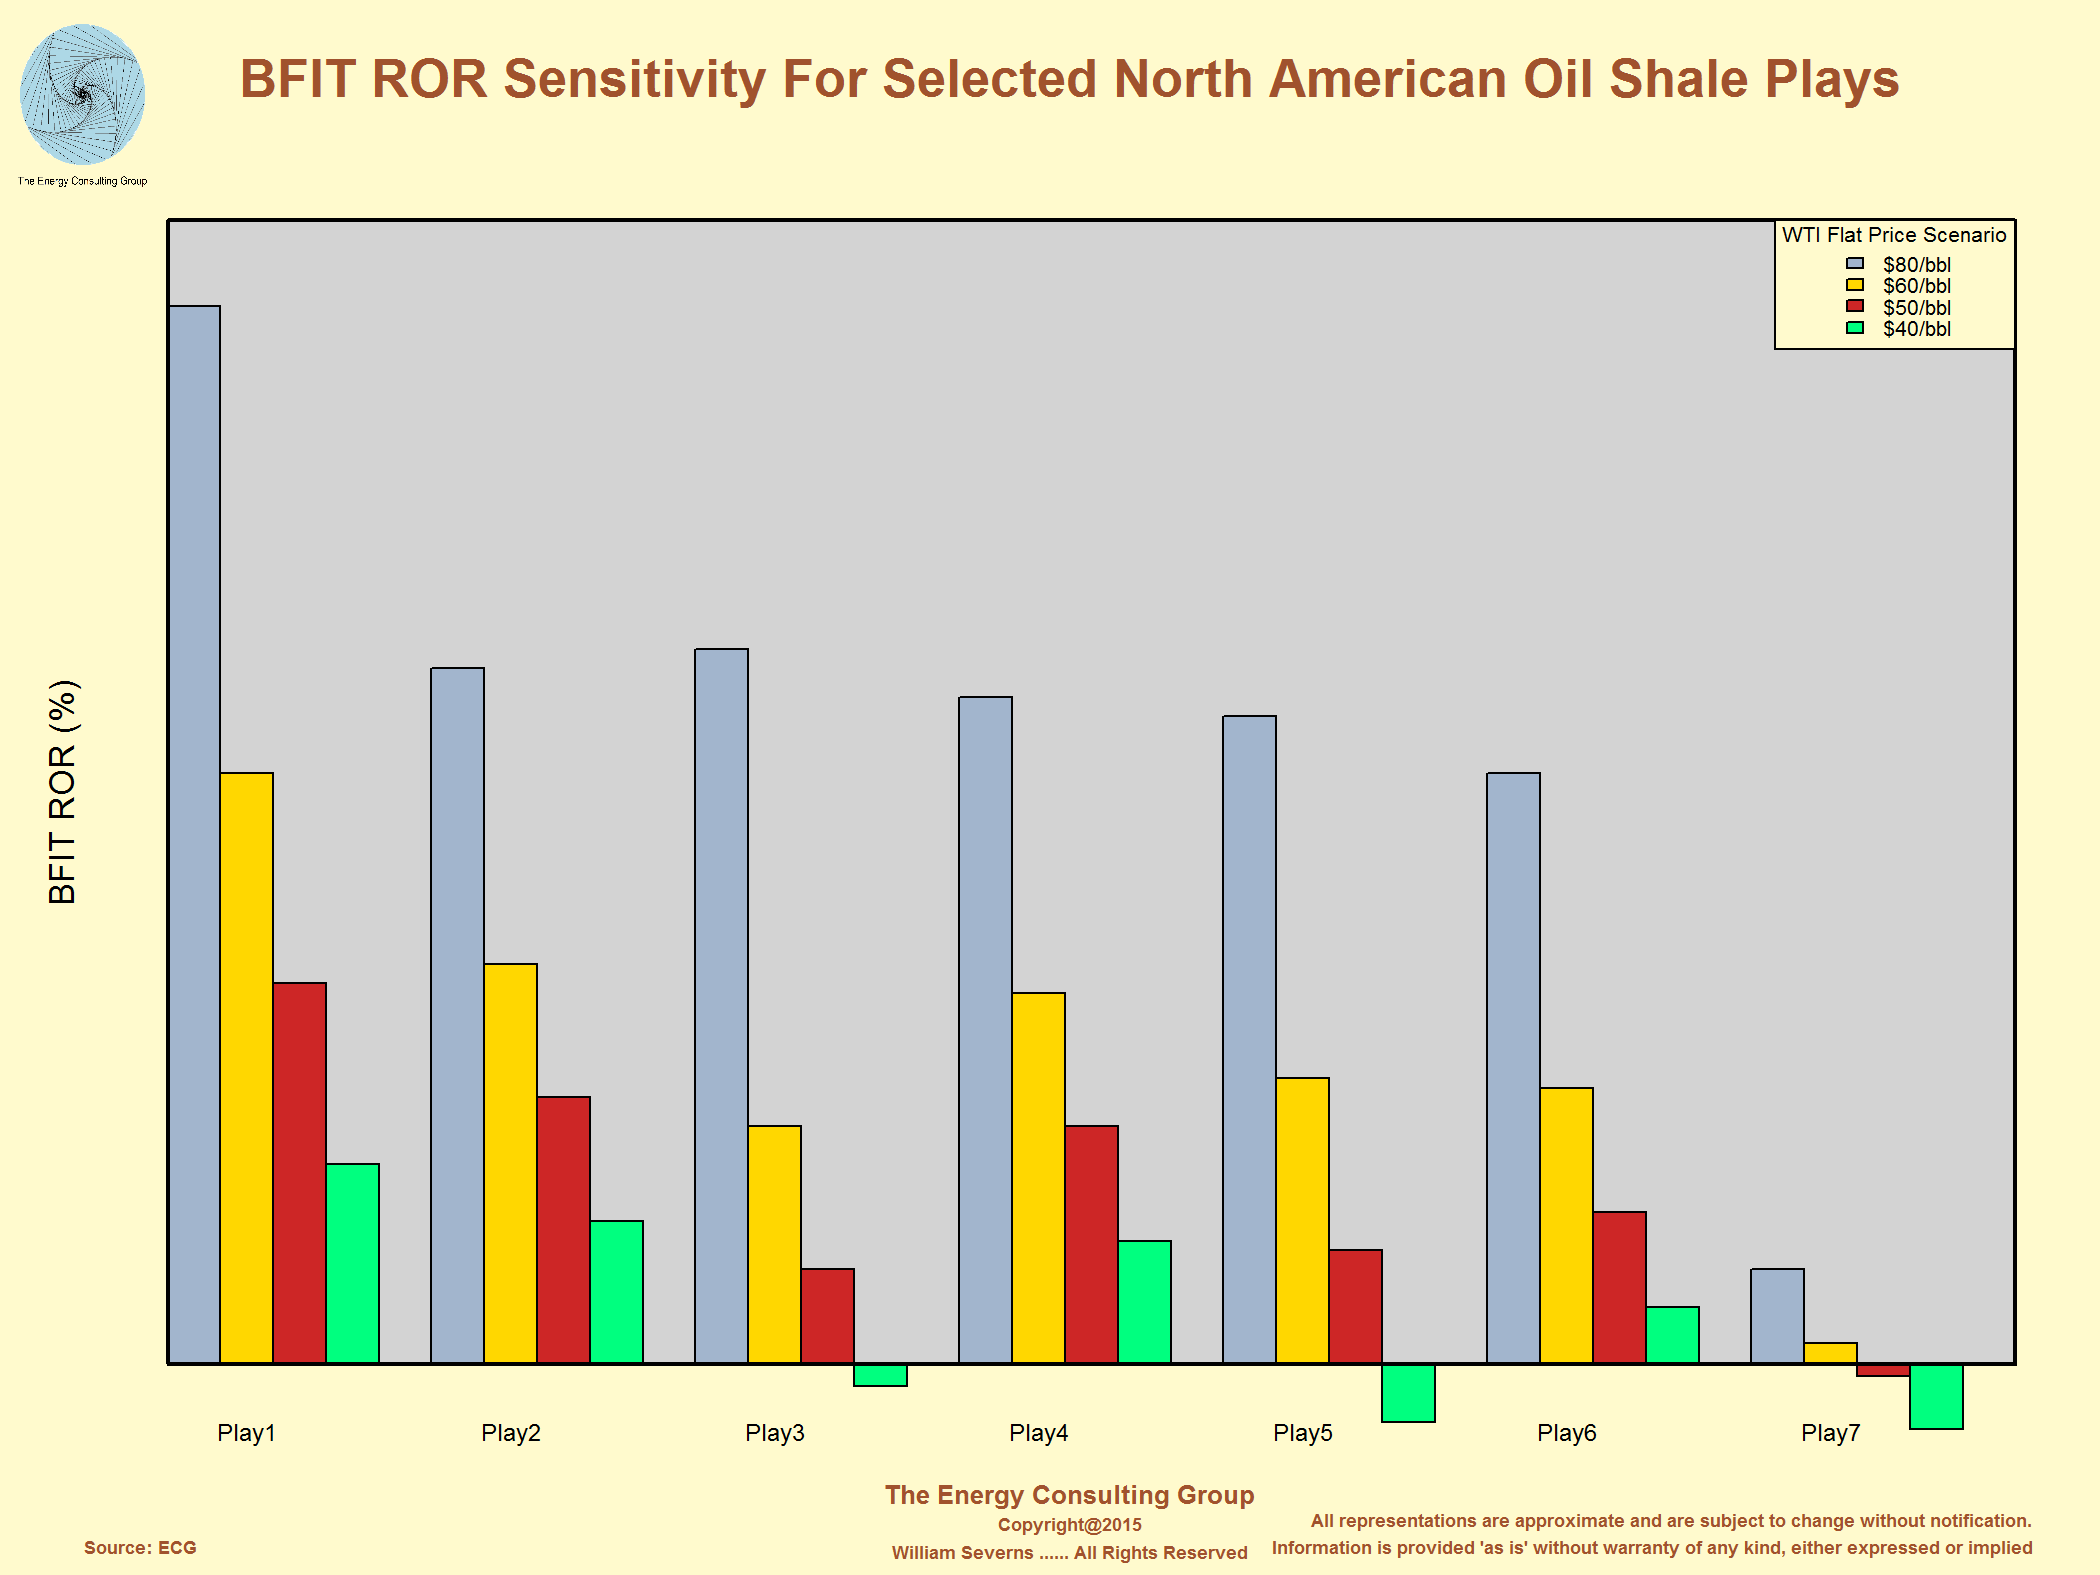
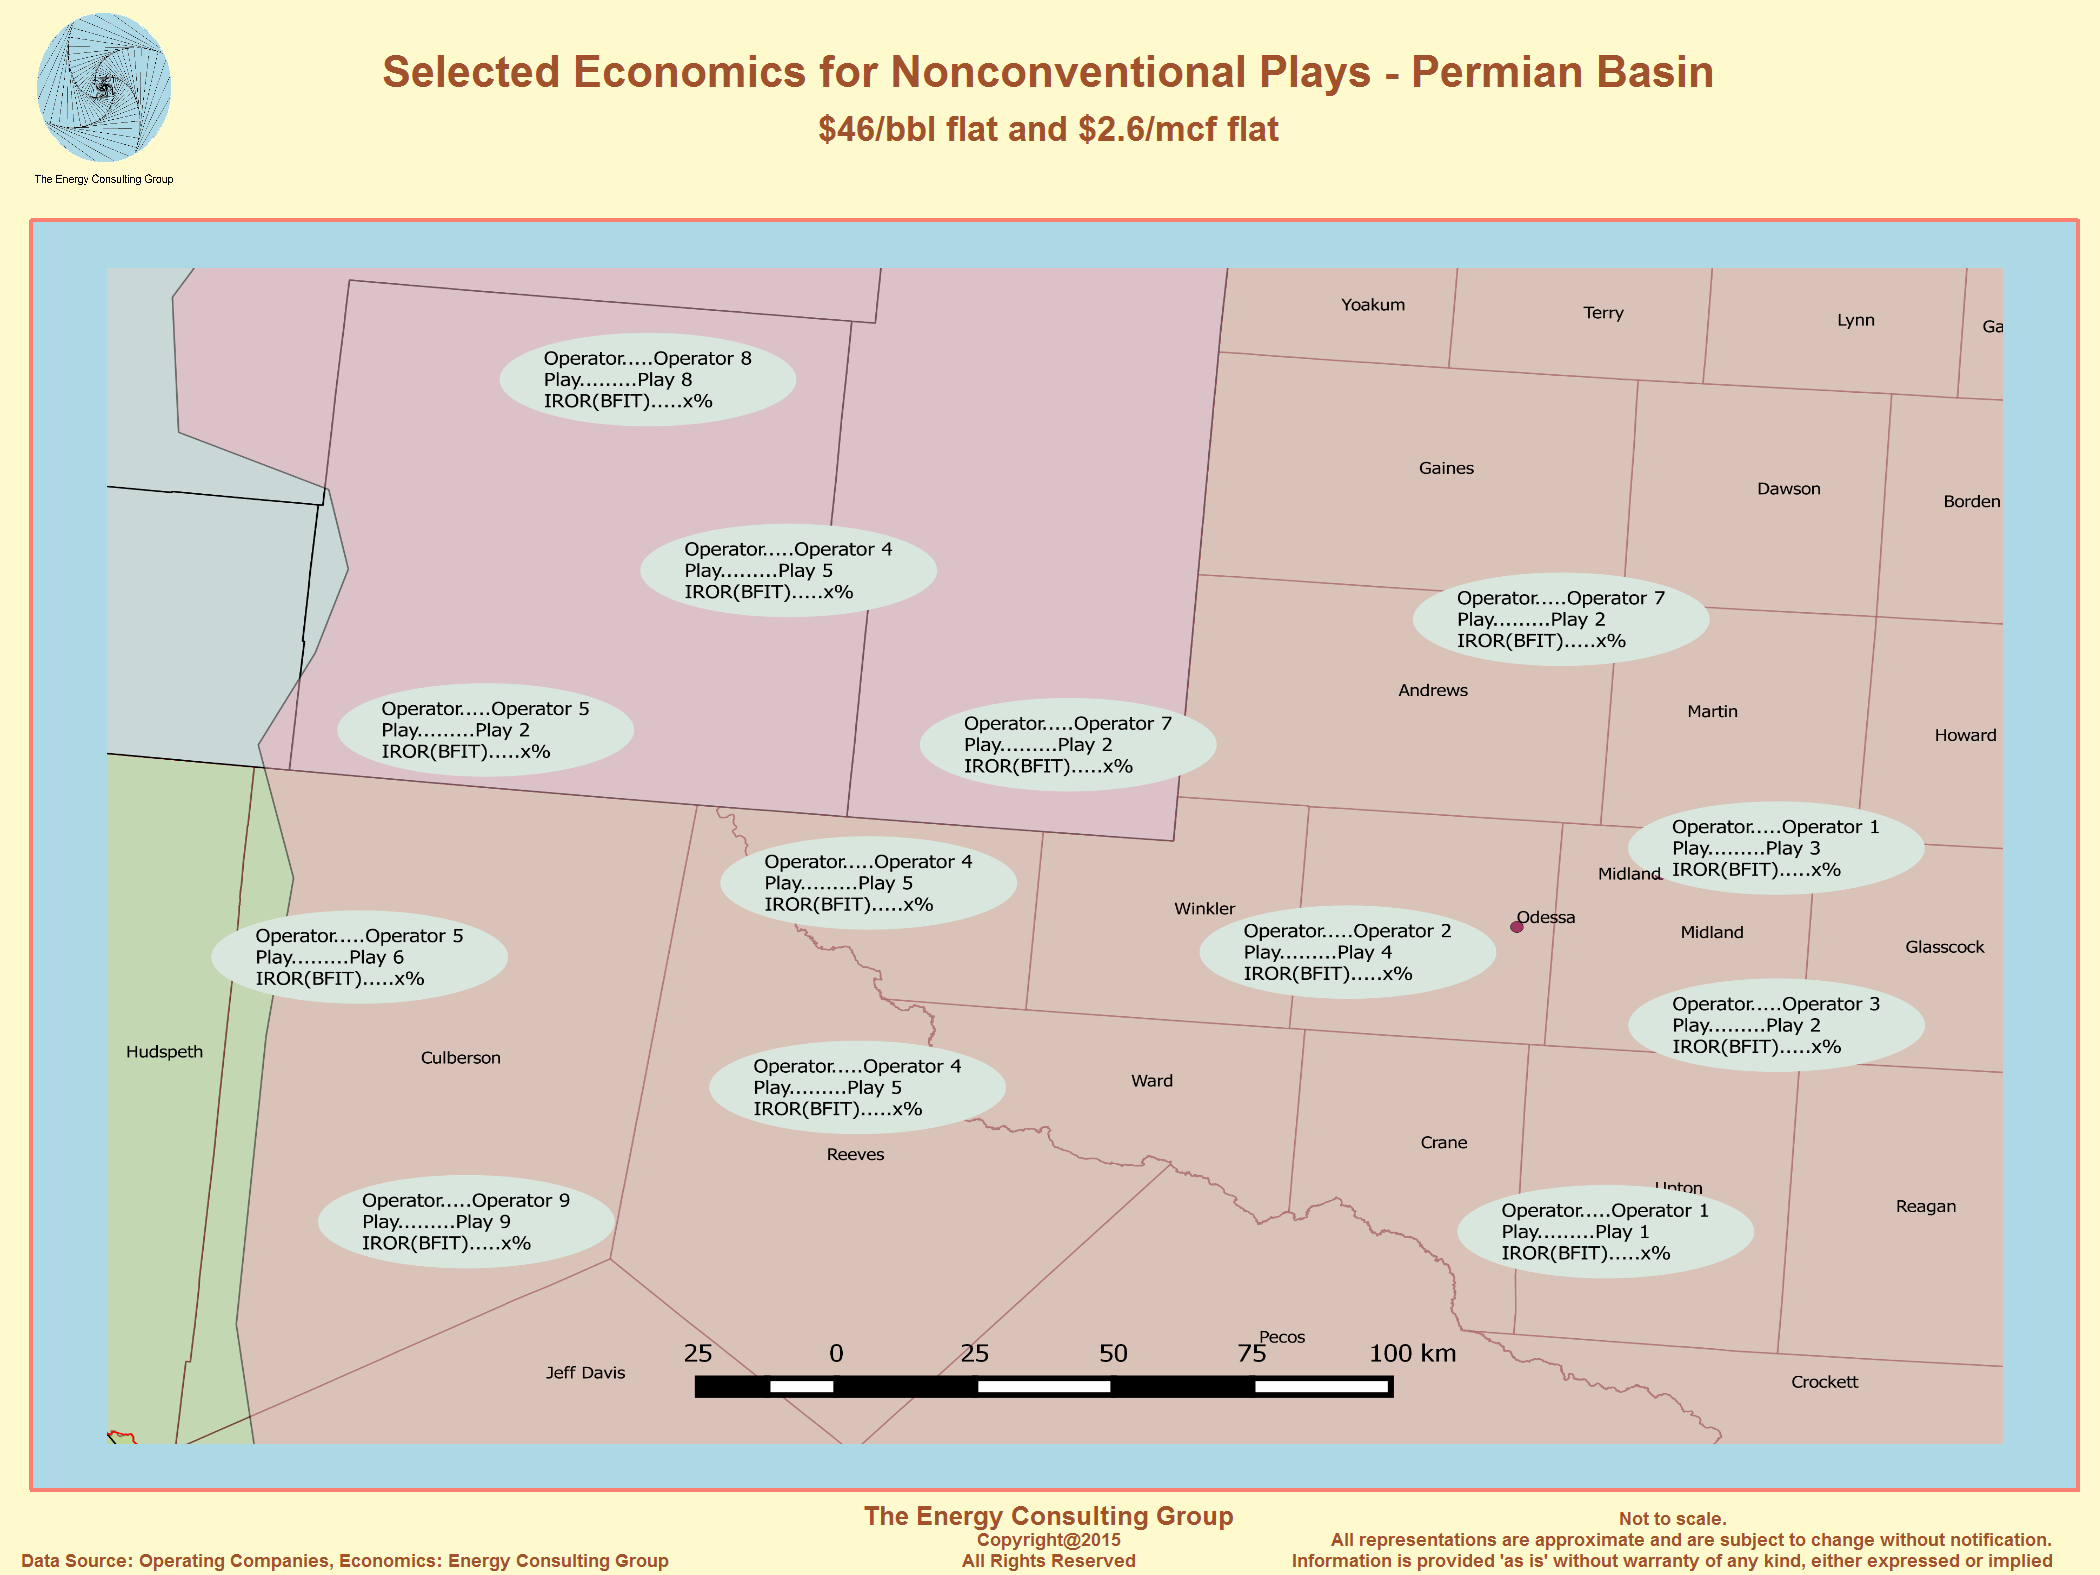
Oil Price Sensitivity - BFIT
Click on the image for higher resolution version of the map.
 Click on the image for higher resolution
version of the image.
Click on the image for higher resolution
version of the image.Supply Curve: Our North American natural gas supply curve has proved useful for predicting long term natural gas price trends. As we note here, we believe that short term natural gas prices are heavily influenced by current natural gas storage levels relative to demand and historical storage volumes. However, over the medium to long term it has been our experience that natural gas prices are primarily determined by the interplay of supply and demand. Note: the curve to the left is constructed by determining the approximate natural gas volumes associated with a play (the width of each rectangle), with the range of natural gas prices (the height) needed to economically develop those volumes.
Consistency:
The common frame of reference we apply to the supply
curve economics is from the perspective of a firm which has already acquired the
lease rights, but has yet to begin development activities. In
practical terms, this means acreage acquisition costs are considered "sunk", and
are not included in the cost basis of the economics.

Click on the image for higher resolution version of the image.
- North American E&P activity models, which have proved to be quite good for predicting such metrics as play level oil and gas rig counts, and fracing horsepower.
- Play/operator level economic sensitivity tools
- Oil and gas supply curves - These have proved extremely useful in projecting oil and gas prices.
- Valuing of new technology
- Supporting A&D efforts
Because of this importance, we take considerable effort to build and maintain our E&P cost database, which covers a wide variety of E&P project types, including deep and shallow water developments, EOR, and conventional and non-conventional activities. We must emphasize that it is not North American centric, but also covers Europe (North Sea), Middle East, South America, Asia, and Africa.
By its nature, it covers different operators in different parts of each of the primary shale plays, and extends back for over 10 years. Given that, we have a robust ability to quantify the pace and magnitude of learning curve effects, place a value on new technologies, and economically evaluate changes in drilling, completion and fracing practices.

Click on the image for higher resolution version of the image.
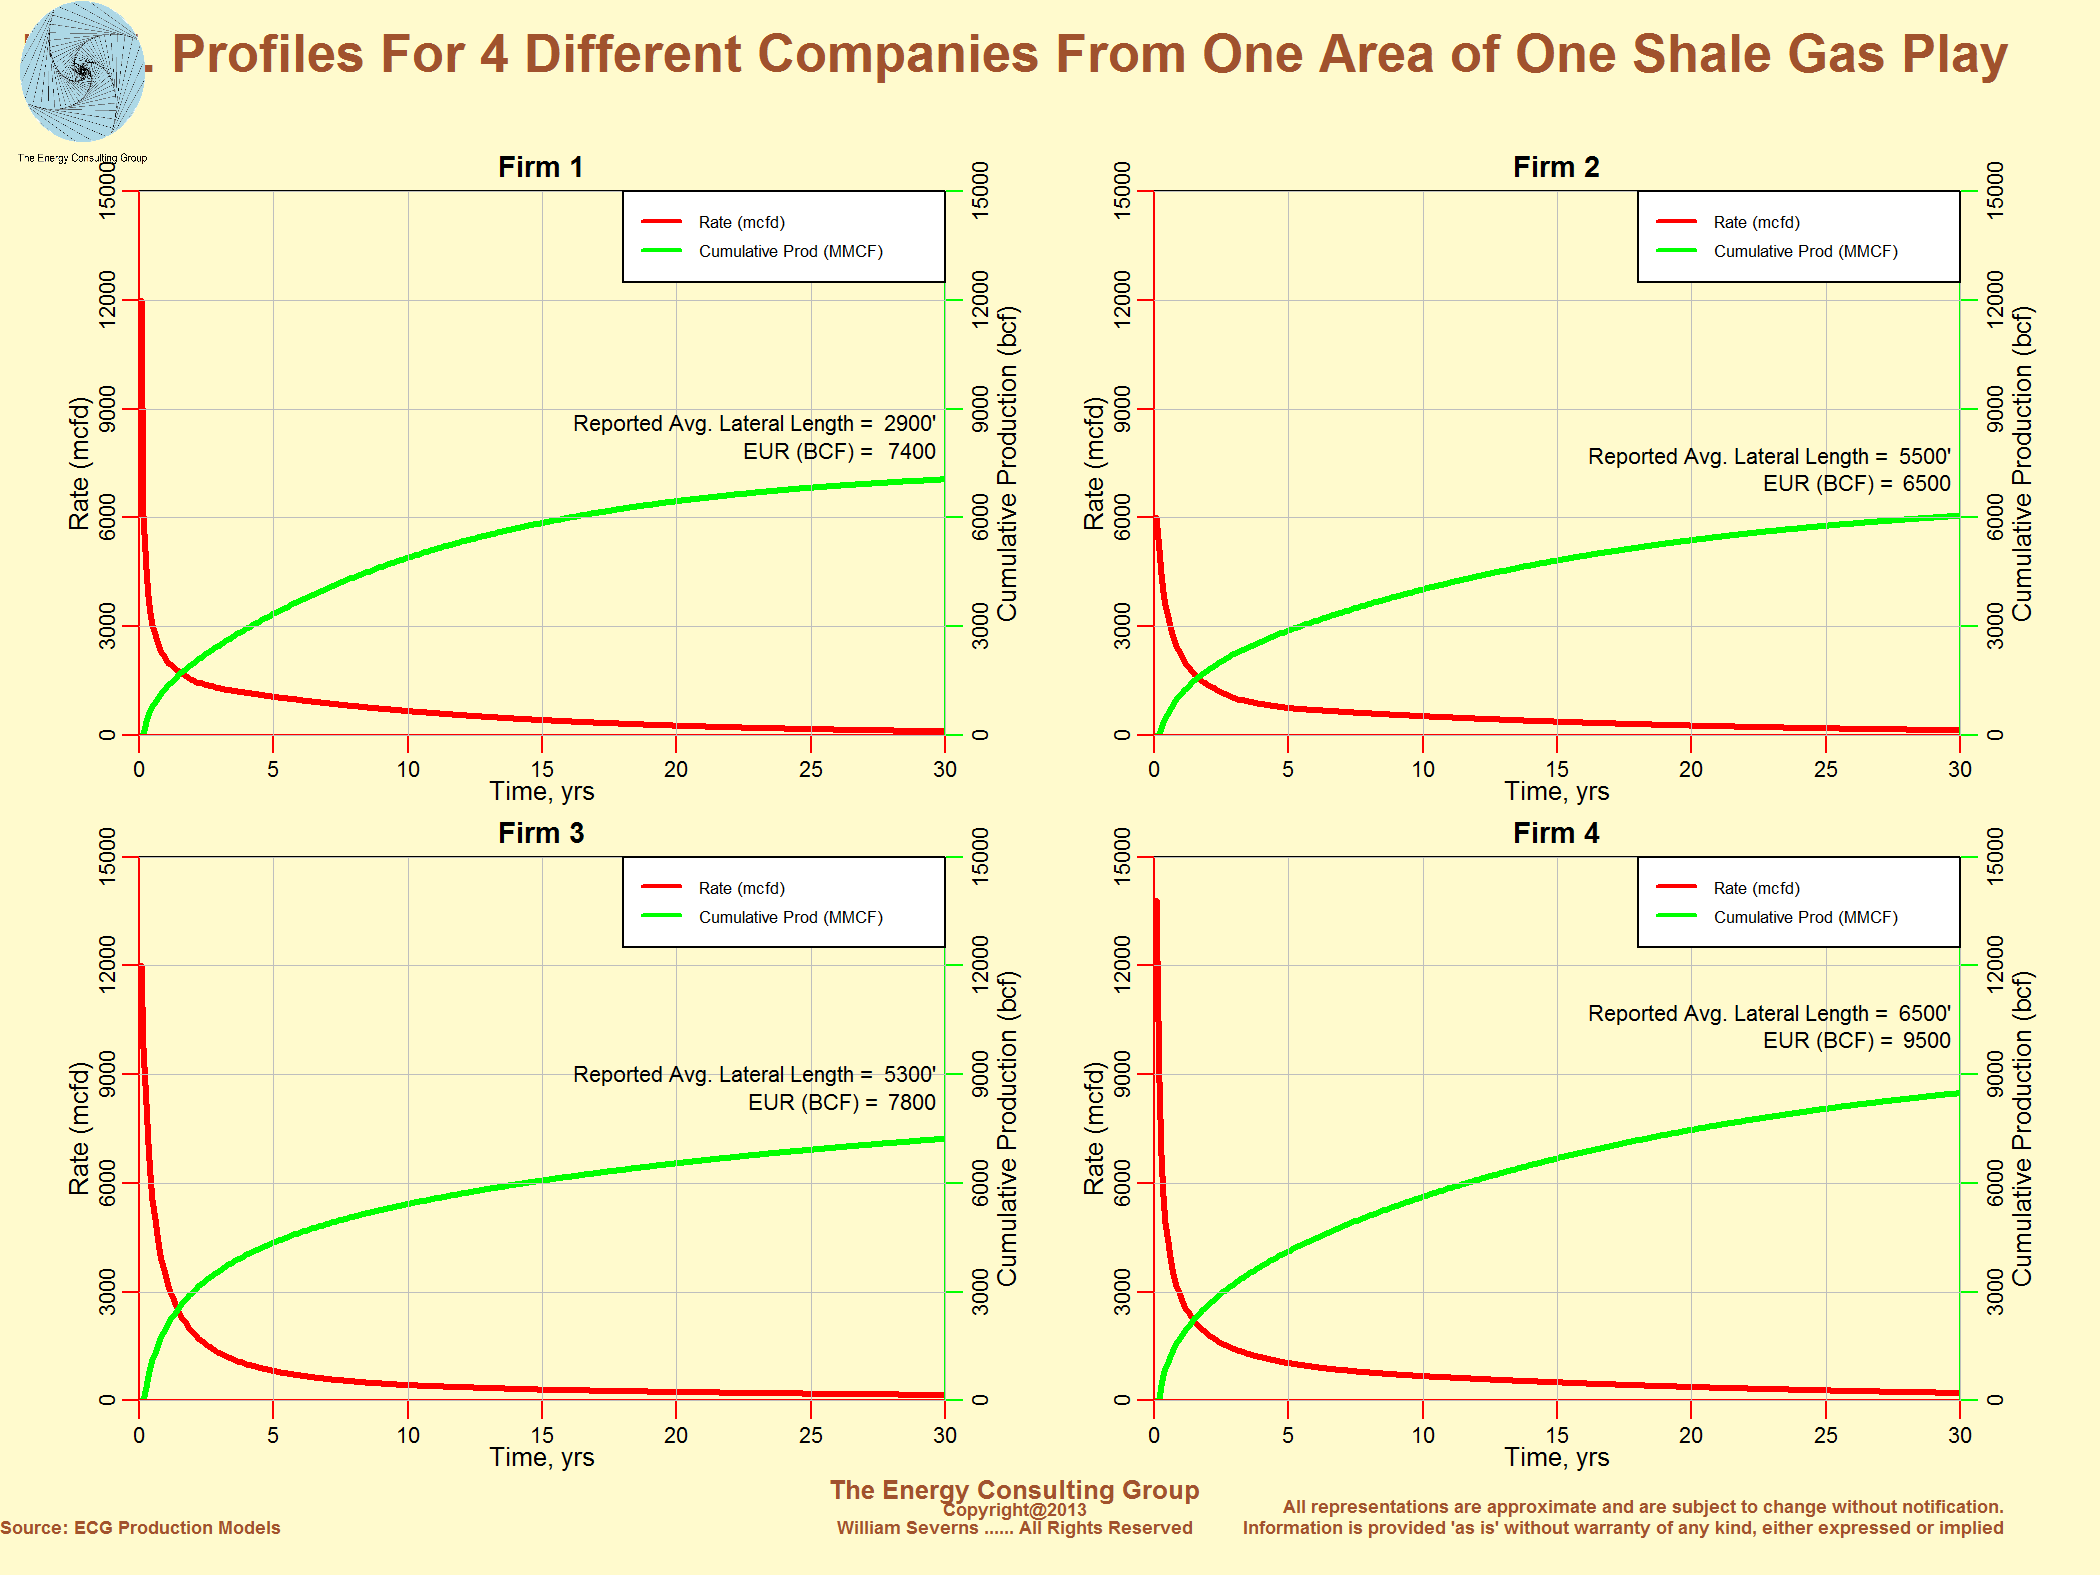
Production Forecasting: This slide and the next slide illustrate our proprietary capability for forecasting oil and gas rates. Though we do have the capability to model production rates and recoveries for shale plays using reservoir simulators, we tend to limit the use of such powerful, complicated tools to emerging plays, which have limited production histories. Another exception is to use the simulator to forecast the timing of major forward CAPEX expenditures in more mature plays, such as estimating amounts and timing of compression needs. For EOR projects we tend to use simulators because the complex reservoir physics make each project unique, and, therefore difficult to model using analogues.
Click on the image for higher resolution version of the image.