|
|
|
Gulf of Mexico Oil and Gas Industry
Deepwater Focus
===========================================================================================================================================================
Despite being eclipsed in the news
by shale gas and light, tight oil plays, especially those in the Permian
Basin, the Gulf of Mexico (GOM) remains a
vital, dynamic and necessary part of the USA oil and gas portfolio.
This is evidenced by the continued success of new government lease
auctions, high levels of indiustry investment, and, most importantly, by
elevated levels of oil production coming from new deepwater fields.
In total the Gulf of Mexico is producing about 2 million barrels of
crude oil per day, which if it were a country, would place it as the 12
largest producer of oil in the world, just after Mexico and just before
Nigeria.
The majority of GOM oil production is now sourced
from the deepwater region of the Gulf. The best illustration of
the success and continued importance of the deepwater segement to the
Gulf of Mexico oil and gas industry is to scroll through the production
graphs of some of the deepwater fields presented below. The
majority of the fields have been clear success stories, often producting
tens of thousands of barrels a day of oil with hundreds of millions of
barrels of cumulative oil recovery, with one or two on track to produce
over a billion barrels of oil.
|
Sharing the Bounty
Oil and gas production from federal
waters in the Gulf of Mexico generated approximately $8 billion in
royalty revenue for American taxpayers in 2014. Not included in the $8
billion is the nearly $1 billion in revenue from lease sales 231
(Central Area) and 238 (Western area), which, respectively, earned the
government about $850 MM, and $110 MM. In addition, we estimate
annual federal and state income tax revenues related to Gulf of Mexico
production to be on the order of $10 billion to $15 billion. In total,
in 2014 we estimate the government realized between $19 to $24 billion
dollars from oil and gas related exploration, development and
production activities in the US Gulf of Mexico. Numbers of this
magnitude, make the US people the largest single
revenue receipient and beneficiary of US offshore oil and gas
development. In essense, this makes the US government a key
deepwater development partner.
Link to our
3D
portal map of the Gulf of Mexico, which shows the GOM from an oil and gas
perspective. We find this type of 3D representation is useful
for showing what deepwater really means in comparison to shelf
activities. It is zoomable and roamable, and can be rotated
for better viewing angles. Map controls: to rotate use the left
mouse button, to zoom in/out use the mouse wheel, and to roam use the
right mouse button. |
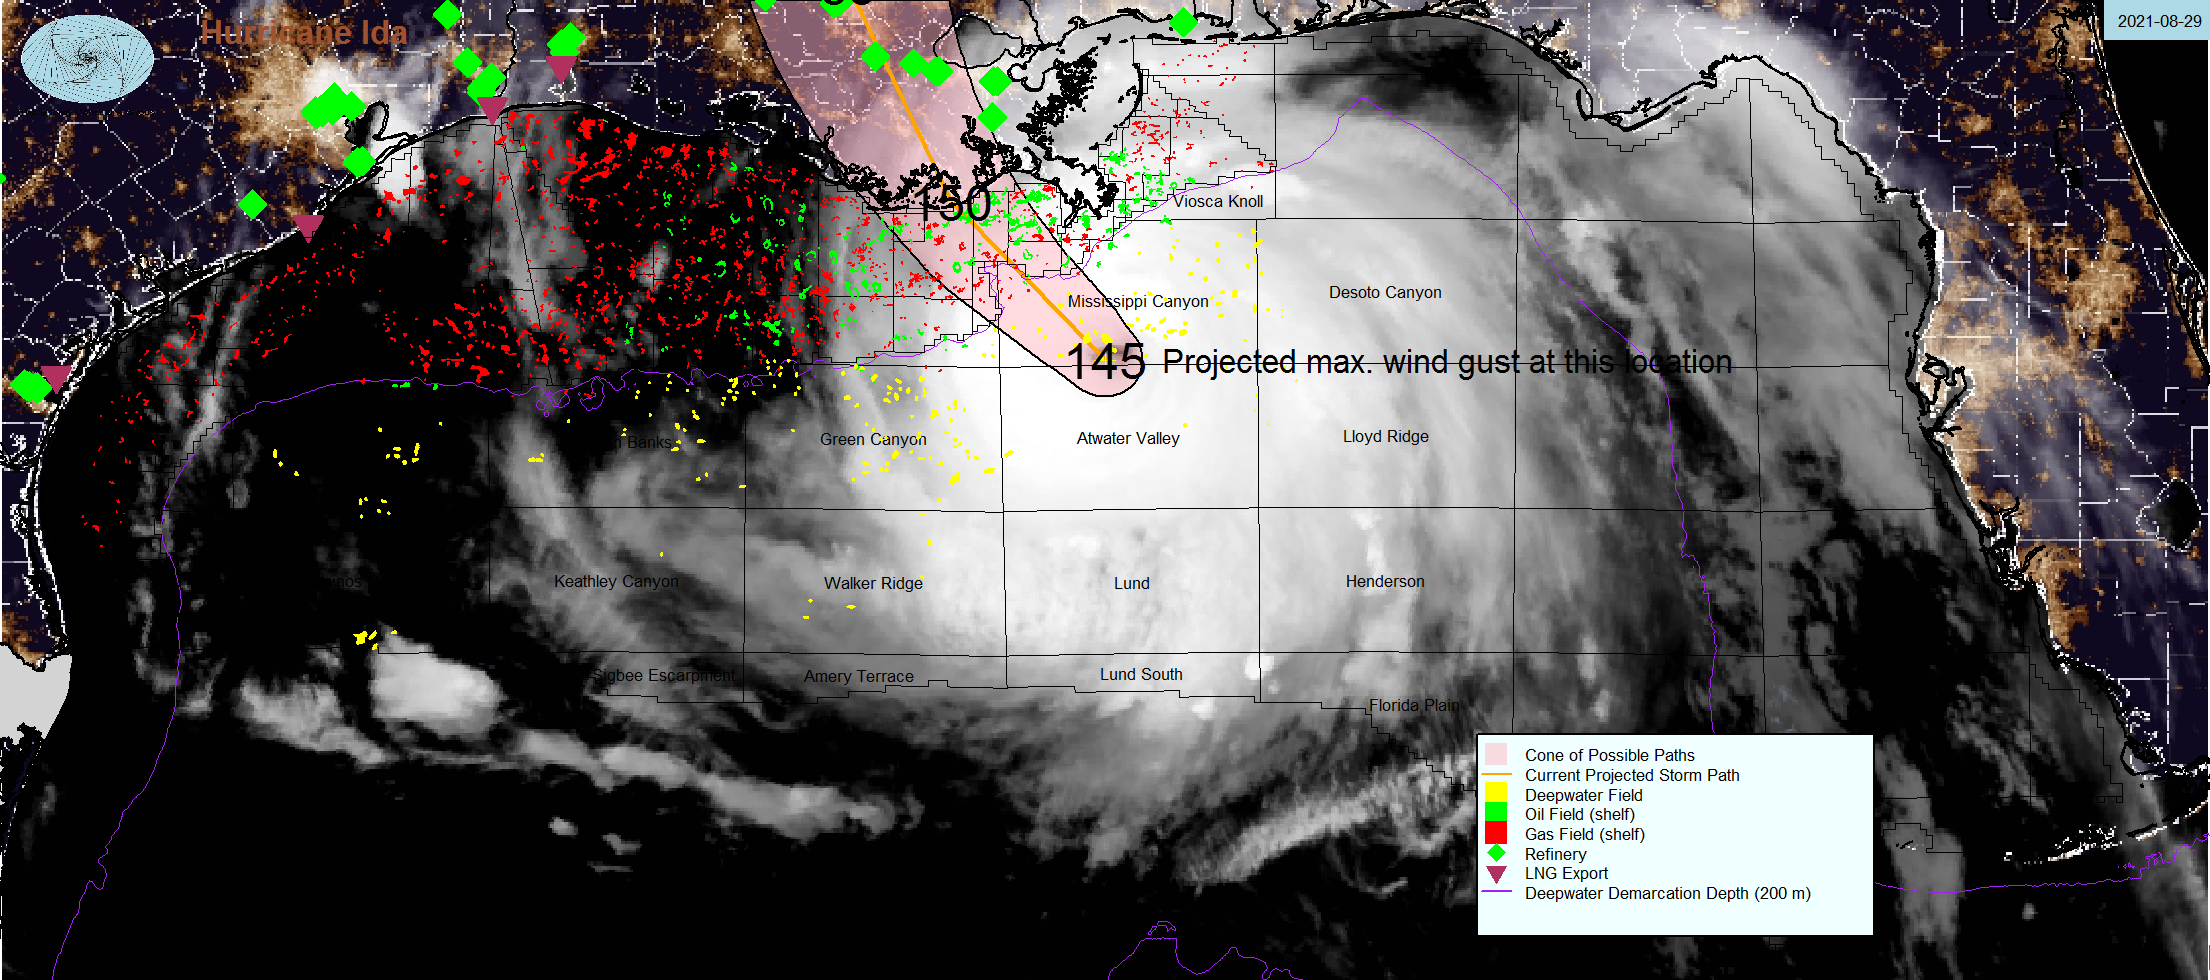
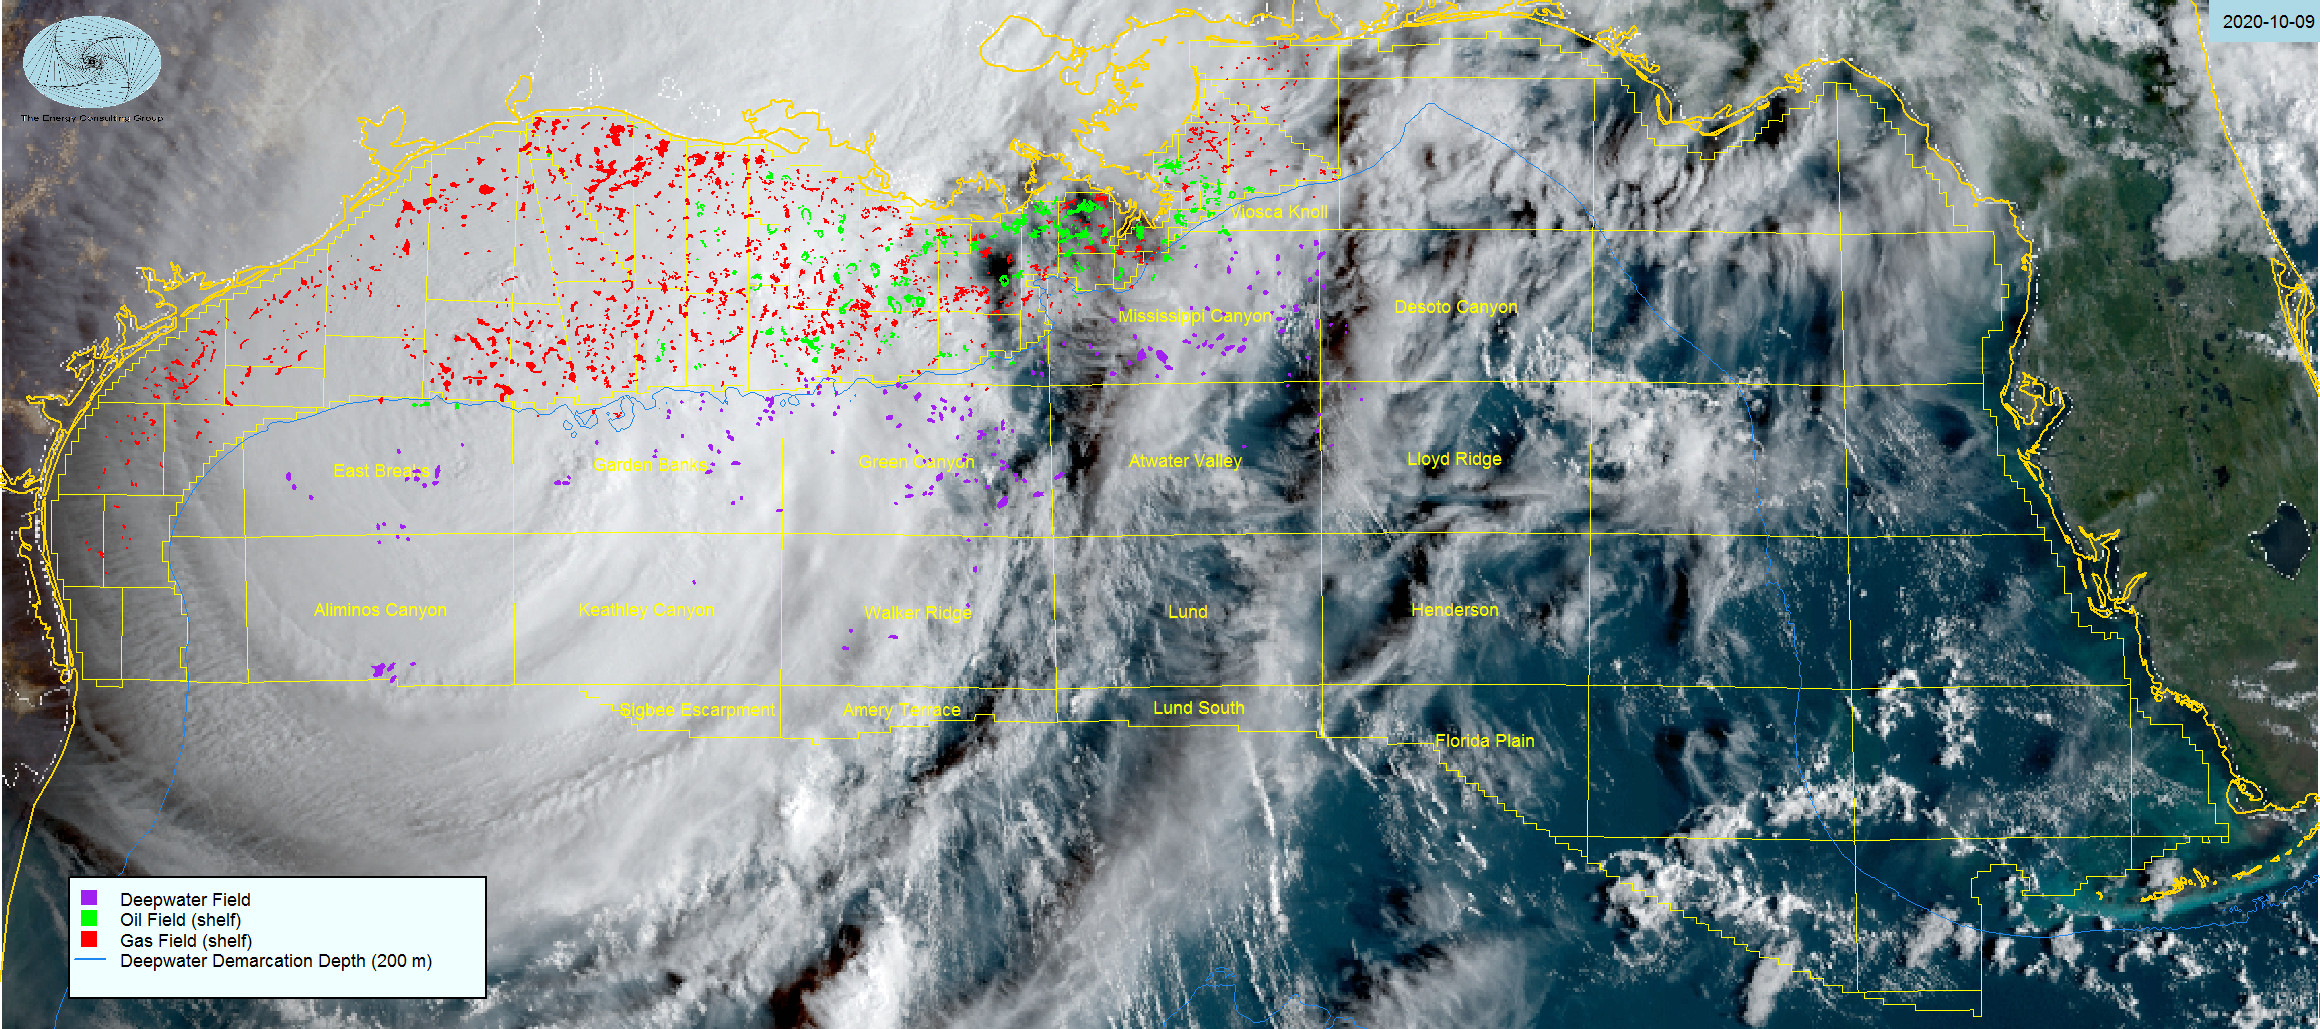
Gulf of Mexico Hurricane
Ida Watch: Tracking GOM
Hurricanes from an Oil and Gas Perspective
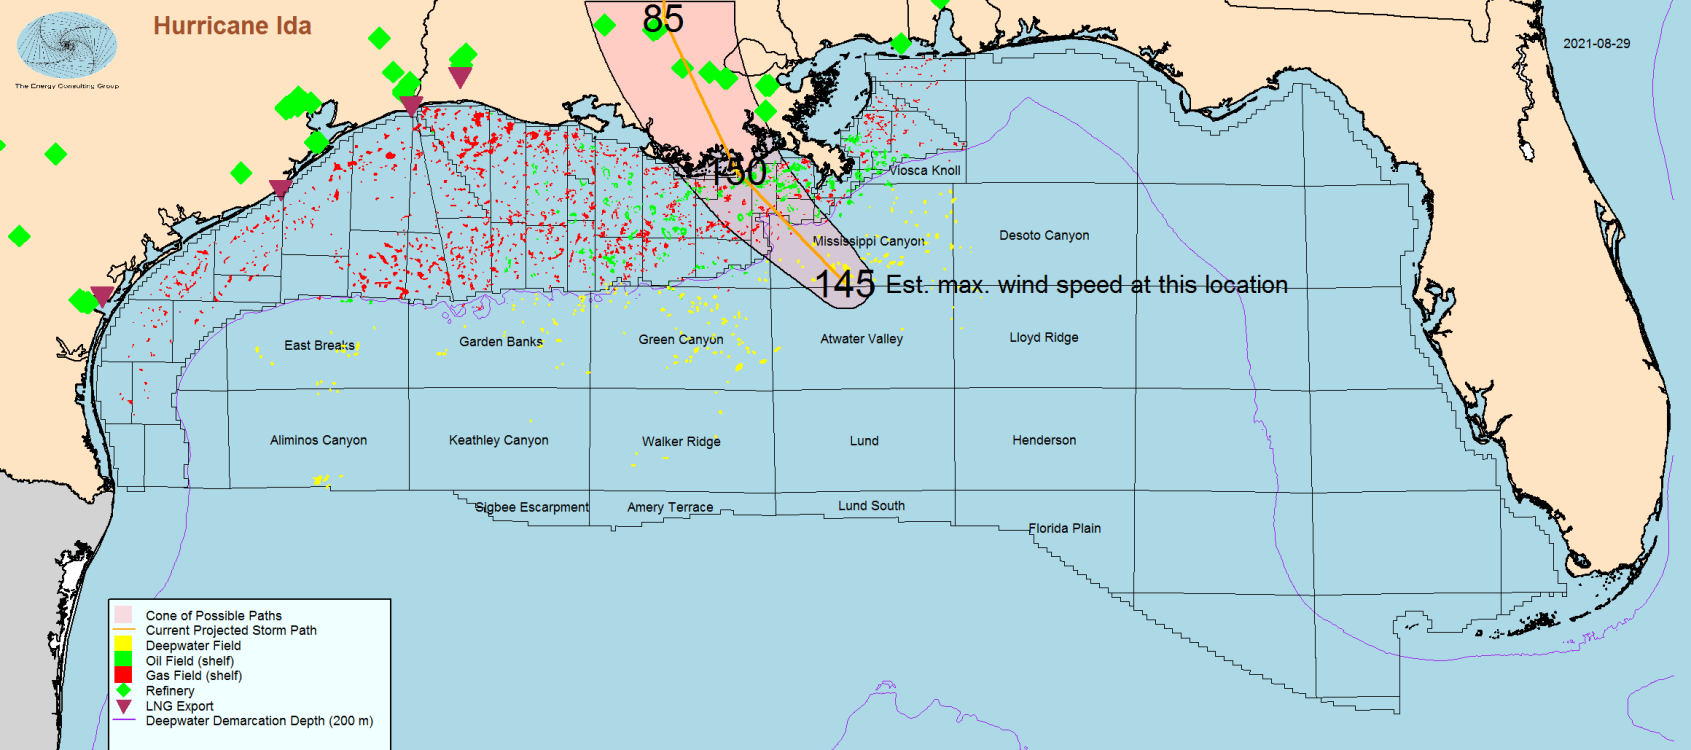
For a
full size view, click the above image
Note: this
image is provided for illustration purposes only and may not reflect
current conditions, and as such should not be relied upon for
navigation, business or personal uses. |
|
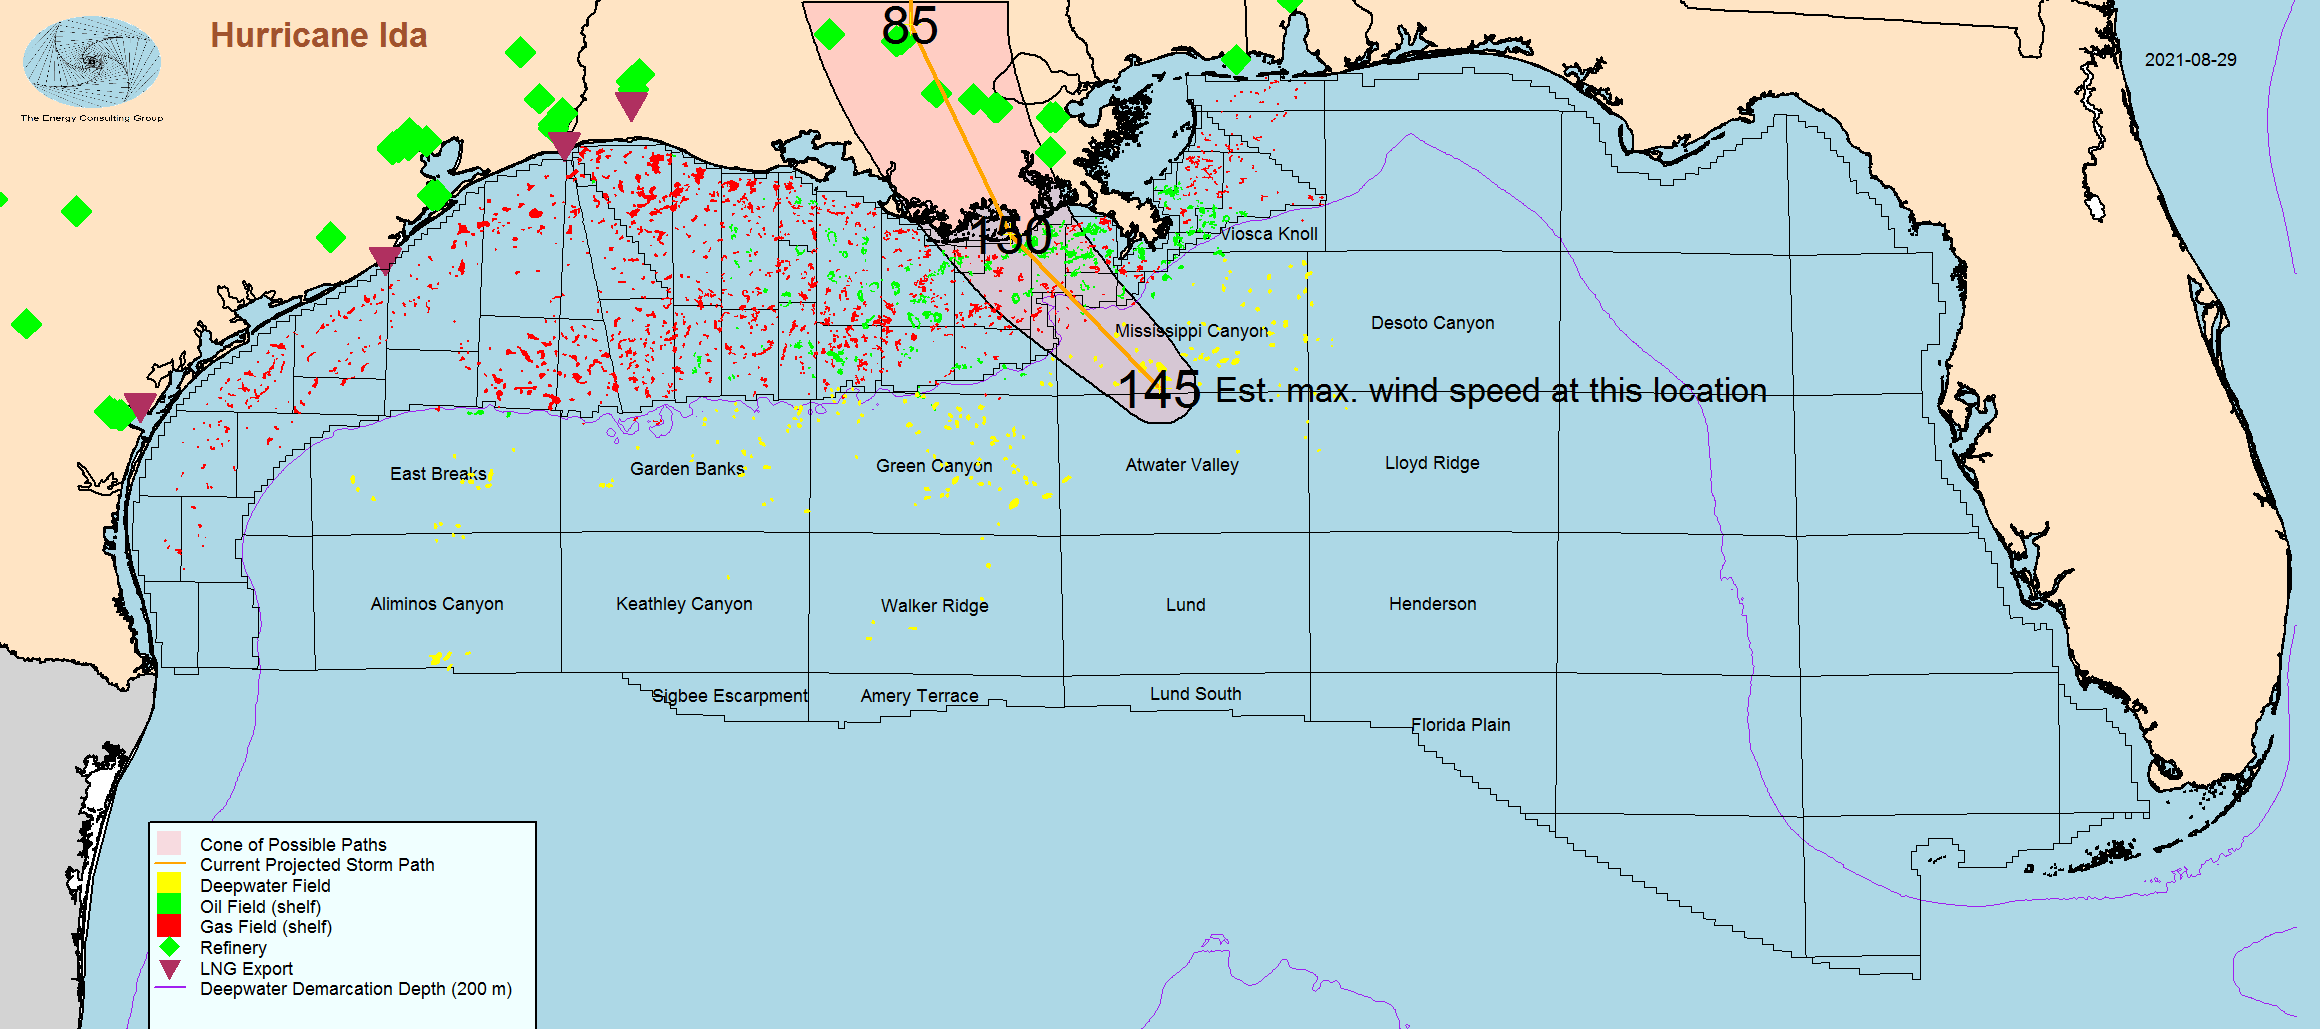
Hurricane Ida and
its relationship to Gulf of Mexico oil and gas fields and
installations.
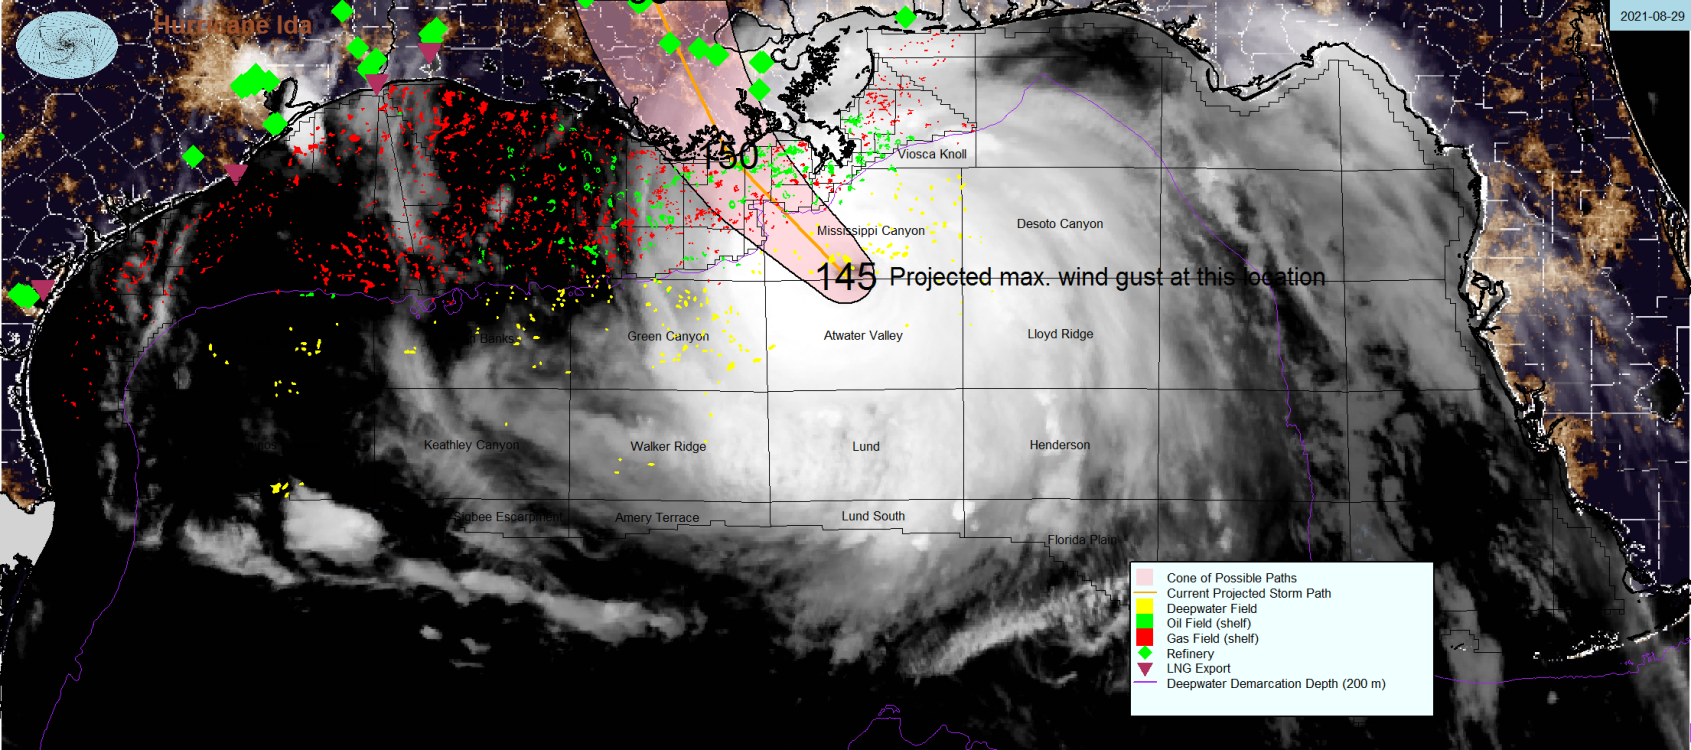
For a full size version of this satellite image, click
the above image
Note: this
image is provided for illustration purposes only and may not reflect
current conditions, and as such should not be relied upon for
navigation, business or personal uses. |
|
|
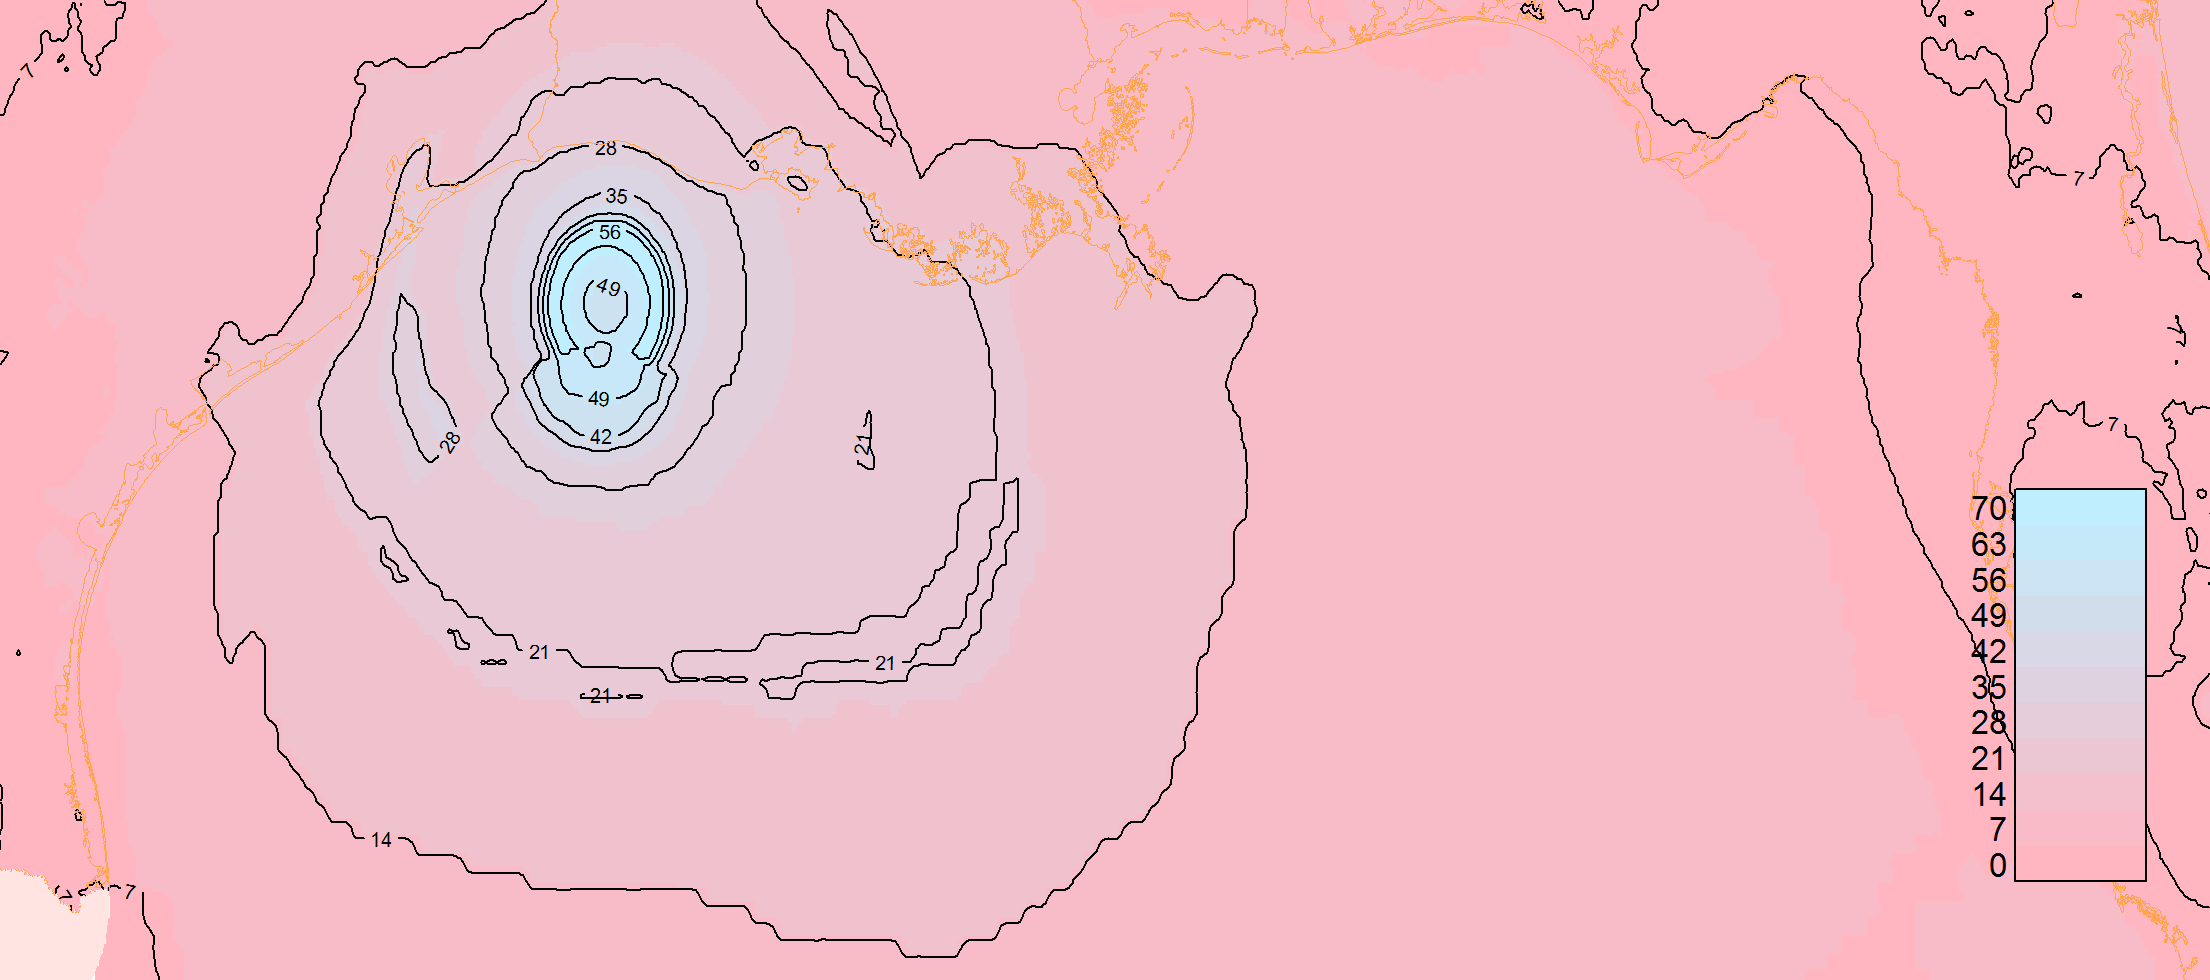
Wind gust map across the US Gulf of Mexico (GOM).
The wind gust speed is in knots and is provided by NOAA, which defines wind gusts as "the maximum
3-second wind speed forecast to occur within a 2-minute interval at
a height of 10 meters."
Definitions
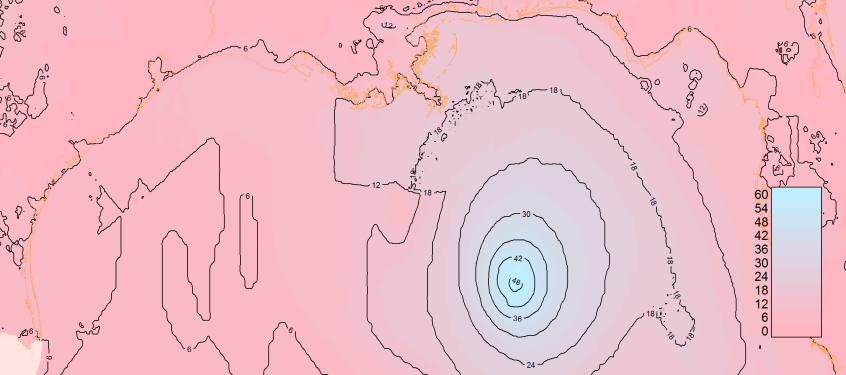
For a full size view, click the above
image
Note: this
image is provided for illustration purposes only and may not reflect
current conditions, and as such should not be relied upon for
navigation, business or personal uses.
|
|
Controls for this 3D: to rotate use the left mouse button, to
zoom in/out use the mouse wheel, and to roam use the right mouse
button.
For full screen version of the above 3D image
go here. |
Gulf of Mexico:
Deepwater Discoveries
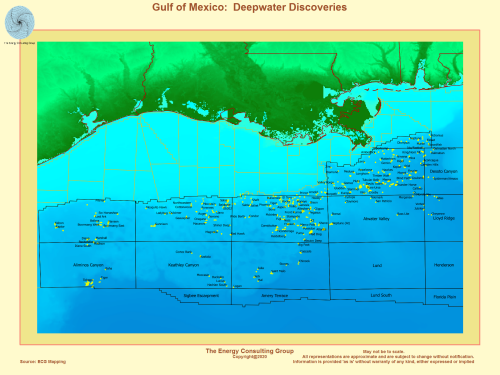
For a
full, screen size version of this image, click this thumbnail
|
Controls for this 3D: to rotate use the left mouse button, to
zoom in/out use the mouse wheel, and to roam use the right mouse
button.
For full screen version of the above 3D image
go here. |
The 3D image to the left is of Hurricane
Laura making churning its way across the Gulf of Mexico.
The image is based on this satellite view of Hanna, with the
image relief based on data provided by the National Weather Service. Please note
the wind speeds are only
estimates, meaning the acutals will vary, so do not rely on this
information for personal, business or safety decisions.
National Huricane Center and local weather reports are still the
best sources of storm related information. |
Bathymetry (depth ) map for the Gulf of Mexico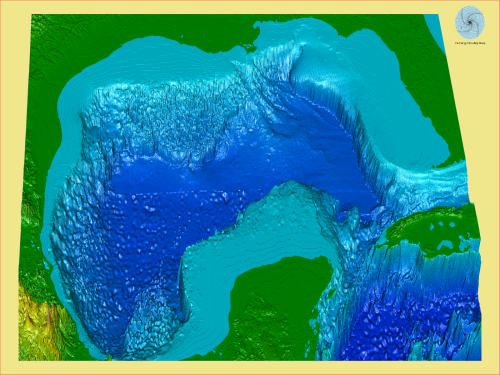
Click the above image, for a full screen
version of the map |
Gulf of Mexico deepwater oil and gas
potential is not limited to the United States, However, the US is the furthest along in exploiting deepwater resources.
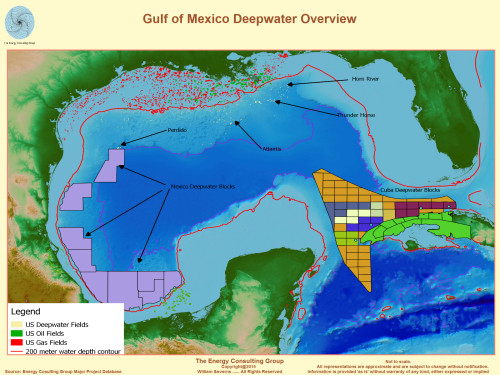
Click the above image, for a full screen
version of the map |
Gulf of Mexico: Deepwater
Fields and Water Depth
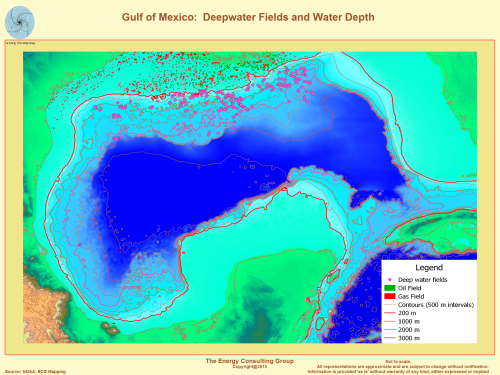
Click the above image, for a full screen
version of the map
|
United States Gulf of Mexico
Oil and Gas Production: Deep water and shallow water (shelf)

Click the above, for a full screen version of
the production plot |
Offshore technology has steadily marched into
deeper waters.......
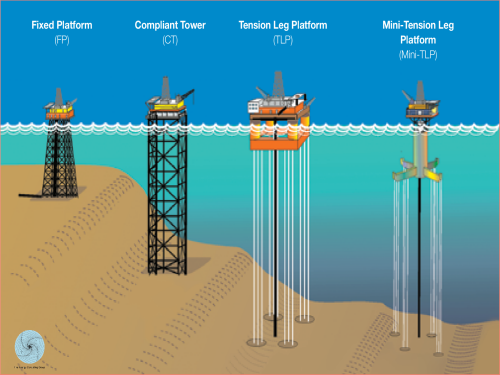
Click the above image, for a full screen
version
Courtesy of BOEM |
......until it was no longer resting on the seafloor, but routinely
floating in thousands of meters of water.
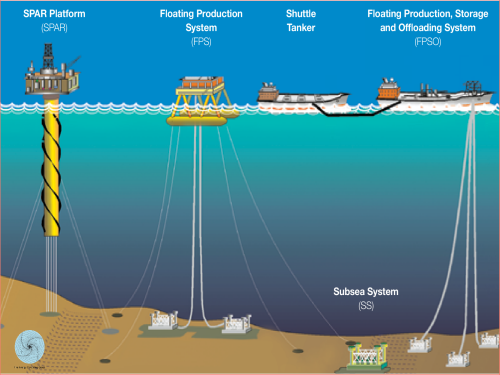
Click the above image, for a full screen
version
Courtesy of BOEM |
USA GOM Deepwater Drilling Activity - Field Name
July 2020
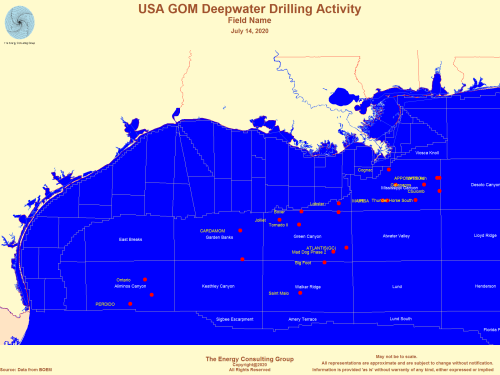
Click the above image, for a full screen
version |
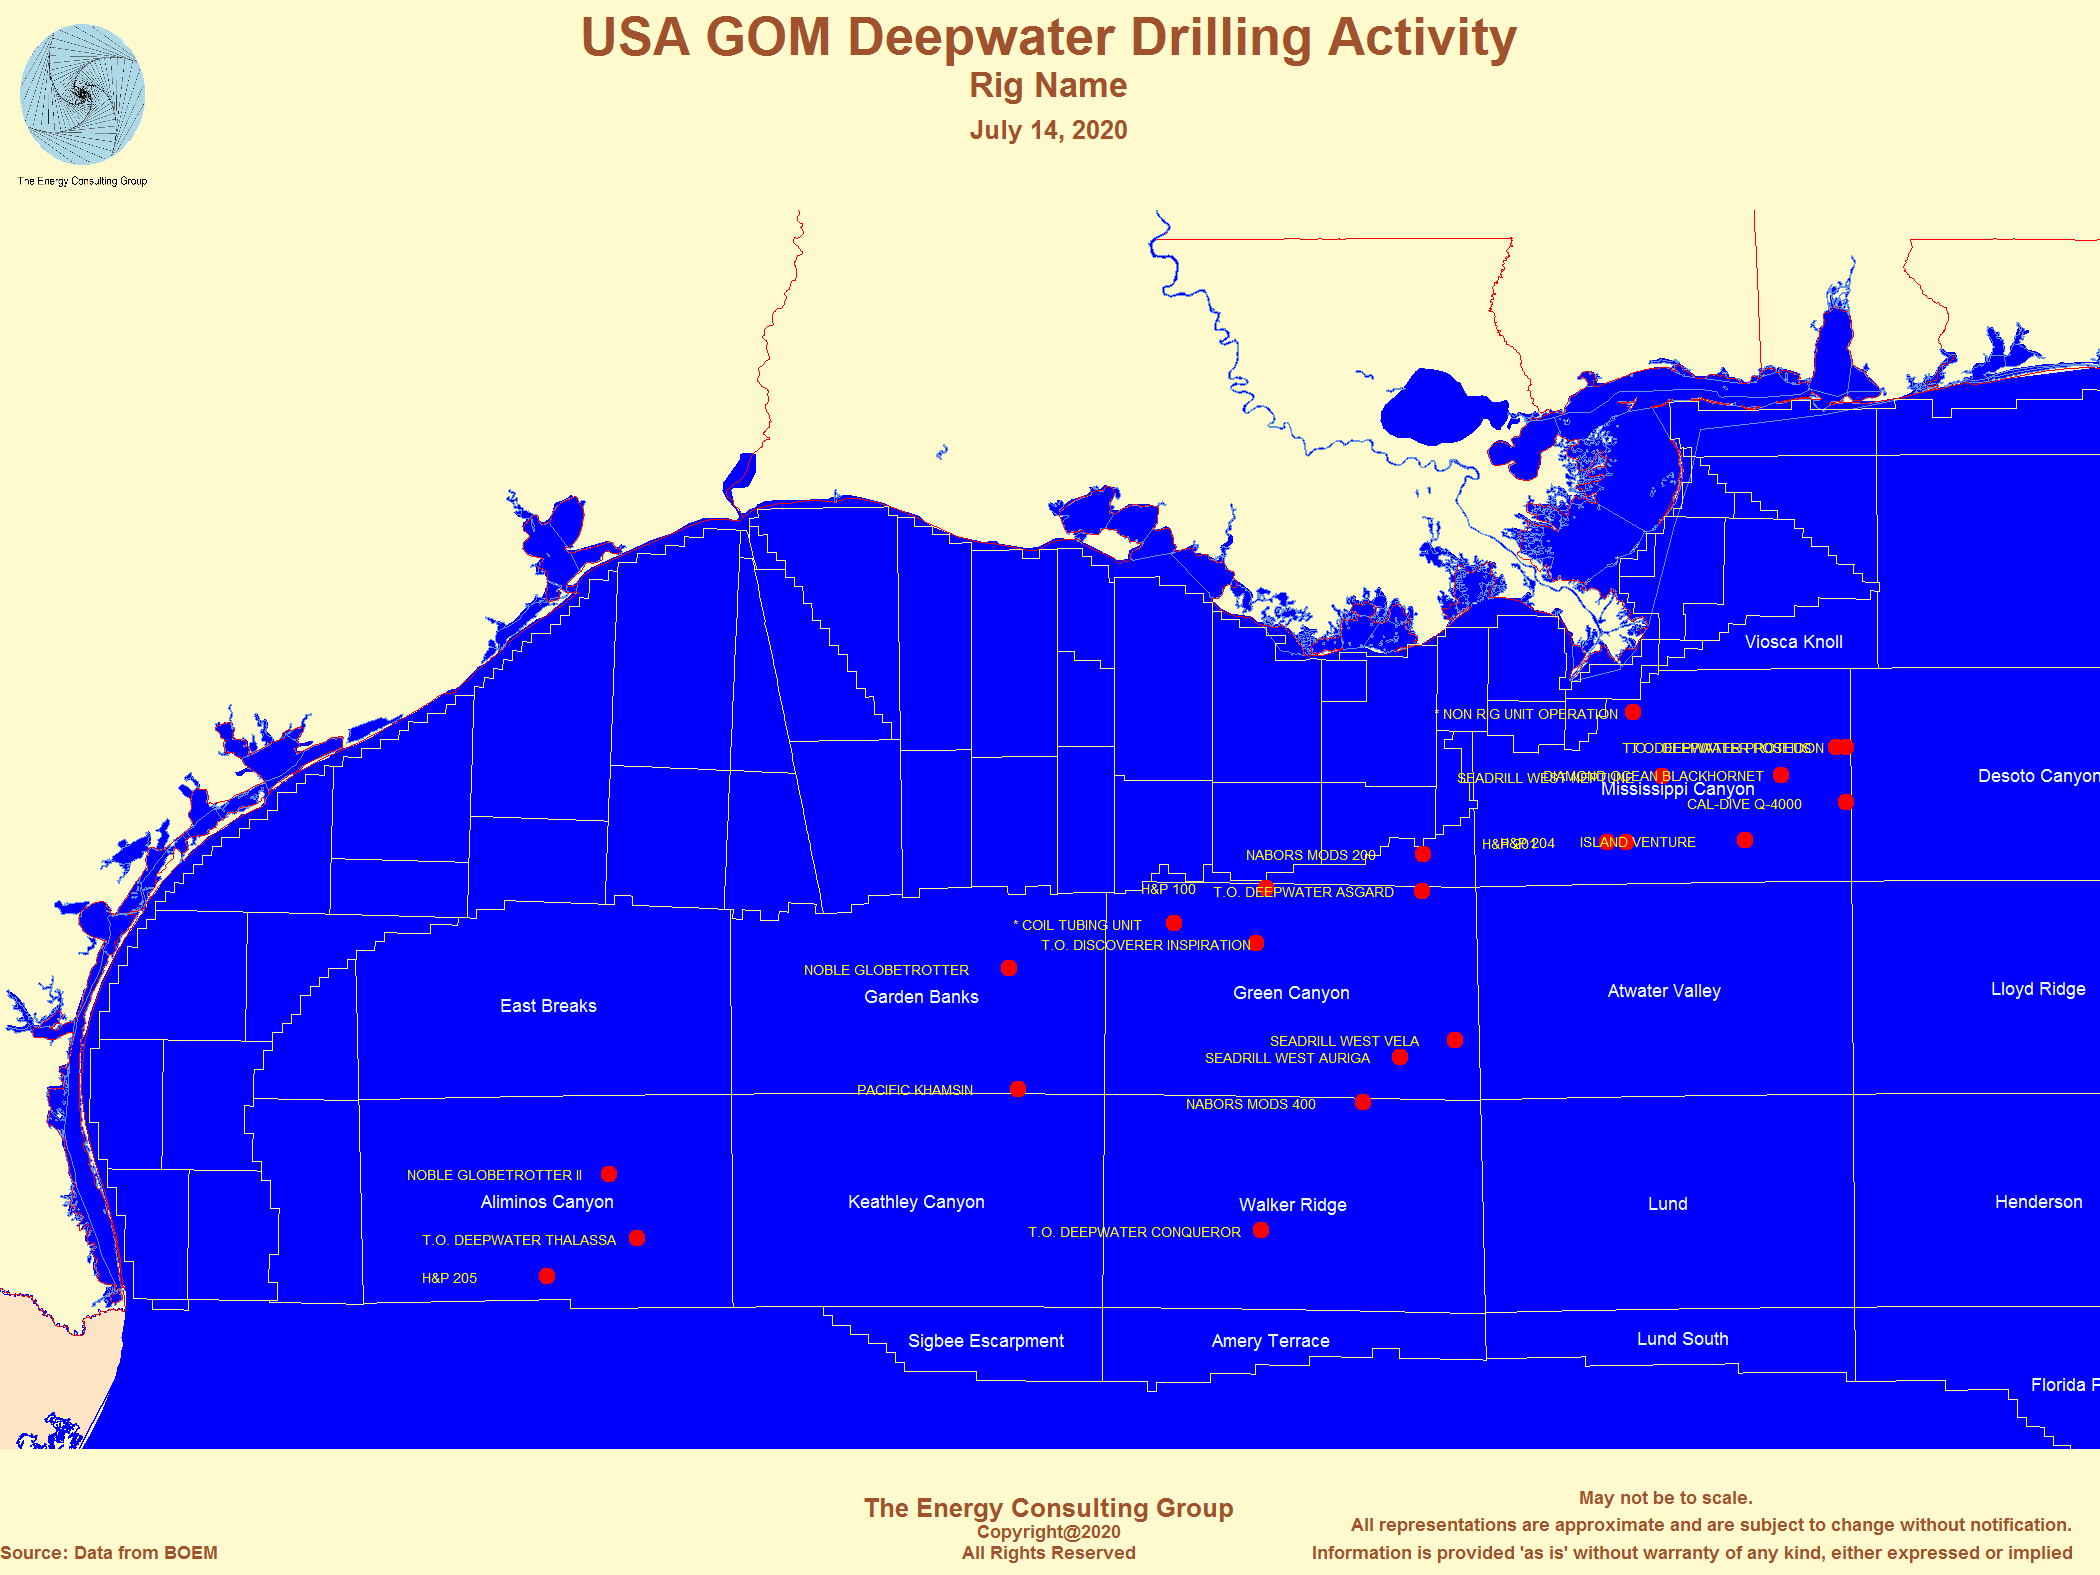
USA GOM Deepwater Drilling
Activity - Rig
July 2020
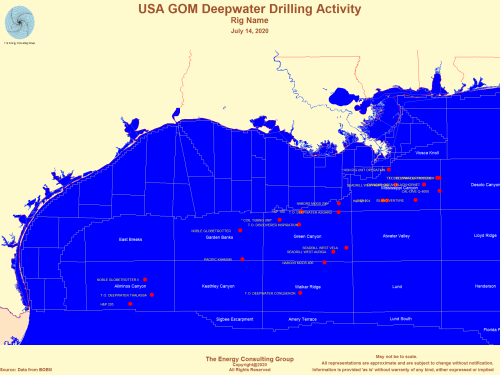
Click the above image, for a full screen
version |
For comparison, check out Gulf of Mexico drilling activity from late
2014
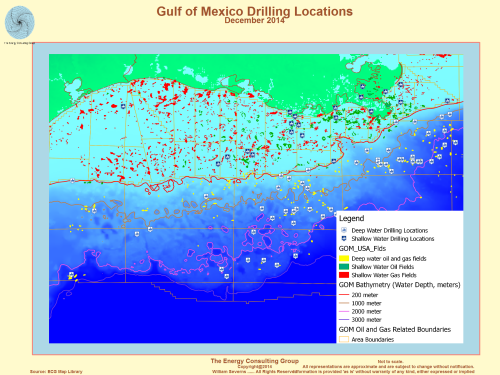
Click the above image, for a full screen
version
|
Deepwater drill ship in the Gulf of Mexico
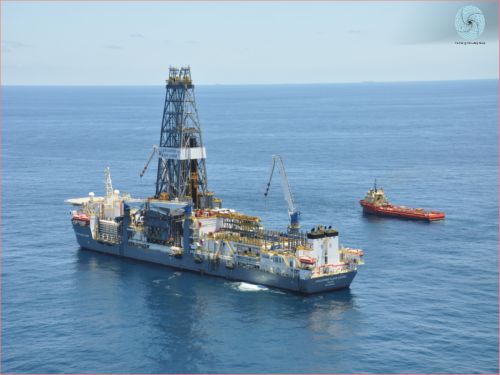
Click the above image, for a full screen
version
Courtesy of the US Coast Guard (USCG) |
Field: Thunder Horse
Blocks:
MC776; MC778; MC737
Water Depth: 5664'
Production Start: 2008
For picture of the platform go here
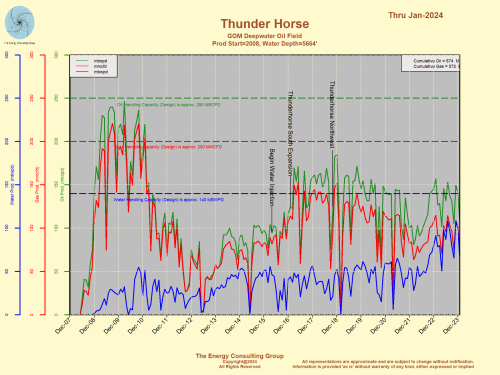
For Full Screen View of the Production Plot, Click Image
|
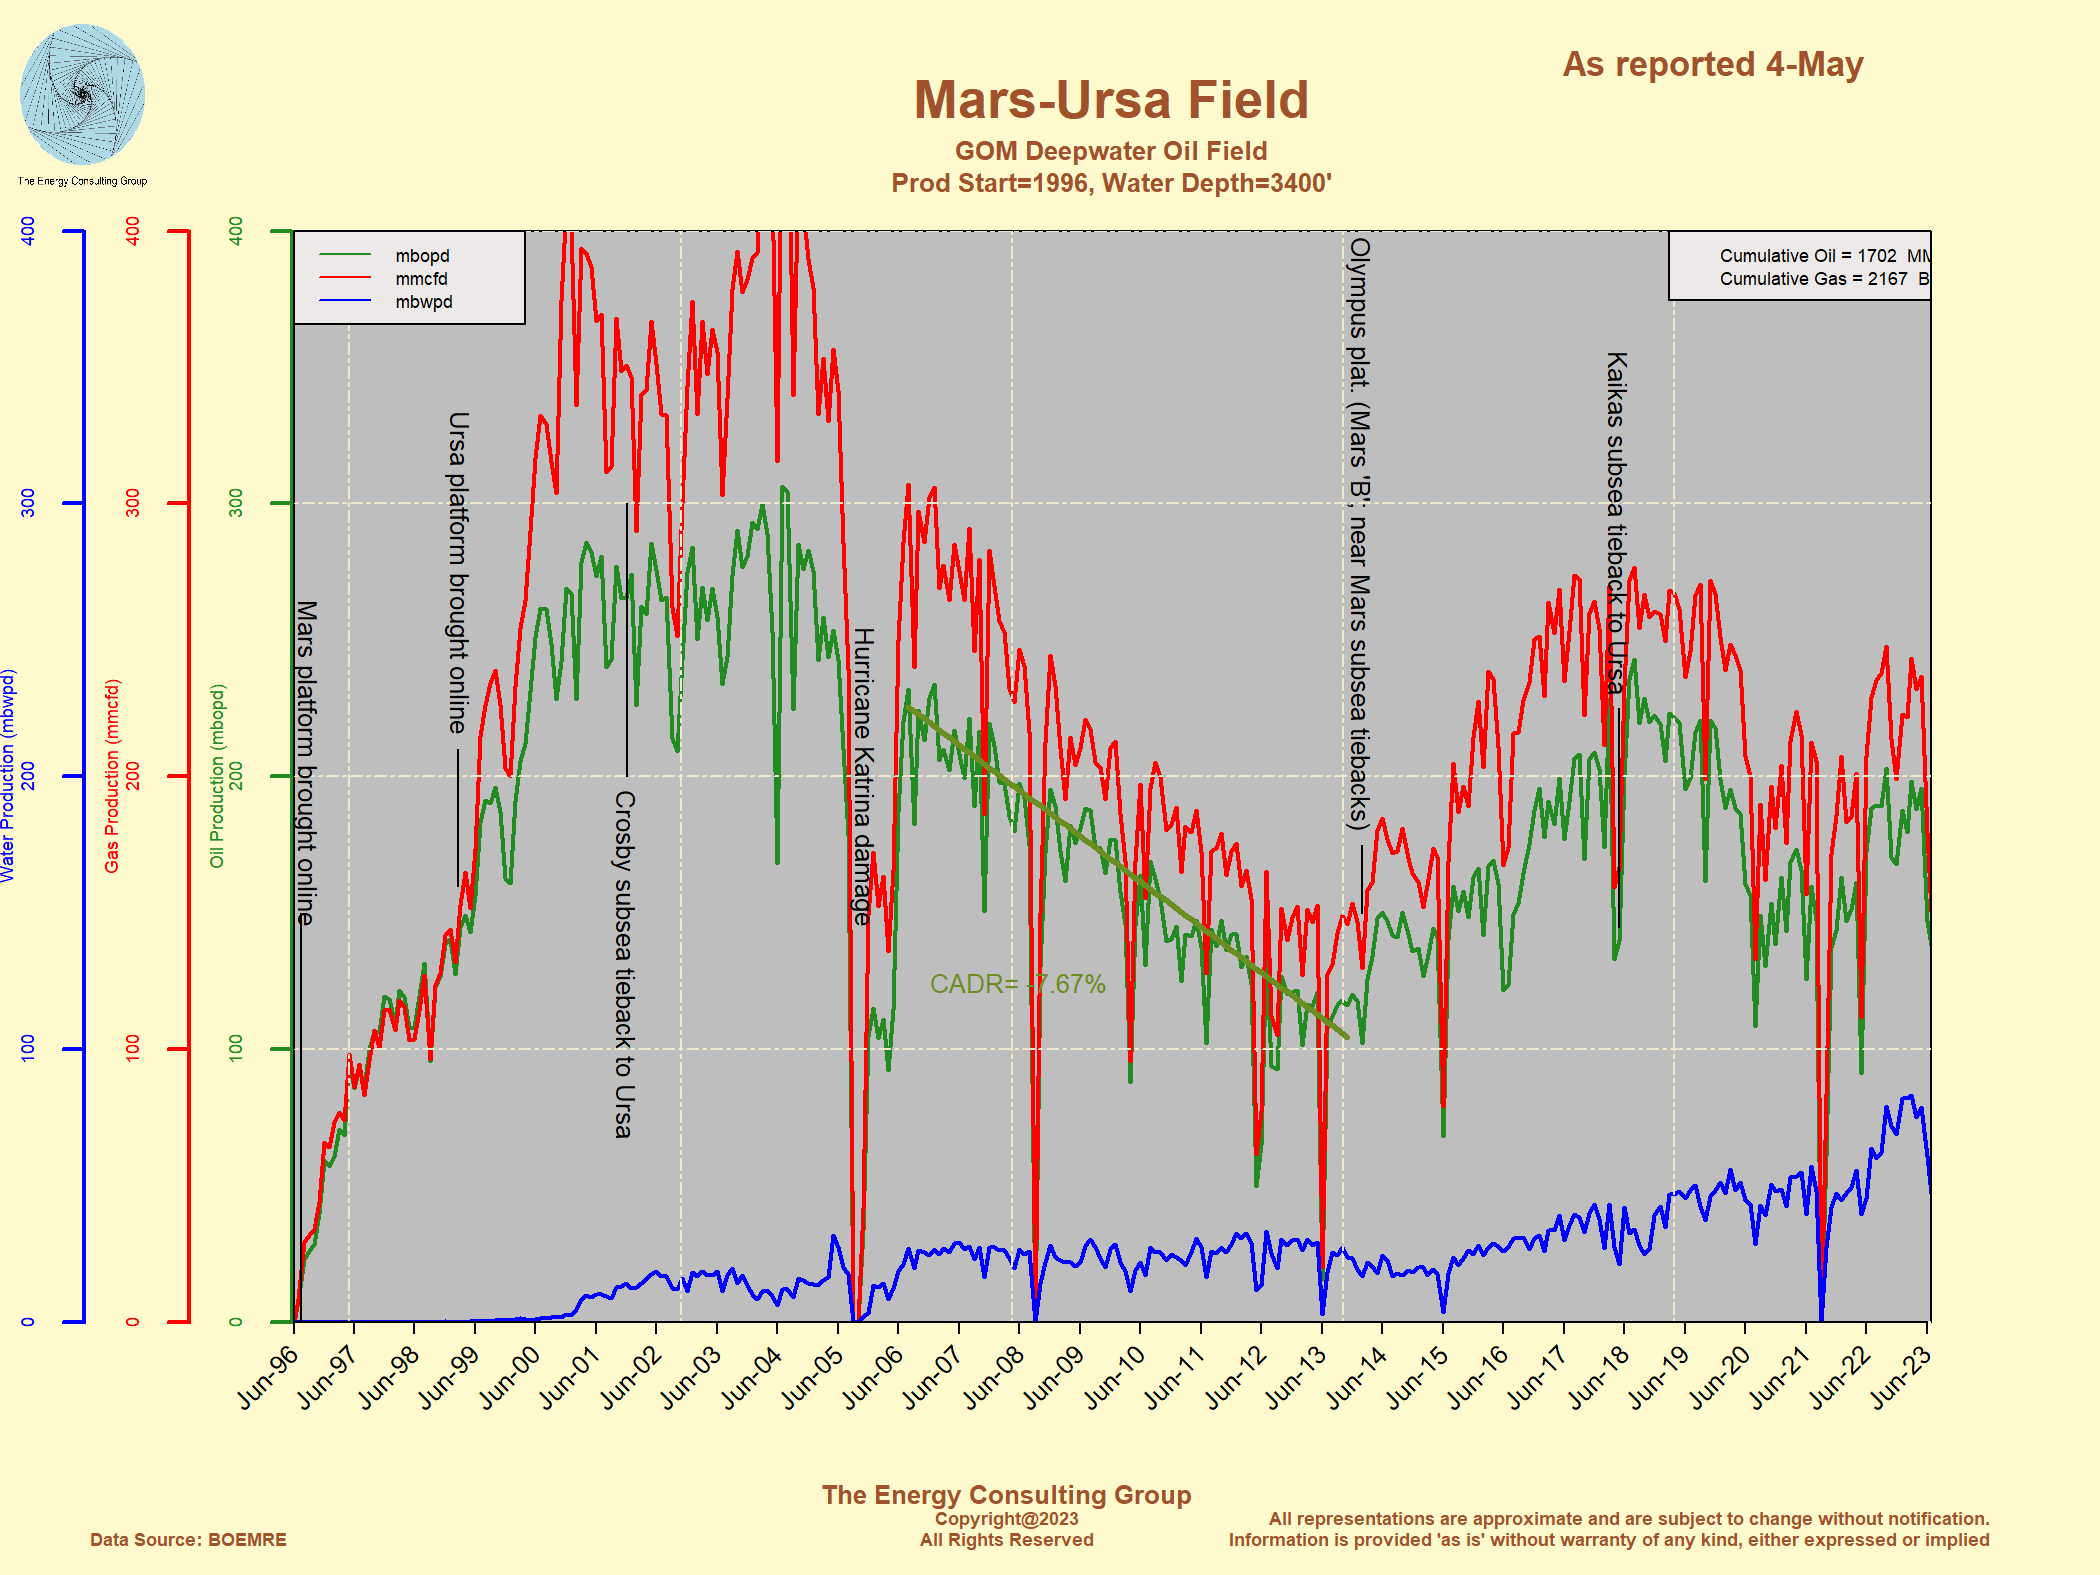
Field: Mars-Ursa, Crosby, Kaikas
Blocks:
MC807; MC935
Water Depth: 3400'
Production Start: 1996
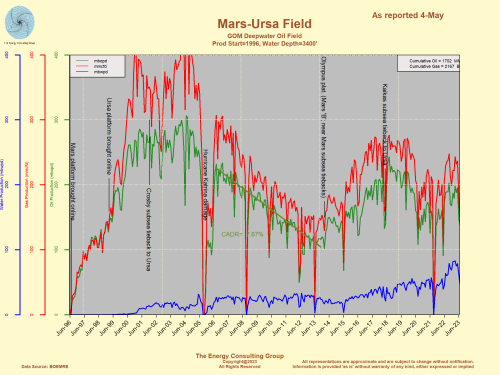
For Full Screen View of the Production Plot, Click Image
|
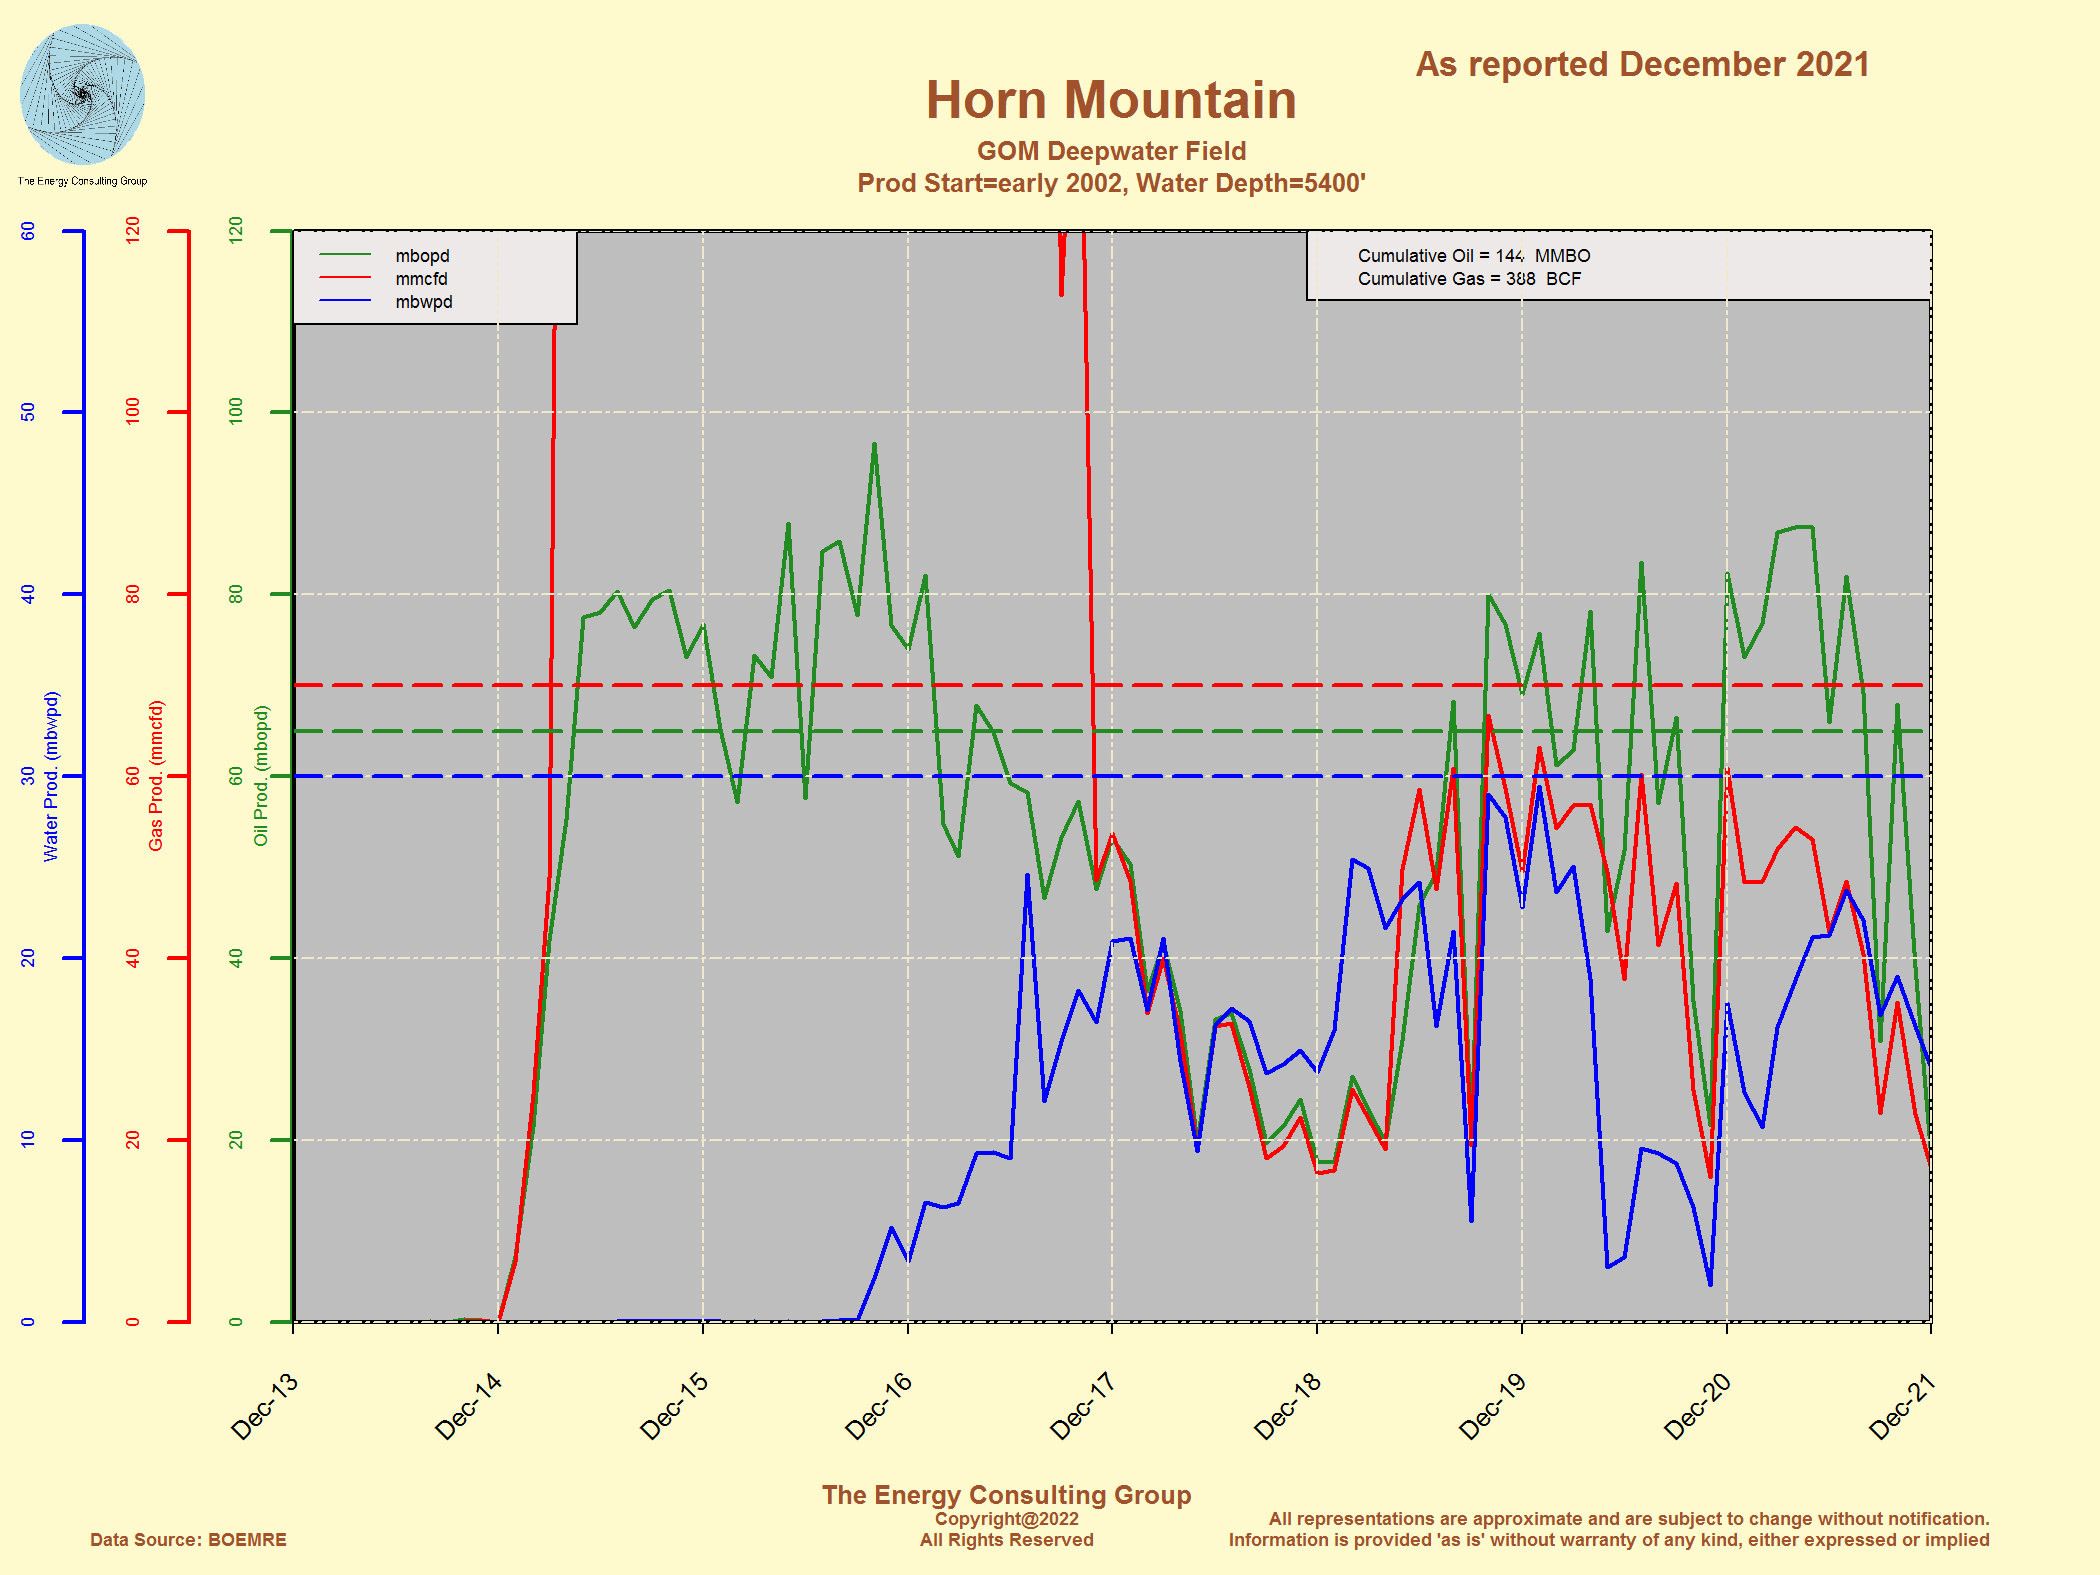
Field: Horn
Mountain
Blocks:
MC084
Water Depth: 5455'
Production Start: 2002
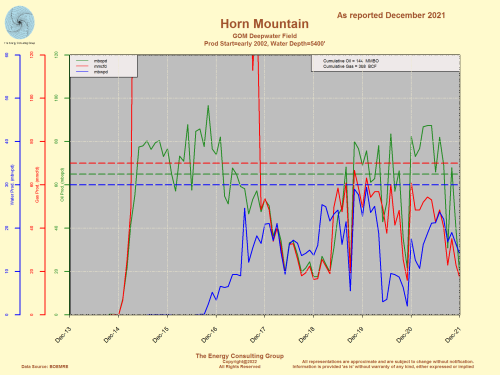
For Full Screen View of the Production Plot, Click Image
|
Field: Atlantis
Blocks: GC743
Water Depth:
6285'
Production Start: 2007
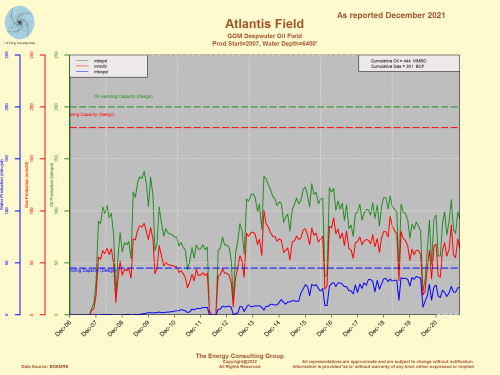
For Full Screen View of the Production Plot, Click Image
|
Thunder Horse PDQ on
Location
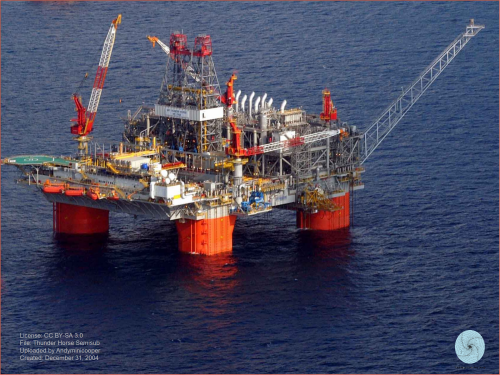
Click the above image, for a full screen
version
|
An improperly installed valve caused the Thunder
Horse PDQ to list severly in the aftermath of Hurricane Dennis. BP
quickly and successfully remedied the situation, resulting in the Thunder
Horse field being one of the largest producers in the Gulf of Mexico.
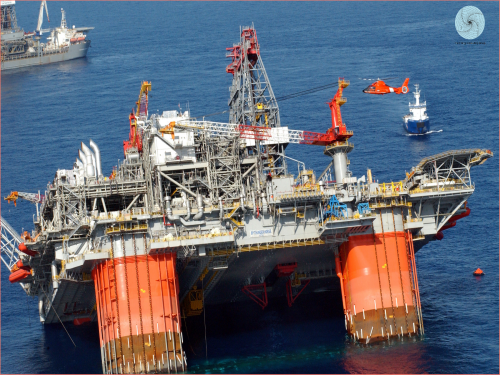
Click the above image, for a full screen
version
Courtesy of the US Coast Guard (USCG) |
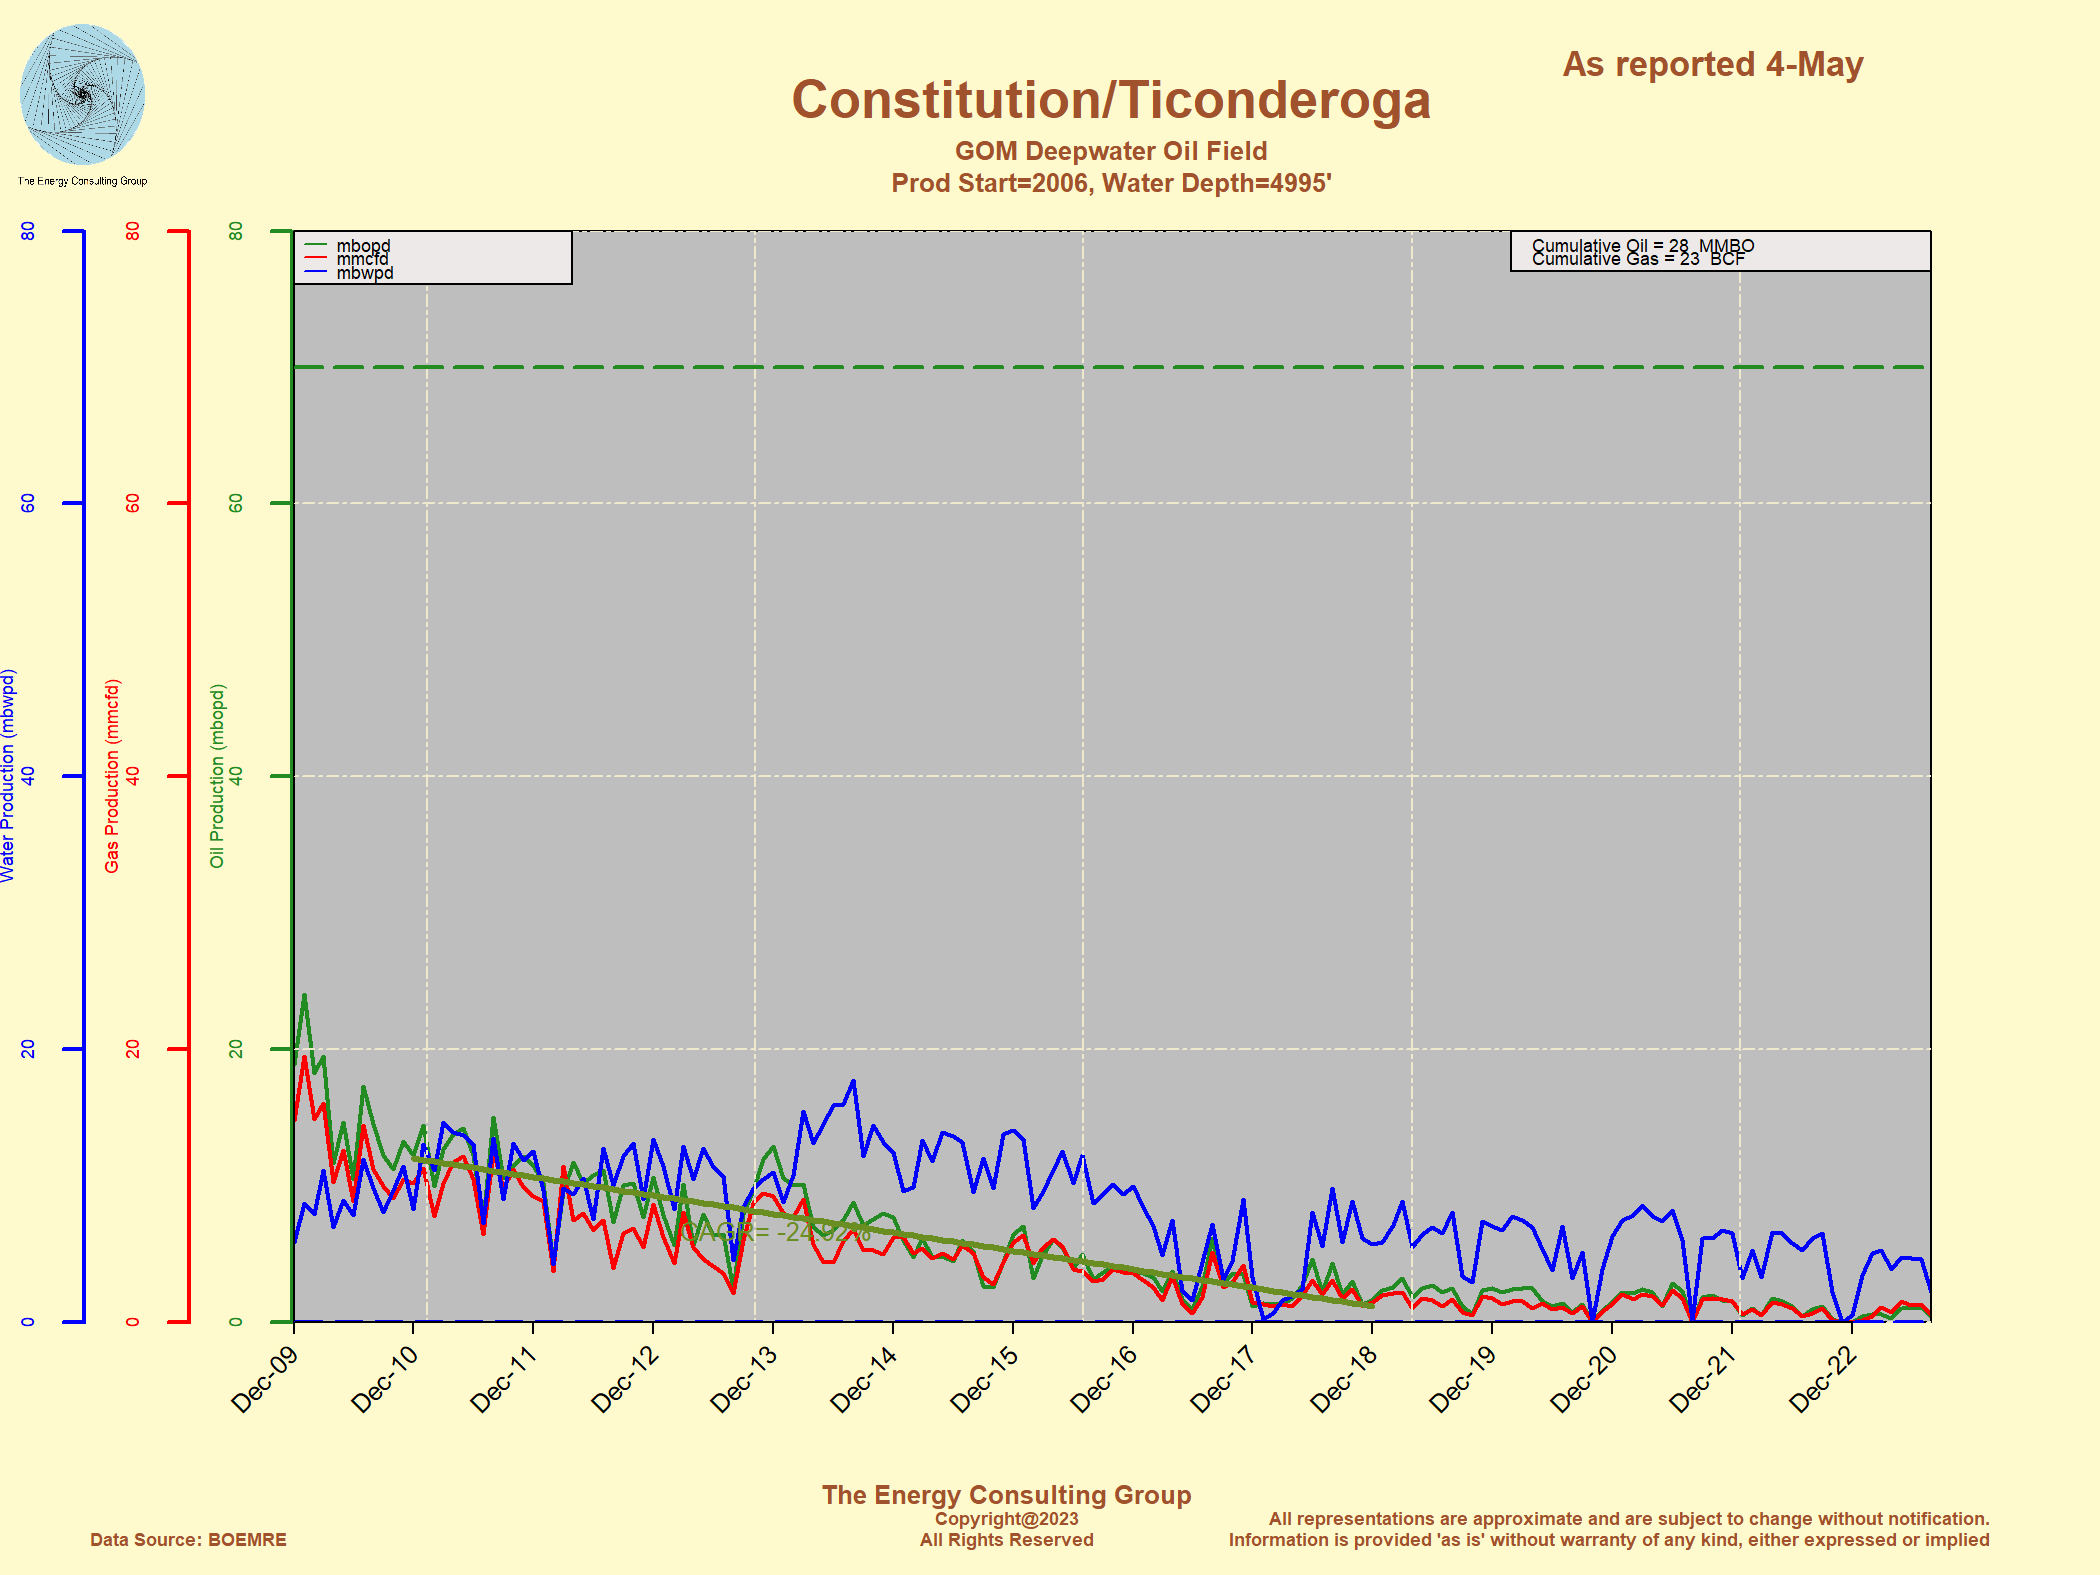
Field: Constitution/Ticonderoga
excludes Ceasar.Tonga
Blocks: GC679, GC680
and GC768
Water Depth: 4998'
Production Start: 2006

For Full Screen View of the Production Plot,
Click Image
|
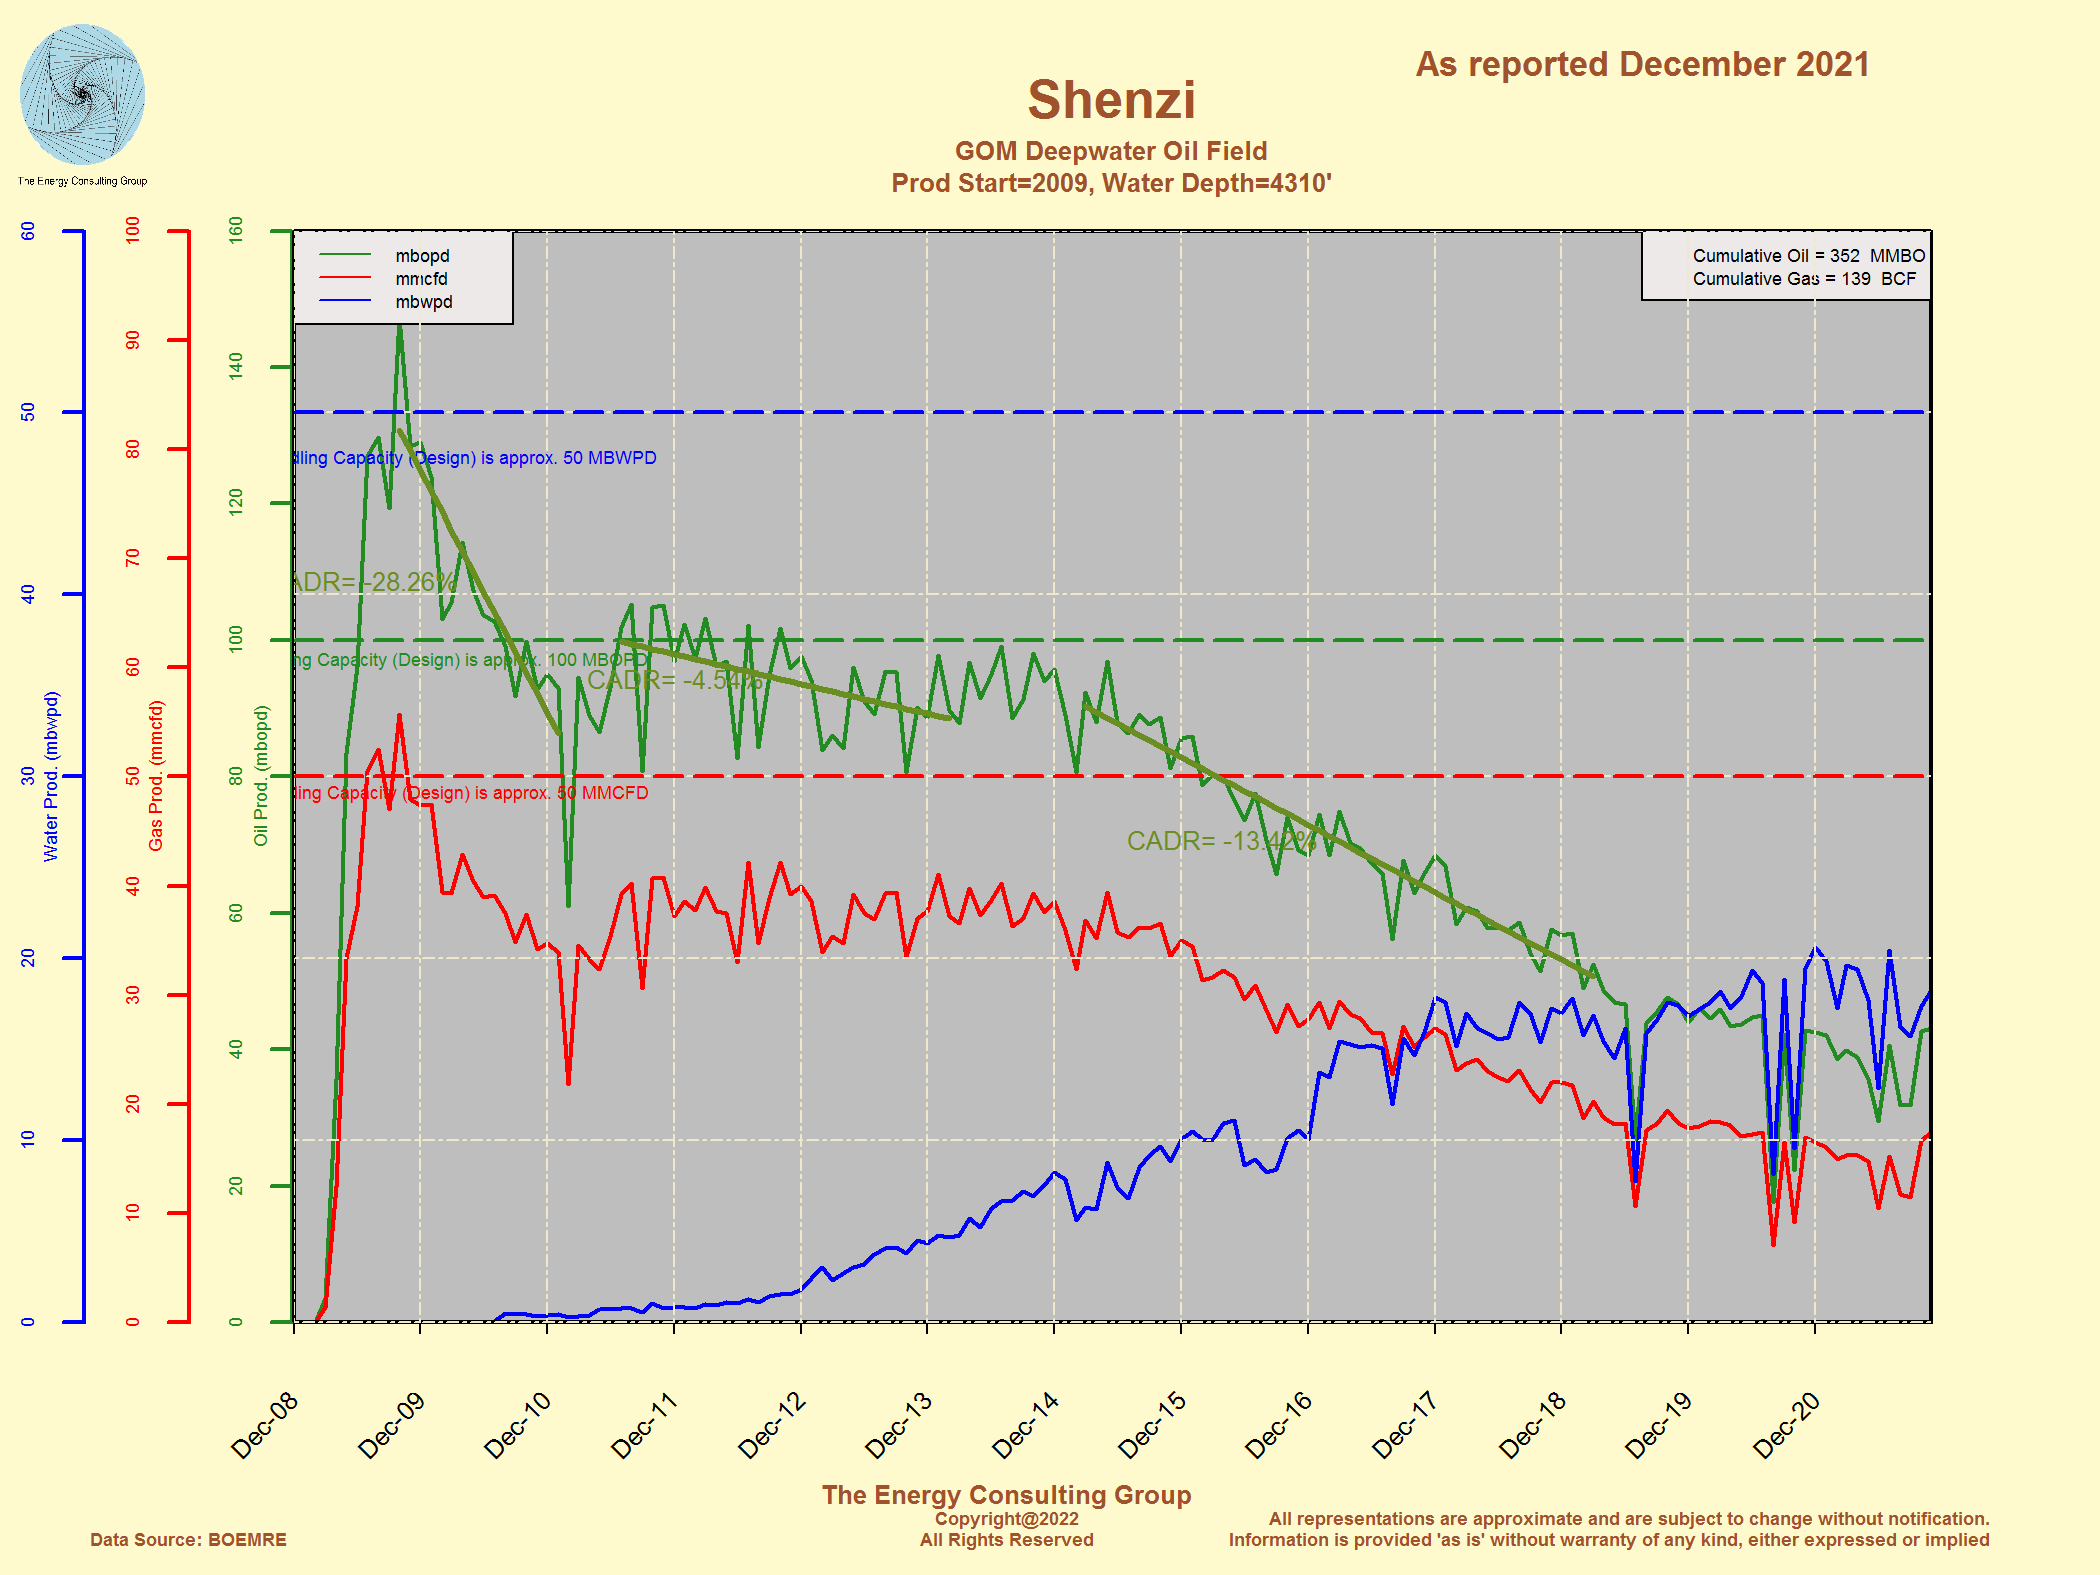
Field: Shenzi
Blocks:
GC609, GC610, GC652, GC653, GC654
Water Depth: 4310'
Production Start: 2007
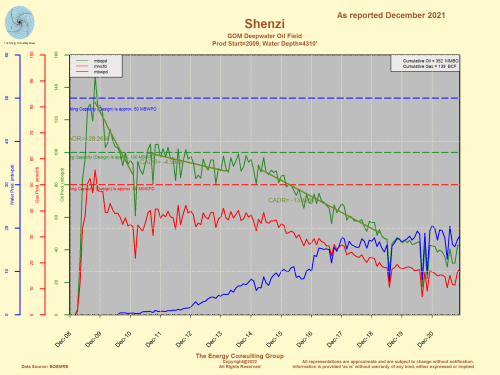
For Full Screen View of the Production Plot, Click Image
|
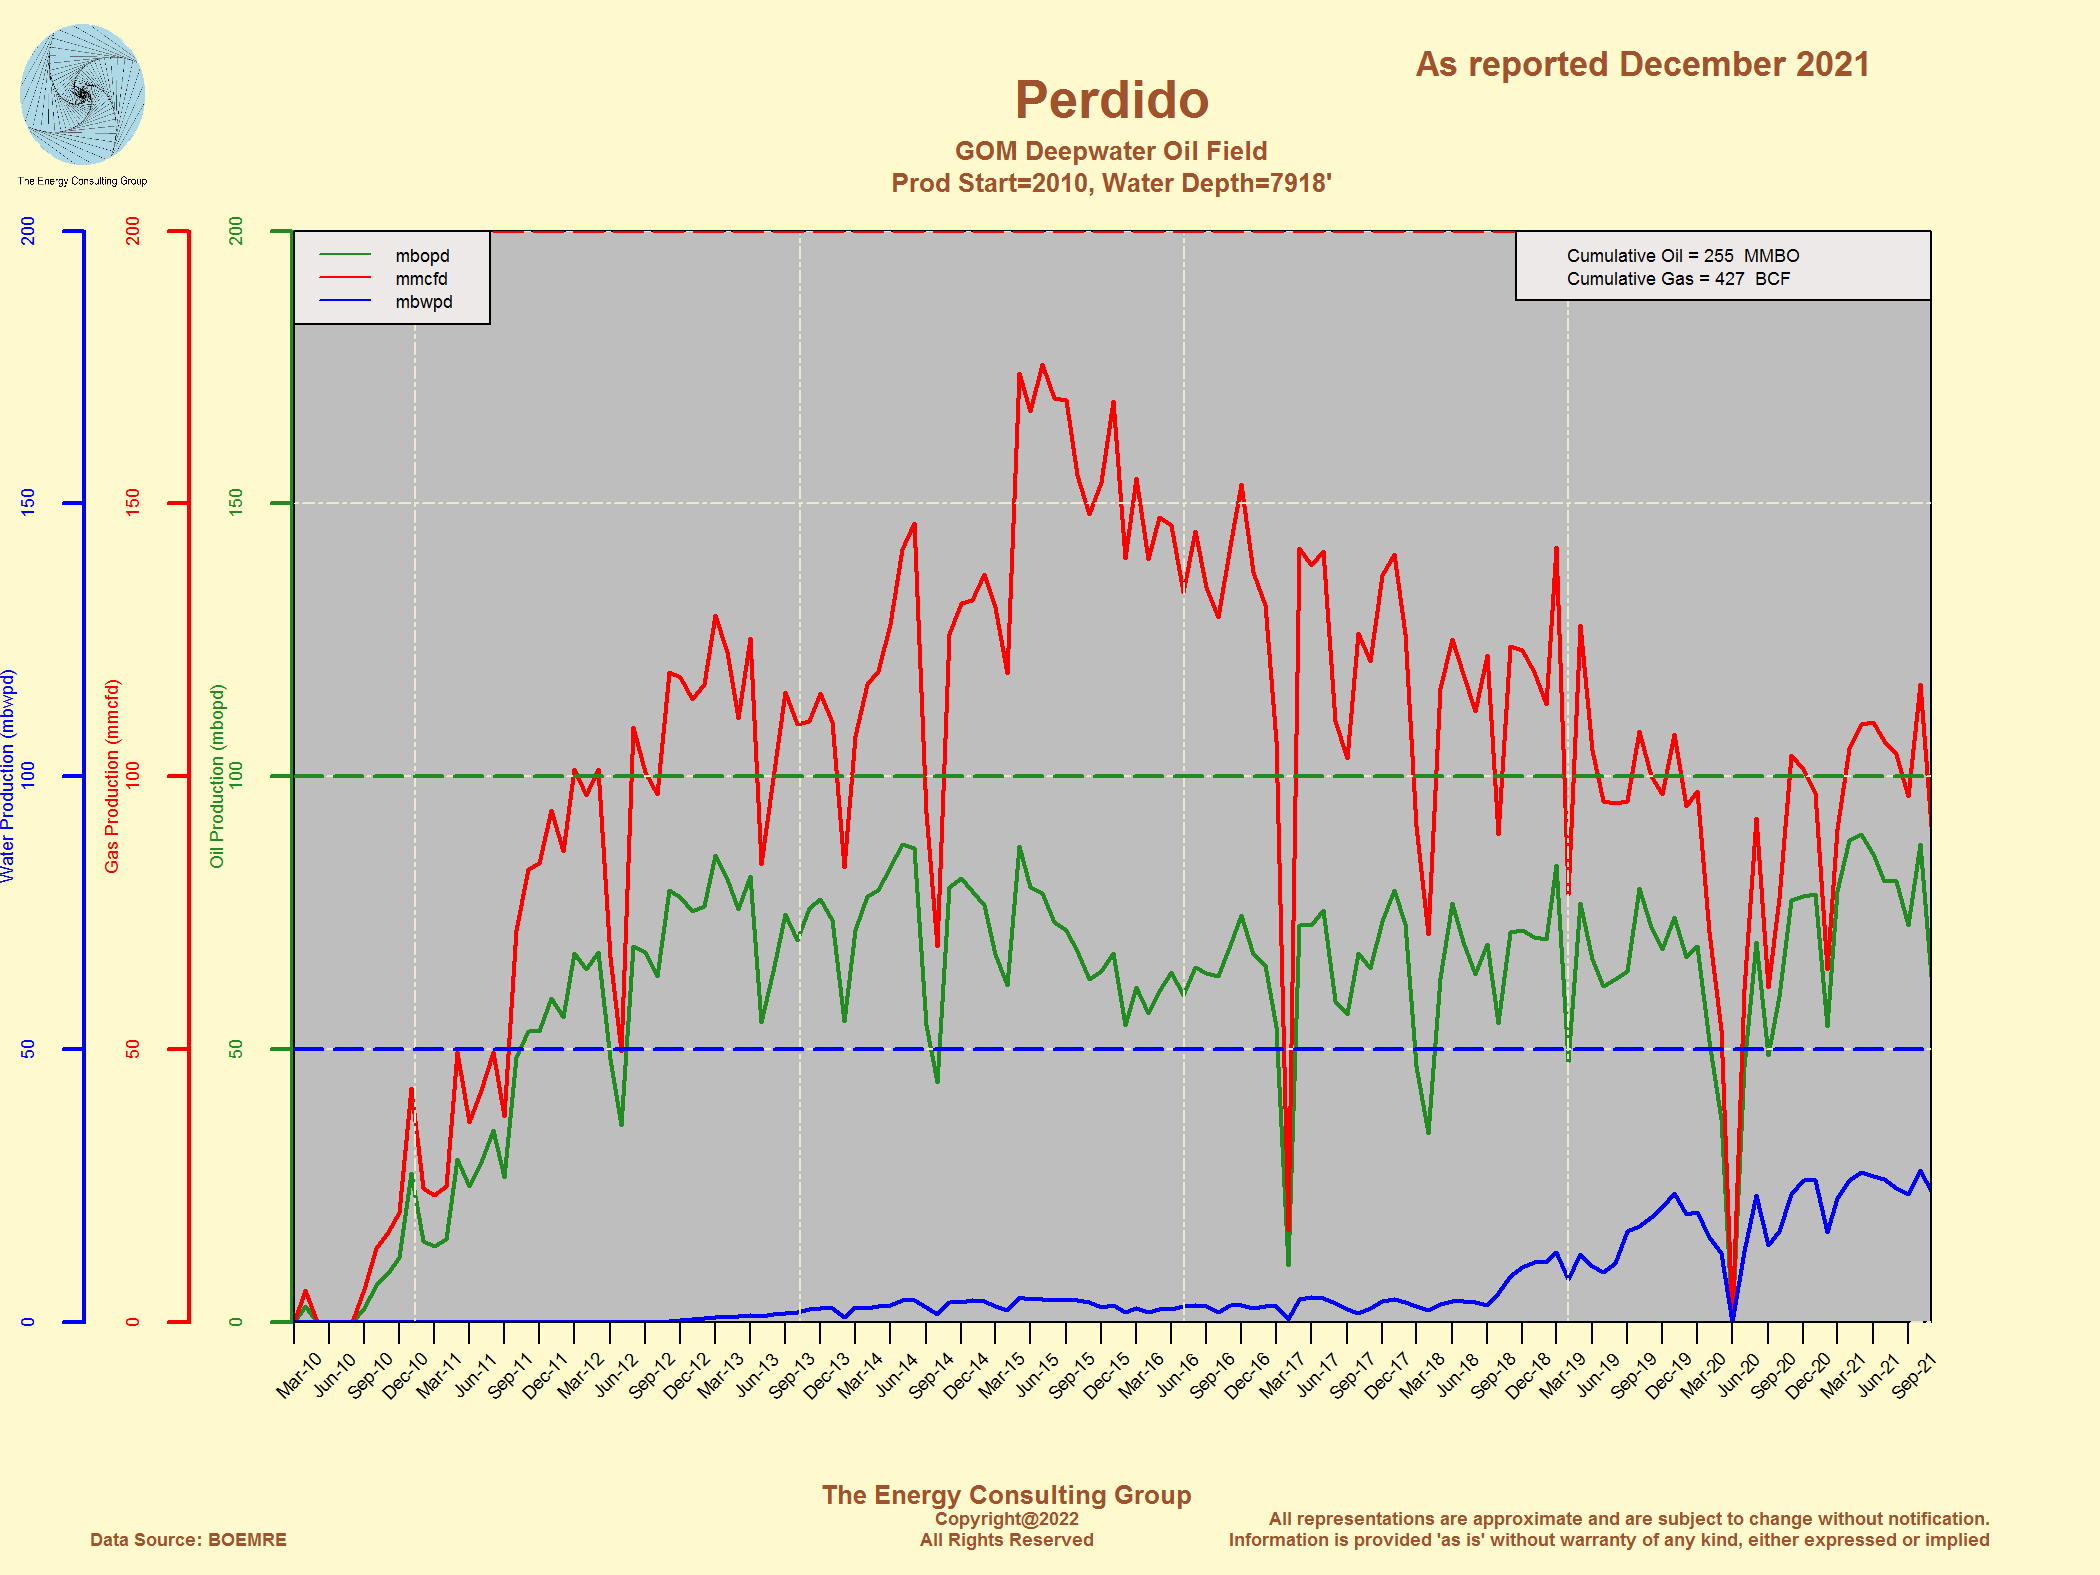
Development: Perdido: Field: AC857; AC859
Blocks: AC821, AC813, AC856, AC857, AC901
Water Depth: 7918'
Production Start: 2010

For Full Screen View of the Production Plot, Click Image
|
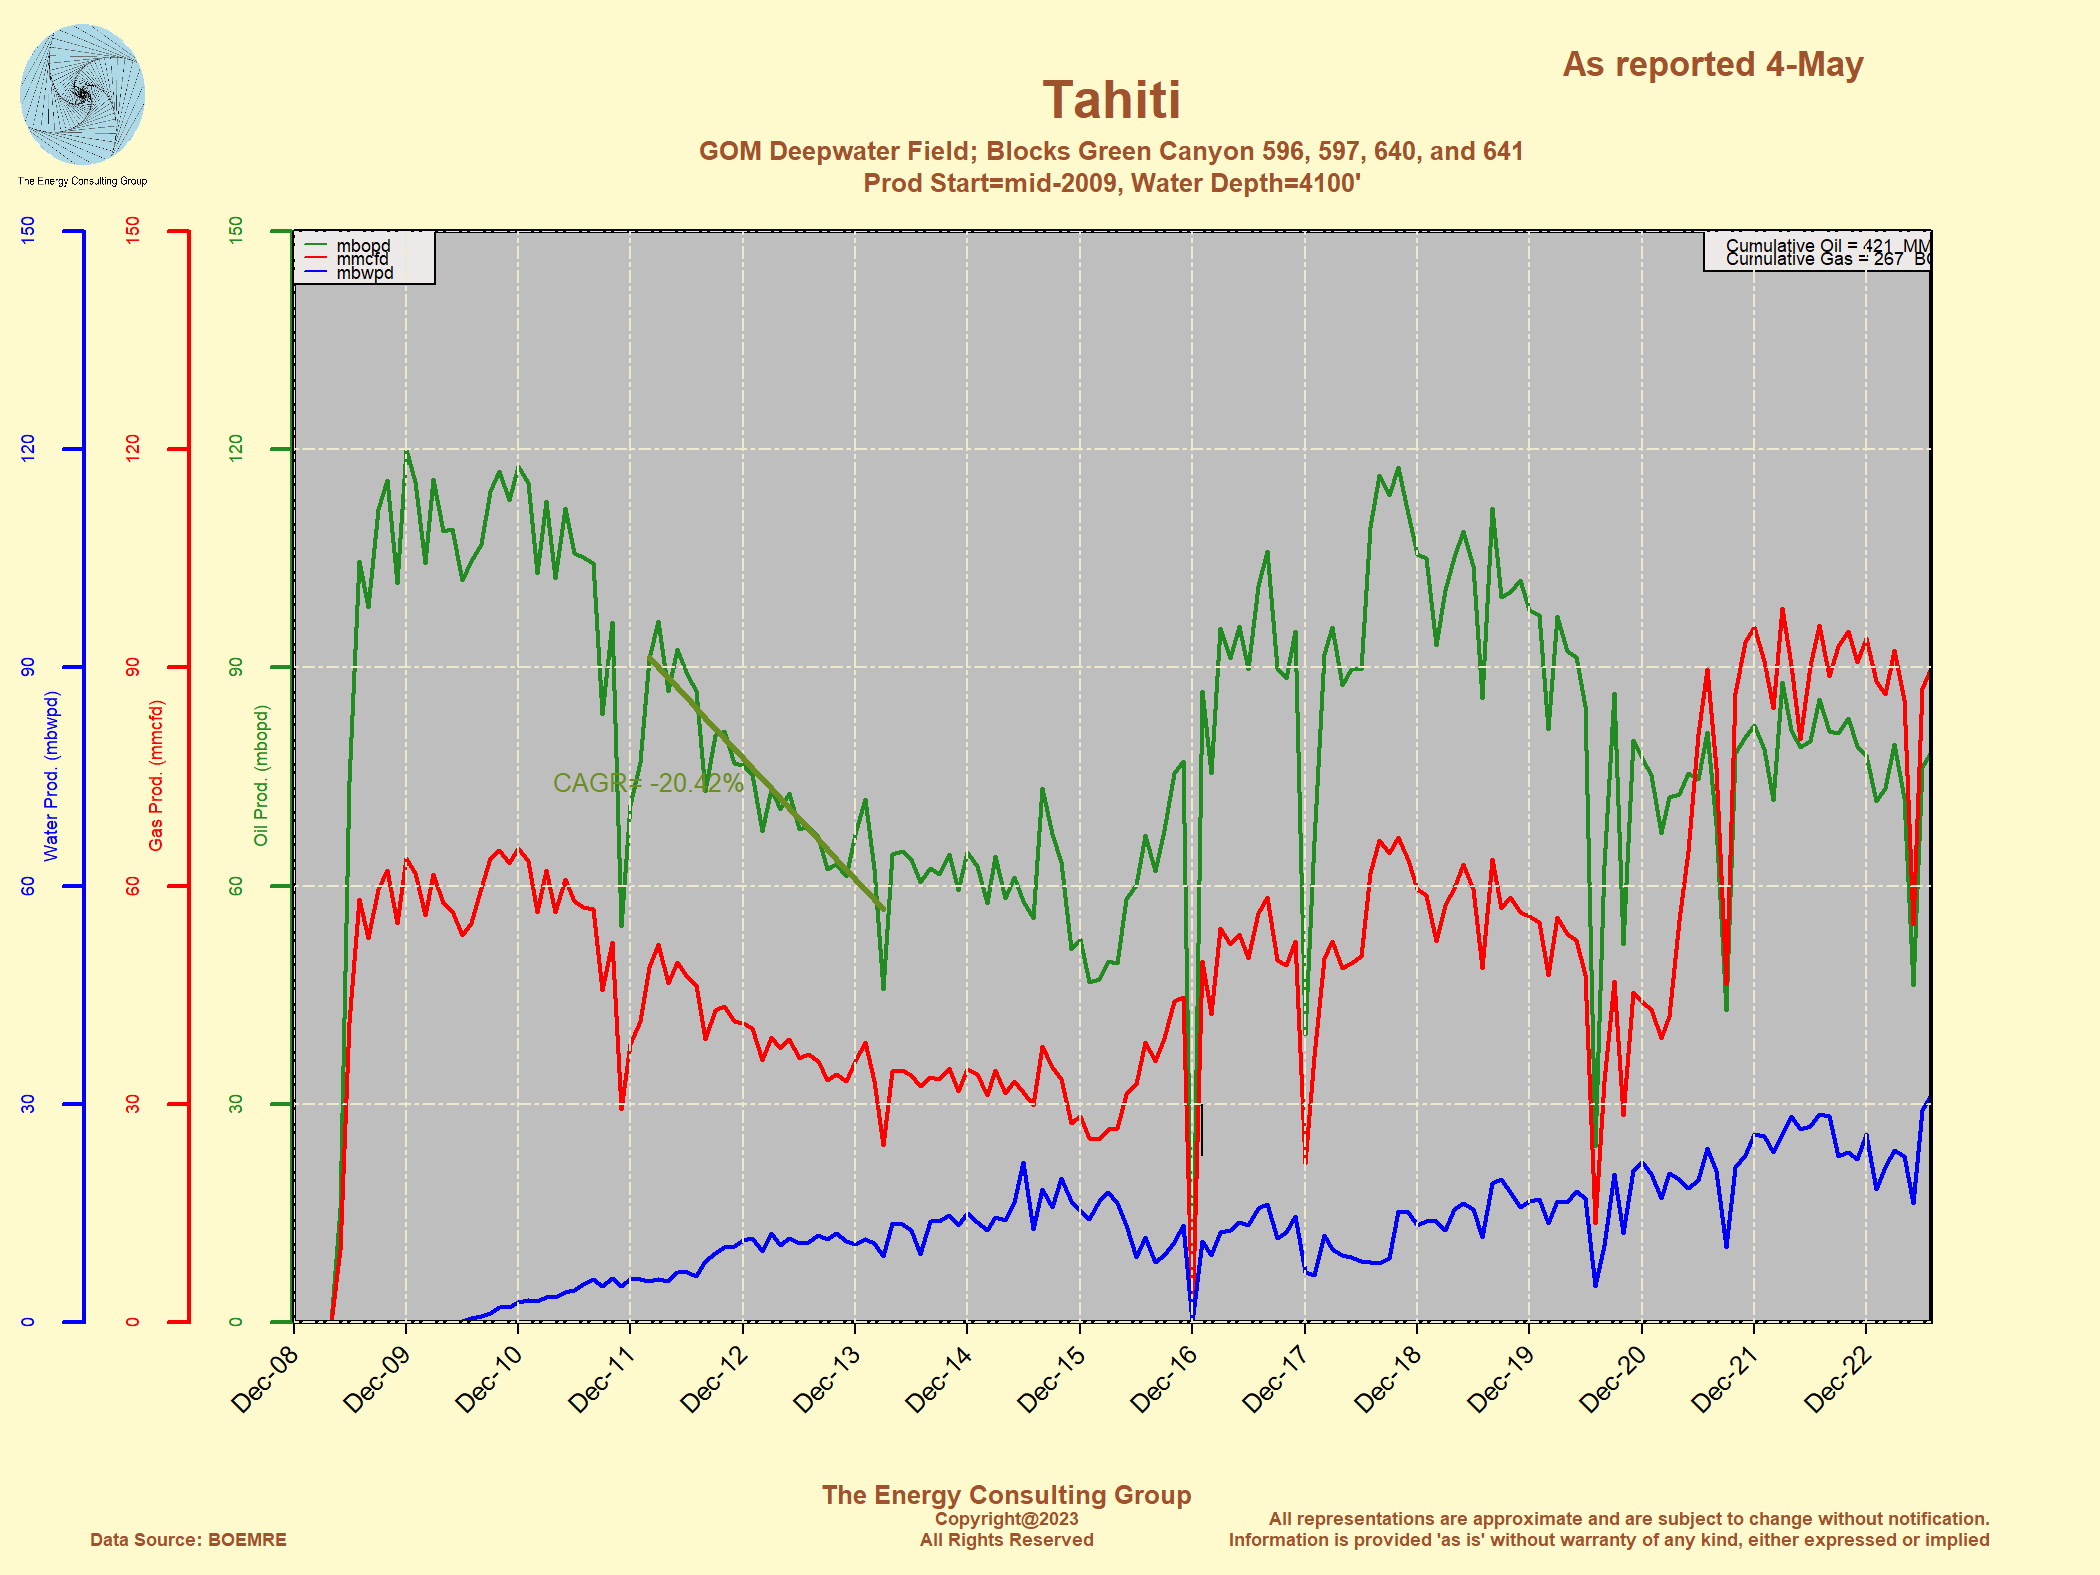
Development: Tahiti: Field: GC640
Blocks: GC596, GC597, GC640, GC641
Water Depth: 4326'
Production Start: 2007
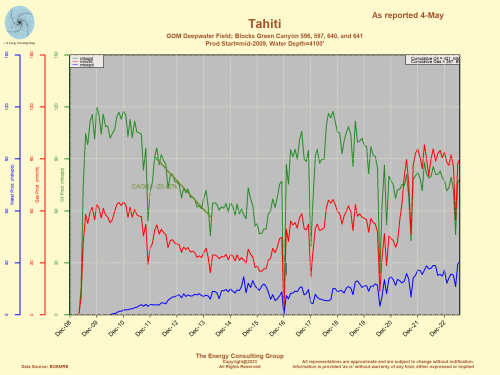
For Full Screen View of the Production Plot, Click Image
|
Development: Jack: Field: WR627, WR678 and WR759
Jack (WR758 and WR759), St Malo (WR634, WR677, WR678), and Julia (WR540,
WR584, WR627)
Water Depth: 7000'
Production Start: 2014
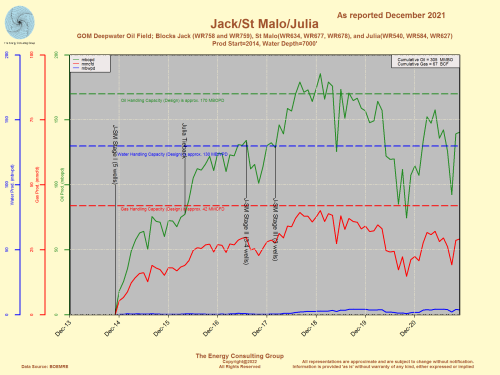
For Full Screen View of the Production Plot, Click Image
|
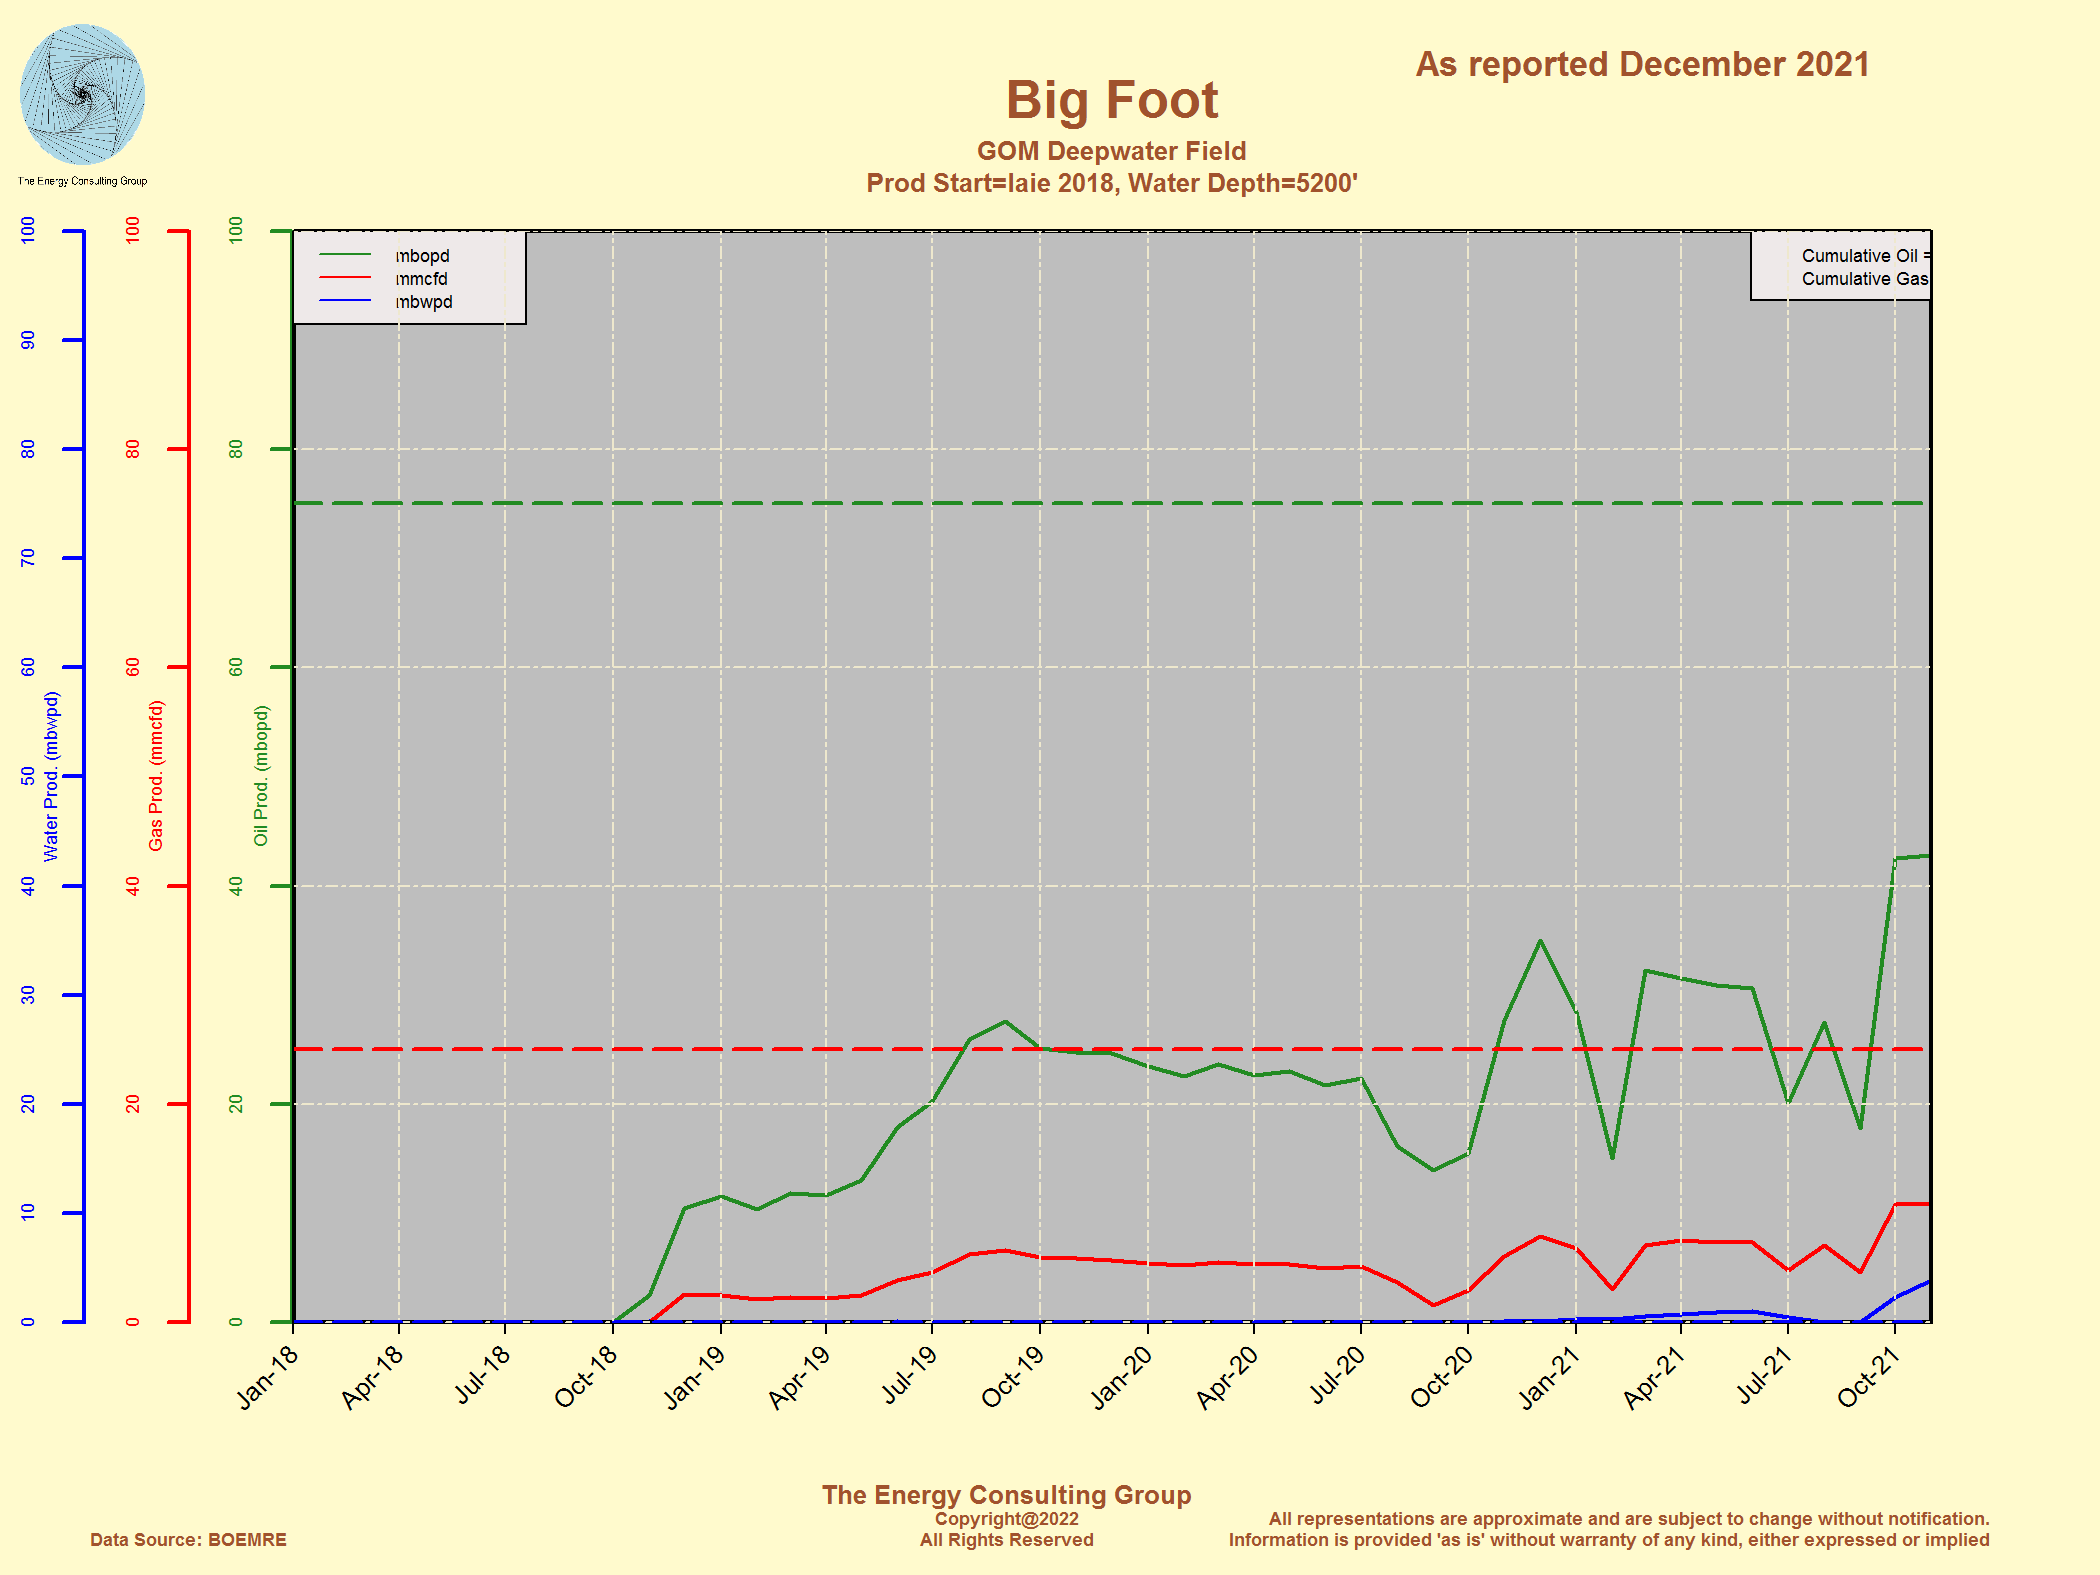
Development: Big Foot (WR 29)
Water Depth: 5200
Production Start: 2018
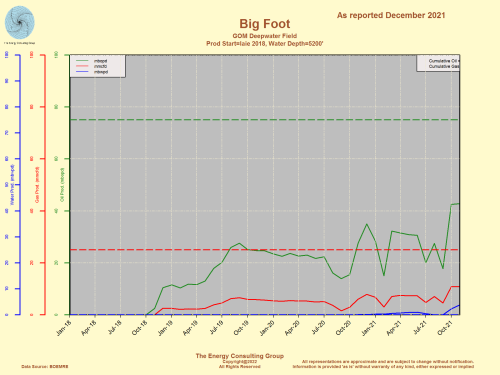
For Full Screen View of the Production Plot, Click Image
Big Foot: After flowing only one well the first 6 months after
production started, the operator brought online a 2nd well in mid-June. |
|
|
|
|
|
|
|
-The Energy Consulting Group home page
|


